



Three Line Strike Pattern








Key takeaways
- The three line strike pattern is a four-candlestick continuation pattern. It appears in both bullish and bearish market trends.
- The first three candles move in the direction of the existing trend. The fourth candle is a large engulfing candle that temporarily moves against the trend.
- Traders generally wait for confirmation before entering a trade.
- The pattern works best when combined with support and resistance levels, volume, and technical indicators.
Markets rarely move in one direction. Prices may pull back slightly in a strong uptrend or downtrend before continuing in the original direction. The pauses are high-probability trade opportunities for traders to watch.
One such continuation pattern is the three line strike. It is not that common, but many traders pay close attention to it as it can be a sign of the prevailing trend likely to continue after a short counter-move.
In this article, you will learn what the three line strike pattern is, the bullish and bearish versions of the pattern, how to identify it, how to trade it, its strengths and weaknesses, and the common mistakes to avoid.
What is the Three Line Strike Pattern?
The three line strike is a four-candle Japanese candlestick pattern, which is generally used to indicate a continuation of an existing trend.
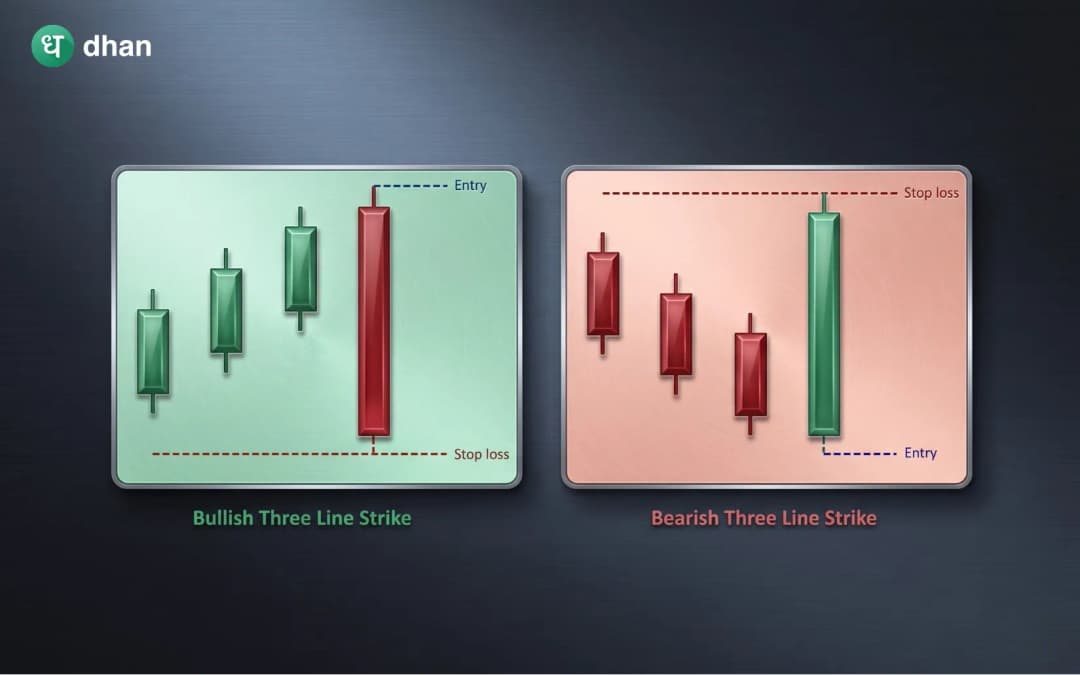
It is composed of four candlesticks. The first three candles are in the direction of the prevailing trend with strong buying or selling momentum. The fourth candle is a large candlestick which completely engulfs the previous three candles and moves in the opposite direction.
This is a sharp counter-move, but the pattern often signifies that the original trend is likely to continue after a temporary pullback.
The fourth candle may look like a reversal at first glance. But the pattern often indicates a temporary shakeout of traders before the original trend resumes.
Because this pattern is rarely seen, traders will typically use this along with other technical analysis tools and not by itself.
Types of Three Line Strike Pattern
There are two variations of the pattern.
Bullish three line strike pattern
The bullish three line strike pattern appears during an existing uptrend.
It consists of:
- Three bullish candles in a row.
- Each candle finishes higher than the one before.
- Higher highs and higher closes suggest strong buying pressure.
- The fourth candle is a big bearish candle.
- The bearish candle closes lower than the opening price of the first bullish candle and completely engulfs the three candles before it.
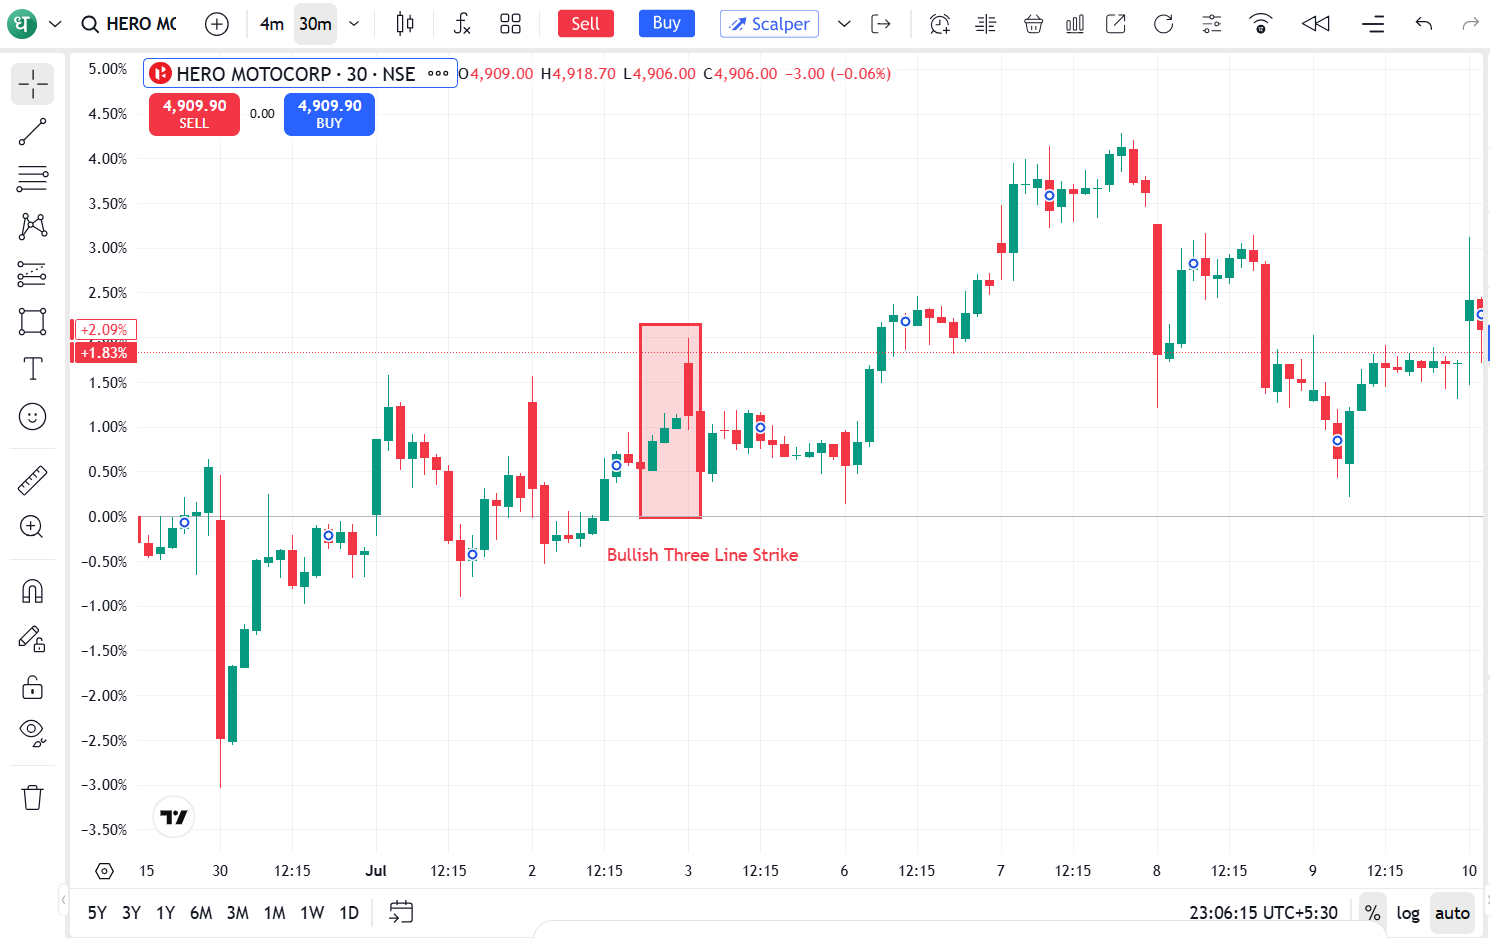
The fourth candle looks bearish, but it is mostly profit booking or panic selling before the buyers take over.
Bearish three line strike pattern
The bearish three line strike pattern appears during a downtrend.
It consists of:
- Three consecutive bearish candles.
- The candles are making lower lows and lower closes.
- The fourth candle is a big bullish candle.
- The bullish candle completely eliminates the three preceding bearish candles and closes above the opening price of the first candle.
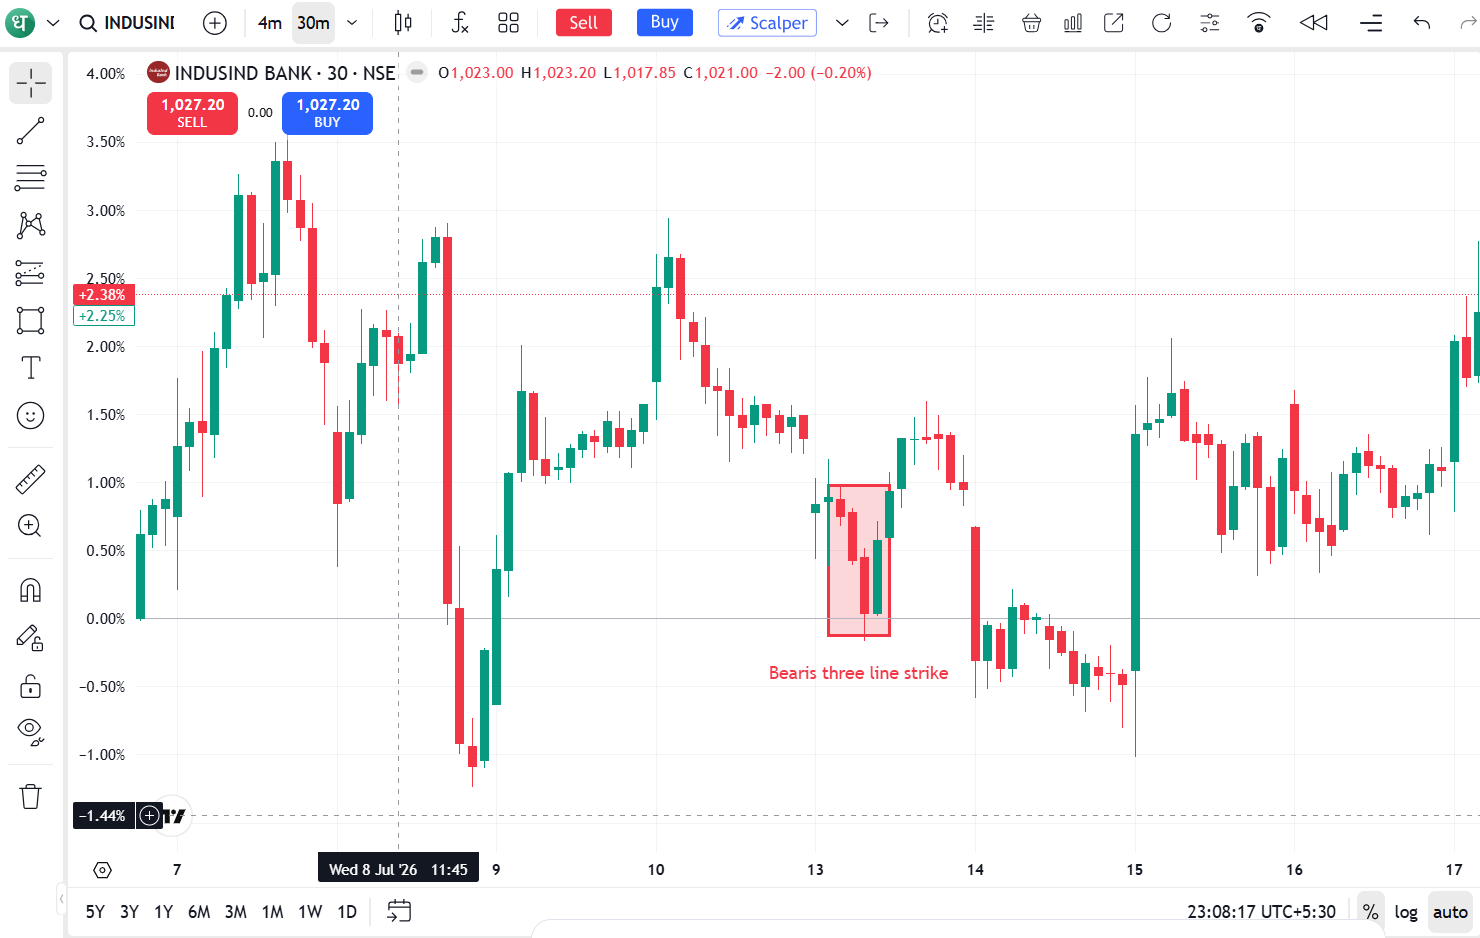
This sharp upward move may trap buyers, after which the primary downtrend often continues.
What does the Three Line Strike Pattern indicate?
The interesting thing about the pattern is the psychology behind it.
Traders are seeing a strong trend developing in the first three candles.
Then a large counter-trend candle comes out of nowhere. A lot of traders think the trend has reversed and they exit their positions.
However, if the next candle continues the original trend, then the move against the trend was temporary. The market basically shakes out the weak hands before it continues in the original direction.
This is why many traders consider it a continuation rather than a reversal pattern.
How to trade the Three Line Strike Pattern?
Since the fourth candle is unusually long, it is considered safer to wait for confirmation.
Step 1: Identify the existing trend
The three line strike pattern needs to form in a strong and clear uptrend or downtrend. Make sure the market is already moving in a clear direction before you think about a trade. It is best to avoid trading this pattern in a sideways or highly volatile market condition, as the signals are not reliable.
Step 2: Wait for confirmation
Do not enter a trade as soon as the strike candle is formed. Wait for the next candle to confirm that the original trend is resuming. The chances of a successful trade are improved if the confirming candle moves in the direction of the current trend.
Step 3: Enter the trade
Once the confirmation candle has shown support for the trend continuing, you can look to enter the trade. If you see a bullish three line strike pattern, enter after you see confirmation that the uptrend has resumed. With a bearish three line strike pattern, enter when the downtrend is confirmed to continue.
Step 4: Place the stop-loss
Risk management is the key when trading any candlestick pattern. For a bullish setup, the stop-loss should be placed below the low of the strike candle.
In the bearish set up, place the stop loss just above the high of the strike candle. This helps limit potential losses if the trade moves against your expectations.
Step 5: Book profits
Have an exit plan before you enter the trade. You may set your profit targets using previous swing highs or swing lows, use a favourable risk-reward ratio such as 1:2 or 1:3, apply a trailing stop-loss to lock in gains as the trade moves in your favour, or exit near important technical resistance or support levels.
Advantages and limitations of the Three Line Strike Pattern
The table below highlights the key benefits and potential drawbacks of relying on the three line strike pattern.
Common mistakes traders make when trading the Three Line Strike Pattern
Many traders misuse the pattern because of its unusual structure.
Some common mistakes include:
- Enter after the strike candle is complete.
- Ignoring the trend of the market.
- Trading without confirmation.
- Not having a stop-loss.
- Using the pattern as the sole trading signal.
- Without trading volume and support or resistance levels.
Avoiding these mistakes can improve trading discipline.
Summing up
The three line strike is a particular continuation candlestick pattern used by traders to identify opportunities in an ongoing trend. The fourth candle may look like a reversal, but the pattern is generally a brief pullback before the current trend resumes.
Because the pattern is rare, traders should not rely on it in isolation. When combined with trend analysis, volume, support and resistance levels and technical indicators, it can greatly improve decision-making.
FAQs
1. Is the three line strike pattern bullish or bearish?
It can be both. A bullish version appears during an uptrend, while a bearish version appears during a downtrend. Both generally indicate trend continuation rather than reversal.
2. Is the three line strike pattern reliable?
It can be reliable if used with confirmation signals, technical indicators and proper risk management. It alone may generate false signals.
3. Which timeframe is best for the three line strike pattern?
The pattern works across multiple time frames from intraday to daily to weekly. Longer periods tend to give stronger signals.
4. Should beginners trade the three line strike pattern?
This pattern works on multiple timeframes, including intraday, daily and weekly charts. The higher timeframes usually give stronger signals.
5. Can the three line strike pattern be used for intraday trading?
Yes. Intraday traders can use it on shorter timeframes but need to be coupled with volume analysis, trend confirmation, and correct stop-loss placement.







