



Thrusting Line Candlestick Pattern








Key takeaways
- The thrusting line is a two-candlestick bearish continuation pattern that usually appears during a downtrend.
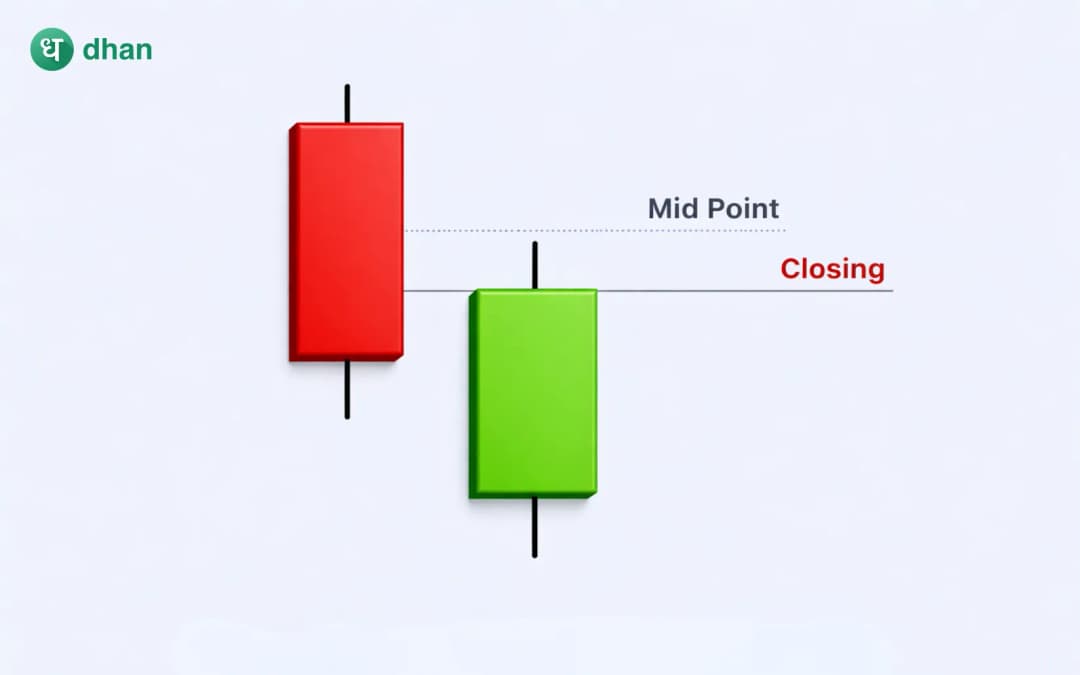
- The pattern forms when a second candle opens below the previous bearish candle's close but fails to close above its midpoint.
- The pattern shows that buyers attempted to recover, but sellers still retained control. However, it should be confirmed with price action, volume, support levels or other technical tools before taking a trade.
Candlestick patterns can help traders understand the balance between buyers and sellers during a particular period. They may signal a possible reversal or trend continuation. One such continuation pattern is the thrusting line candlestick pattern.
The pattern appears after a decline and consists of two candles. The first is a relatively long bearish candle, followed by a bullish candle that opens below the first candle's close and moves upward into its real body. Despite this recovery, the second candle does not close beyond the centre point of the first candle.
At first glance, this may look similar to a bullish reversal pattern. That is where many beginners can get confused. The key difference is how far the second candle manages to recover. Understanding this detail is important when distinguishing a thrusting line from a piercing line pattern and interpreting what the candles are actually saying about market sentiment.
What is a Thrusting Line Candlestick Pattern?
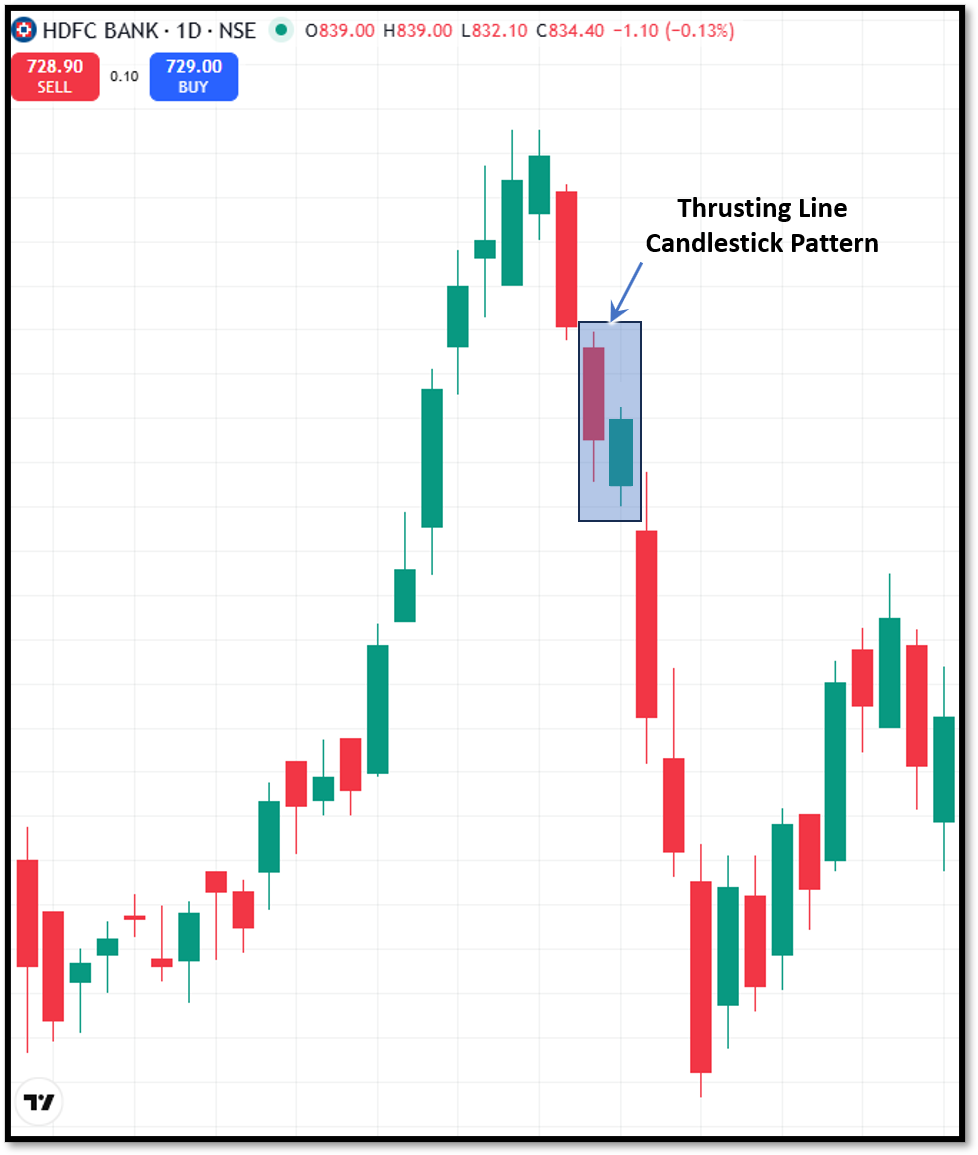
A thrusting line is a two-candle pattern that generally develops within an existing downtrend. It indicates that buyers attempted to push prices higher after strong selling pressure, but their recovery was not strong enough to take control of the session.
The first candle is bearish and typically has a relatively large real body. It reflects strong selling pressure during the period.
The second candle is bullish. It opens below the previous candle's close and then moves higher, entering the body of the first candle. However, it closes below the centre point of the first candle's real body.
This closing position is one of the most important characteristics of the pattern. Buyers have made progress, but they have not recovered enough of the previous decline to suggest a clear change in control.
How does the Pattern form?
The formation can be understood as a short battle between sellers and buyers.
- A strong bearish candle appears: Sellers dominate the first session and push the price significantly lower.
- The next session opens lower: The second candle begins below the previous candle's closing price, showing that bearish sentiment remains present at the open.
- Buyers attempt a recovery: Buyers step in and push the price higher during the session, producing a bullish candle.
- The recovery remains incomplete: Although the second candle moves into the first candle's body, it fails to close above the midpoint.
- Sellers retain the advantage: The incomplete recovery suggests that buyers have not yet overcome the earlier selling pressure.
Thrusting line vs piercing line
The thrusting line is often confused with the piercing line pattern because both consist of a bearish candle followed by a bullish candle that moves into the previous candle's body.
The main distinction is the depth of the second candle's recovery.
In a thrusting line, the bullish candle closes below the midpoint of the previous bearish candle's body. In a piercing line, the bullish candle closes above the midpoint of the previous bearish candle's body, while still closing below the previous candle's open.
This difference matters because the piercing line is a stronger rebound by buyers and is often seen as a possible bullish reversal pattern. The thrust line indicates that the current downtrend may continue.
What does the Thrusting Line indicate?
The pattern mainly reflects an unsuccessful attempt by buyers to reverse short-term selling pressure.
Consider a stock that has been declining for several sessions. It produces a large bearish candle and closes at ₹500. On the following session, it opens below ₹500, but buyers step in and push the price higher. If the first candle opened at ₹530, its midpoint would be ₹515. If the second candle closes at ₹510, buyers have recovered part of the decline but have not moved above the midpoint.
This tells traders that demand appeared, but it was not strong enough to completely offset the previous selling pressure.
How to trade the Thrusting Line Pattern?
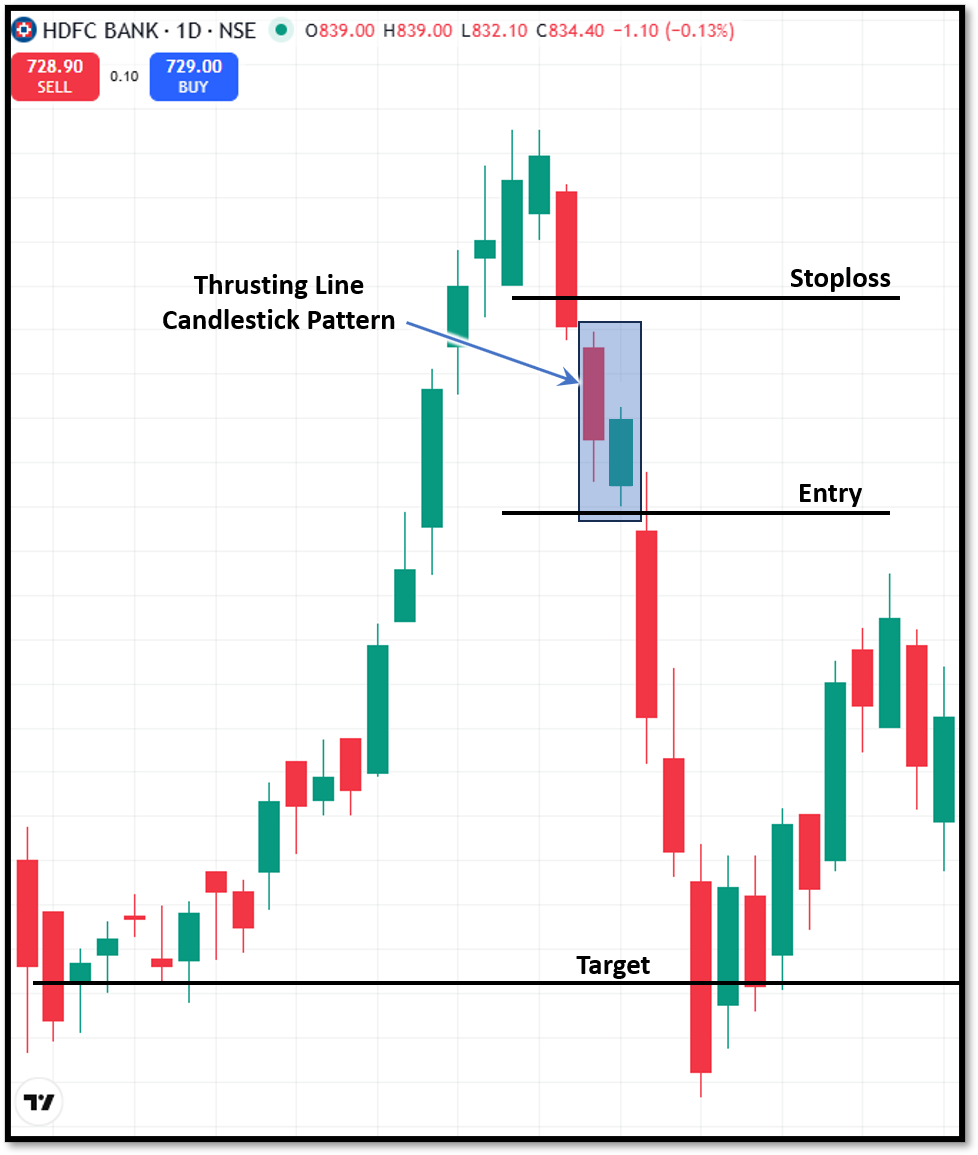
The pattern should generally be treated as a setup rather than an automatic sell signal. Traders can wait for additional confirmation before entering a position.
If the next candle breaks below the low of the bullish second candle and selling continues, it may provide confirmation of bearish momentum.
A trader could then define a stop-loss based on the structure of the setup. For example, the high of the second candle or another nearby technical level may be considered, depending on the trading plan.
Traders can set the target based on a predefined risk-reward ratio or nearby support level rather than an arbitrary percentage. A trader should determine the potential loss before entering the position.
Advantages of the Thrusting Line Pattern
The thrusting line candlestick pattern offers the following advantages:
- The second candle shows buyers trying to recover from a decline, while its failure to cross the first candle's midpoint highlights the limits of that recovery.
- The pattern structure is usually considered simple to identify. Traders mainly need to examine two candles, their opening and closing levels.
- When the pattern appears during an established downtrend, the pattern can help traders recognise that a short-term bounce may not have changed the broader bearish structure.
Disadvantages of the Thrusting Line Pattern
Along with advantages, the thrusting line pattern has some disadvantages as well:
- The thrusting line pattern does not guarantee continuation. It only signals that the buyers do not have the conviction to reverse the trend.
- When the market is moving sideways, the pattern may lack the downtrend context needed to make its signal meaningful.
- The pattern closely resembles the piercing line pattern, which indicates a completely different price move. Beginners usually confuse the two.
- During sharp price movements, relying only on two candles can expose traders to false signals, particularly around major news or market events.
To wrap up
The thrusting line candlestick pattern represents that the buyers try to interrupt an existing decline but fail to recover more than half of the previous bearish candle's body. This incomplete recovery signals that the bullish candle might be a pullback and the bearish trend may continue.
While trading, traders must focus on the context and confirmation. If you want to see the pattern in a clean downtrend, be careful of the closing position of the second candle, compare it with nearby support and resistance, and wait for the ensuing price action before you decide to trade.
FAQs
Is the thrusting line a bullish or bearish pattern?
The thrusting line pattern usually indicates the continuation of the downward movement. Hence, it is considered a bearish pattern.
What is the difference between a thrusting line and a piercing line?
The main difference is the closing level of the second candle. In a thrusting line, the second candle closes below the midpoint of the first bearish candle's body. In a piercing line, the second candle closes above that midpoint, making the latter a potential bullish reversal pattern.
Should traders enter immediately after a thrusting line forms?
No. It is recommended to wait for a confirmation before entering the trade, such as a break below the second candle's low.
Where is a thrusting line most useful?
The pattern is generally more relevant when it appears during a clear downtrend after meaningful selling pressure.
Is the thrusting line suitable for beginners?
It can be useful for beginners because its two-candle structure is relatively straightforward to study.







