UT Bot Indicator








Key takeaways
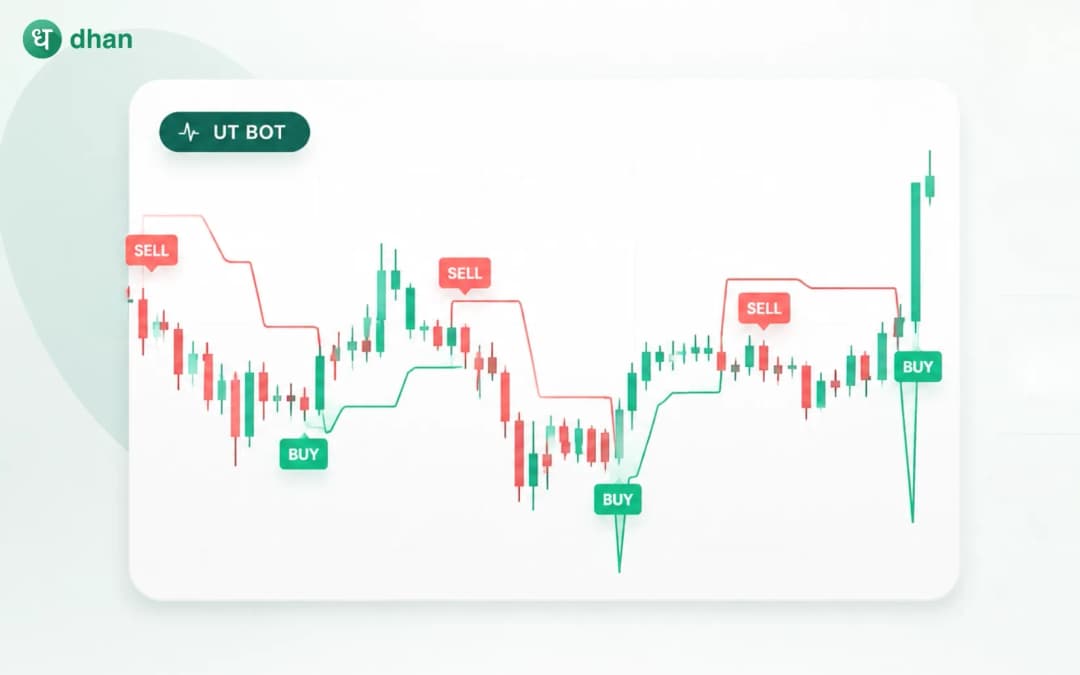
- The UT Bot indicator is a trend-based technical indicator that enables traders to identify possible opportunities to buy and sell.
- Based on market price movements and volatility levels, this indicator generates signals and uses the Average True Range to calculate its values.
- The UT Bot signal is often shown as buy and sell alerts, making it easy to interpret the indicator.
- The Key Value and ATR Period are significant parameters that determine the indicator's ability to sense market movements based on prices.
- UT Bot is effective during trending market conditions, but it may give false signals during sideways or choppy market conditions.
- It is recommended to not rely on UT Bot signals alone when making trading decisions. Use price action, trend analysis, support and resistance levels or other confirmation tools to verify UT Bot signals.
On a price chart, the most interesting thing is not where the trend is obvious, but where that trend begins to shift. A decreasing price level stabilises. Buyers enter the market. Momentum changes direction. What initially looked like a downtrend starts to show signs of change.
The UT Bot Indicator is one of the trend-following indicators that aims to spot this shift early. Based on price movements and volatility, this indicator seeks to identify conditions indicating changes in the existing trends and highlights possible trading opportunities on the charts.
Therefore, understanding how the UT Bot generates trading signals, the impact of its settings on sensitivity, and where it creates false signals is important before starting to use it as part of a trading strategy.
What is the UT Bot indicator?
The UT Bot indicator is a trend-following technical analysis tool for identifying possible changes in market direction. Based on price movements and volatility, it generates buy and sell signals that can be easily identified on a trading chart.
This indicator is often used to track market trends and find possible opportunities to enter or exit the market.
How does the UT Bot indicator work?
UT Bot indicator uses both price movements and market volatility to identify possible changes in trend direction. The average true range plays a significant role in calculating this indicator and determines how much an asset moves during a particular time frame.
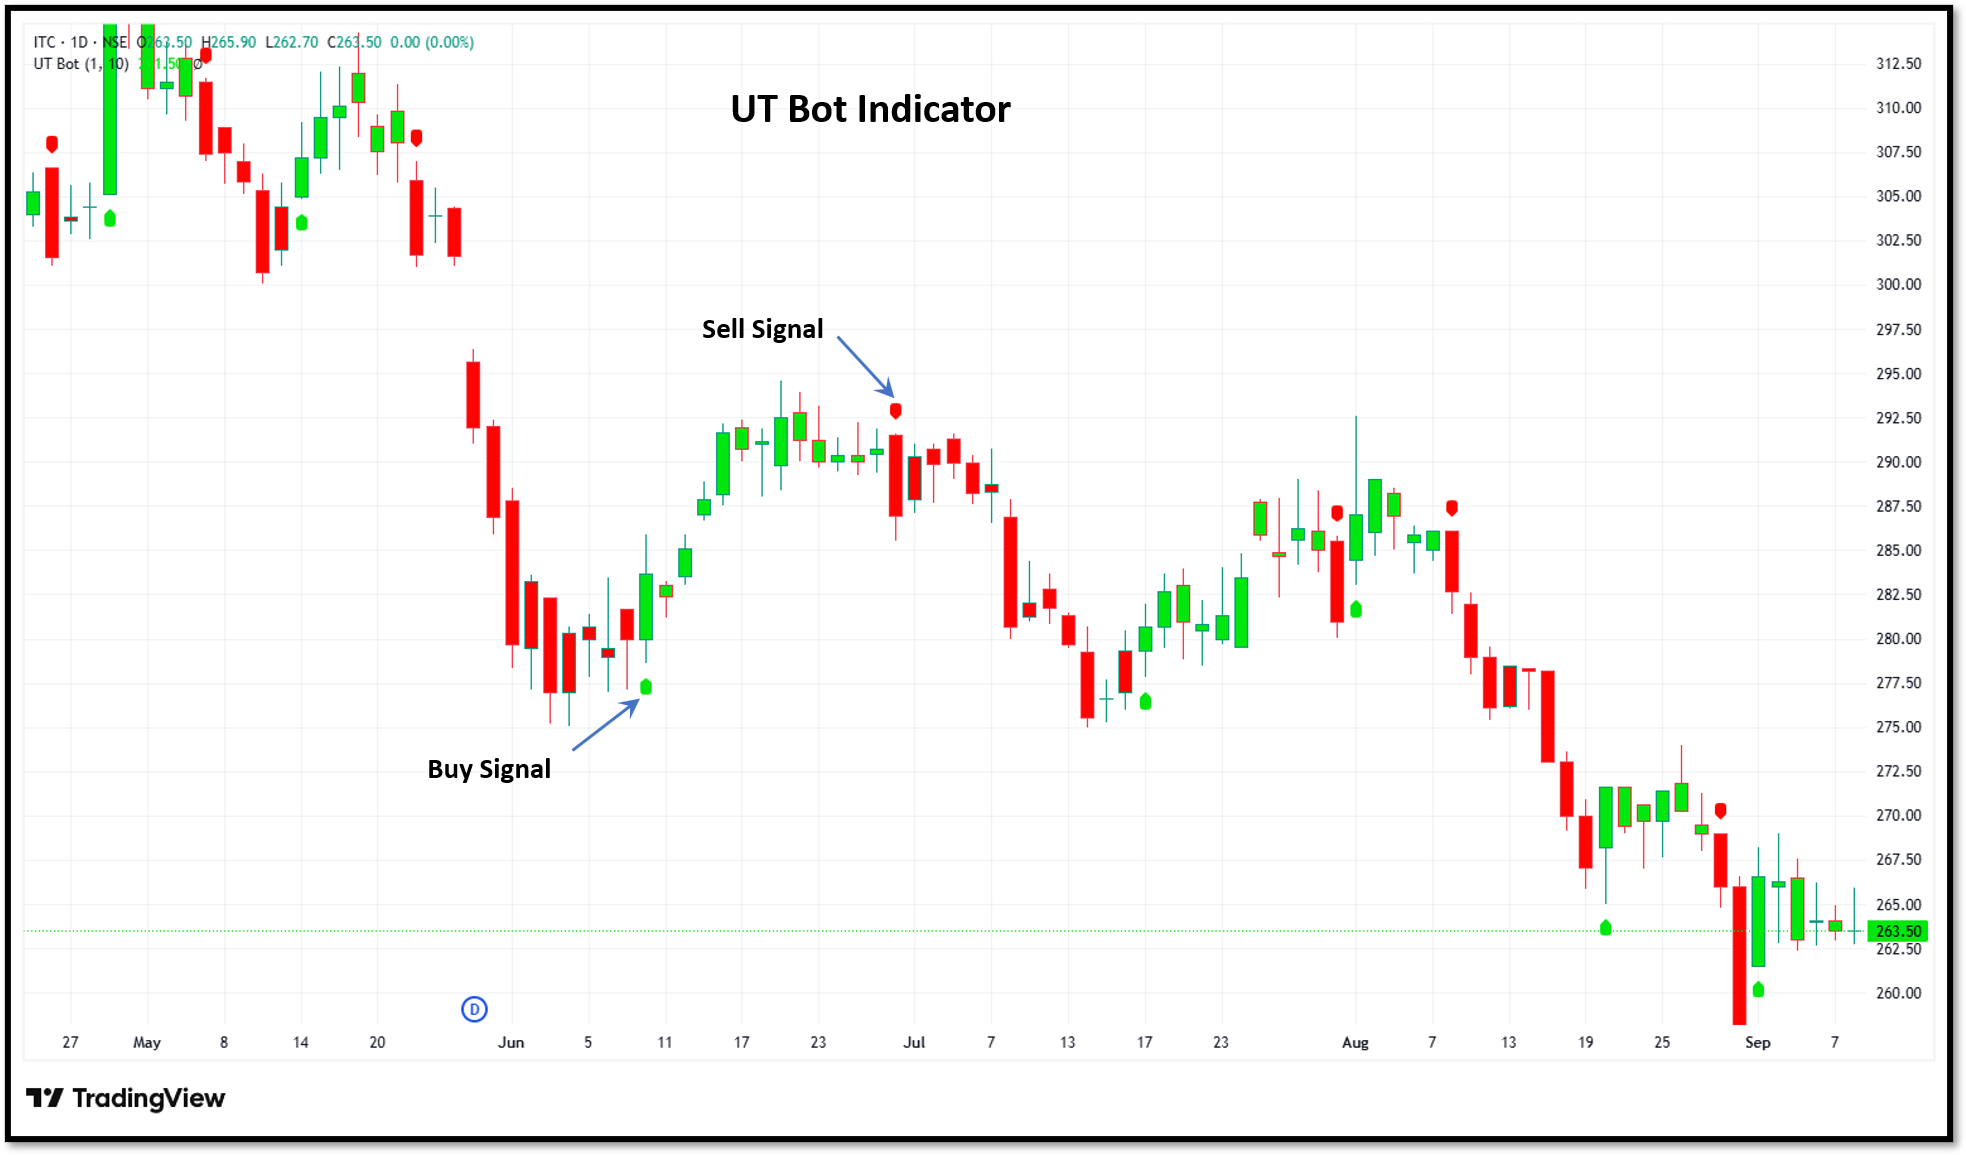
If prices remain above or below this level, the indicator will follow the current market trend. However, if the price breaks through the moving average, UT Bot will generate a buying or selling signal.
Its sensitivity is determined by parameters such as the ATR period and key value. If the settings are highly sensitive, quick signals may be generated, whereas less-sensitive settings may cause the indicator to ignore small changes in prices.
Therefore, it is recommended that UT Bot be used as a trend-following tool, not as an independent predictor of future prices.
Key UT Bot indicator settings
UT Bot’s behaviour is greatly influenced by its settings, which determine its sensitivity level to price and volatility changes. The Key Value and ATR period are the primary settings that need to be understood before using the indicator.
Key value
The key value shows how responsive UT Bot is to price movements. A lower value enables UT Bot to respond quickly to market movements, resulting in generating more signals, while higher values help eliminate minor market movements and produce fewer, slower signals.
ATR period
The ATR period is used to measure recent price volatility. A shorter period will make the indicator more responsive, while a longer period leads to smoother signals. The optimal setting depends on the asset, time frame and trading strategy.
How to read UT Bot on a chart
In order to understand the UT Bot properly, you need to know what its buy and sell signals mean on the chart.
Buy signal
A buy signal indicates that the indicator has identified the possibility of an upward price trend. It can be more effective if the price already shows strength or breaks above the significant resistance level.
Sell signal
A sell signal indicates there could be a possibility of a downtrend in prices. Traders can rely on this to confirm whether they should hold long positions and consider creating short positions based on their trading strategy and current market situation.
Follow the trend
UT Bot is most effective when there is a clear direction in the market trend. During strong trends, its signals allow traders to identify possible continuation or reversal points. However, during sideways markets, the frequent changes in signals may cause whipsaws.
How to use the UT Bot indicator in a trading strategy
Instead of solely depending on the UT Bot signals, traders can follow a step-by-step approach to monitor market conditions and create a well-researched trading strategy.
Identify the market trend
First, determine if the asset is trending upwards, downwards or moving sideways. This information provides context for understanding the UT Bot signal, and allows traders to avoid opening positions that go against the market trend.
Wait for a signal
After identifying the trend, look for a UT Bot signal as per your trading strategy. Do not enter a trade just because the signal has appeared; consider the surrounding price action.
Look for confirmation
Before entering any trade, traders should seek confirmation from price action, support and resistance levels, moving averages, or trading volumes. These indicators help to identify strong signals while eliminating weak ones, without making the strategy unnecessarily complicated.
Set risk levels
Properly identify the entry point, stop loss and target levels. The position size will depend on the level of risk involved, since no indicator can guarantee complete elimination of losses incurred due to unsuccessful trades.
Monitor the trade
Once you take a position, monitor the price action and the UT Bot signal. If market conditions change, reconsider the trade based on the original strategy and risk management rules instead of taking any decision solely based on temporary changes in the price trend.
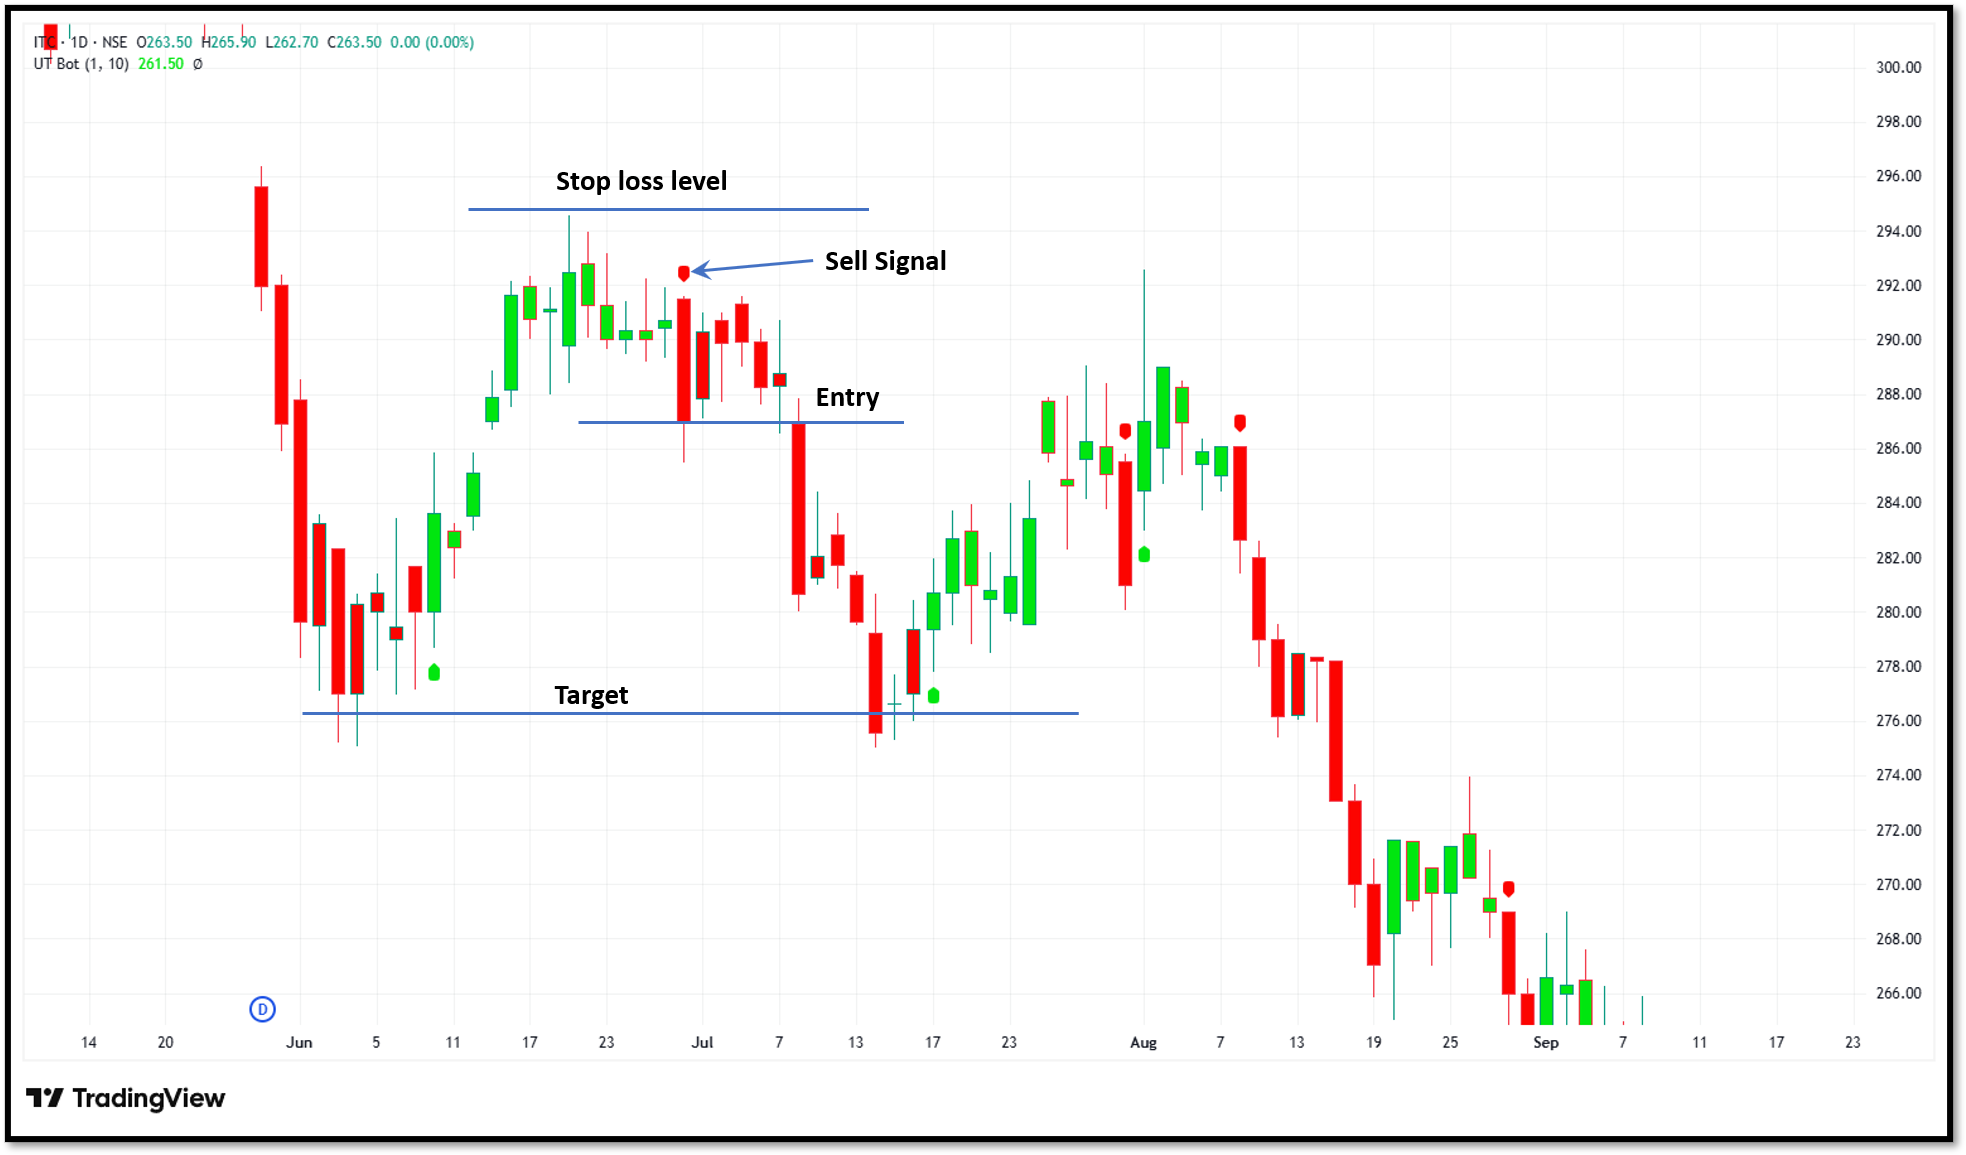
Advantages of the UT Bot indicator
Some advantages of the UT Bot indicator are:
- Simple signals: Easy-to-spot buy and sell signals make it easy to quickly identify price direction at a glance.
- Track trends: This tool enables traders to follow emerging trends rather than reacting to every small price movement.
- Accounts for volatility: The indicator’s ATR-based strategy enables it to adapt to changes in market volatility.
- Adaptive usage: UT Bot can be used across different assets and timeframes based on a trader's personal strategy.
- Ideal for exits: The trailing feature helps identify periods when a trend is weakening or changing direction.
- Clean chart setup: You can track trends without cluttering your charts with multiple technical indicators.
Limitations of the UT Bot indicator
Some limitations of the UT Bot indicator are:
- False signals: During sideways or turbulent market conditions, UT Bot can change direction multiple times, which in turn generates false signals.
- Possible signal lag: As this indicator is based on price movements, it may generate a buy/sell signal after the trend has already established.
- Sensitivity adjustment: Different key values and ATR periods can result in significant differences across markets and timeframes.
- Limited market context: UT Bot concentrates solely on volatility and price while ignoring key fundamental data and news updates.
- Not a complete strategy: Just relying solely on the UT Bot signal is not sufficient for any trader. It does not indicate risk per trade, when to exit trades, or whether the risk-reward ratio is balanced.
Common mistakes traders make with UT Bot
Avoiding these common mistakes can improve the reliability of your trades.
- Following every signal: Constantly acting on all buy or sell signals can result in repeated losses if there is no clear trend in the market.
- Ignoring market structure: Signals become difficult to interpret if traders ignore factors such as key supports and resistance levels, breakouts or past price actions.
- Using inappropriate settings: Using settings of another trader without first testing them may generate signals that are not suitable for your asset or time frame.
- Chasing late entries: Jumping into a market because UT Bot has produced a signal leaves little room for profitable trades.
- Ignoring risk management: Even strong signals can fail; therefore, proper risk management and stop loss strategies need to be followed before entering any trade.
- Over-optimising the indicator: Continuously adjusting parameters to boost past performance can make a strategy appear better on paper than it performs in the live market.
How to improve UT Bot signals
The UT Bot performs best when its signals are confirmed by the overall market trend along with other significant technical indicators.
- Trade on higher time frames: Understanding the broader trend helps to eliminate misleading signals that run against the main market trend.
- Identify support and resistance: A signal close to a key price level provides more information than one that appears in the middle of a trading range.
- Keep an eye on trading volumes: Higher trading volumes during a breakout or significant change in market trend enhance the reliability of the UT Bot signal.
- Manage sideways markets: Avoid relying heavily on UT Bot during periods of sideways movement with repeated direction changes.
- Test before trading: Backtesting and demo trading can help you understand how the indicator works before committing to actual trading.
To wrap up
The UT Bot Indicator helps to simplify trend analysis by identifying potential changes in market direction. Its true value comes from the way traders interpret its signals, rather than blindly following them.
Instead of considering each alert as an opportunity to trade, use the UT Bot indicator along with market structure, price action and a proper risk management strategy. With all necessary details and appropriate expectations, this indicator can serve as a reliable tool to enable a systematic approach to deciding upon your trades.
FAQs
Can UT Bot be used for stocks?
Yes. UT Bot can be applied in different markets, including stocks, commodities, etc. Its performance varies based on volatility and market conditions.
What is the best setting for UT Bot?
There is no universally best setting. The appropriate key value and ATR period depend on the asset, time frame, and trading strategy. Therefore, it is necessary to test them rather than making guesses.
Does UT Bot repaint its signals?
The answer depends on which version you are using. Traders need to understand how their UT Bot strategy generates and displays signals before relying on historical chart results.
Can UT Bot be used for scalping?
Yes, it may work with lower time frames for short-term trading. However, these timeframes have a higher level of market noise. It is essential to thoroughly backtest any trading strategy involving scalping techniques, and ensure you follow strict risk management rules.
Should I use another indicator with UT Bot?
You can, but having multiple indicators does not always lead to better trading decisions. Price action, support and resistance, volume or higher timeframe trends can provide stronger signals to confirm trading decisions than multiple overlapping indicators.