VWMA Indicator








Key takeaways
- VWMA (Volume Weighted Moving Average) uses both price and volume data to give a more complete picture of market trends.
- Traders often use VWMA to determine the trend direction, confirm breakouts, and evaluate market participation.
- VWMA works best when combined with other technical indicators such as RSI, MACD, and support-resistance analysis.
- While VWMA can help identify stronger trends, it should not be used as a standalone tool and should always be supported by proper risk management.
Price tells you what is happening, but volume tells you how much conviction is behind the move.
This is one of the reasons why experienced traders do not rely on price alone. They also look at trading volume to understand whether a market trend is strong or weak.
The Volume Weighted Moving Average (VWMA) is a technical indicator which combines price and volume into a single line on a chart. This can be particularly useful for traders in India, analysing actively traded stocks, Nifty 50, Bank Nifty and F&O contracts. A breakout on higher volume is often more significant than a price movement on low volume.
In this guide, we will cover what a VWMA indicator is, how it is calculated, how to use the VWMA indicator on Dhan charts, common trading strategies and advantages and limitations of the VWMA indicator.
What is the VWMA Indicator?
VWMA is a trend-following technical indicator that accounts for the average trading price of a stock or index relative to the volume traded.
The primary goal of VWMA is to identify price changes which are backed by strong market activity.
For example:
- If a stock is up 3% than normal volume, VWMA gives more weight to that move.
- If the same stock is up 3% on very low volume, it is weighted less by VWMA.
It helps traders to identify strong and weak trends.
VWMA Formula
The VWMA is calculated using the following formula:
VWMA = Σ (Price × Volume) ÷ Σ Volume
Where:
- Price = Closing price for the trading period
- Volume = Volume traded during the session
- Σ = Sum of values over the selected period
For example, a 20-period VWMA uses the last 20 closing prices and trading volumes of candles or trading sessions.
Why is volume important in trading?
Volume is one of the most important market participation indicators.
Heavy volume that accompanies price movement often indicates conviction on the part of market participants.
High volume can suggest:
- Strong buying or selling interest
- More institutional participation
- Confirmed Breakouts
- Strong trend continuation signal
Low volume can mean uncertainty or lack of conviction. That’s why VWMA is preferred by many traders over traditional moving averages.
How to read the VWMA Indicator?
The VWMA can help traders get a better sense of the direction of the trend as well as the strength behind a move in price. Indicator interpretations are often as follows:
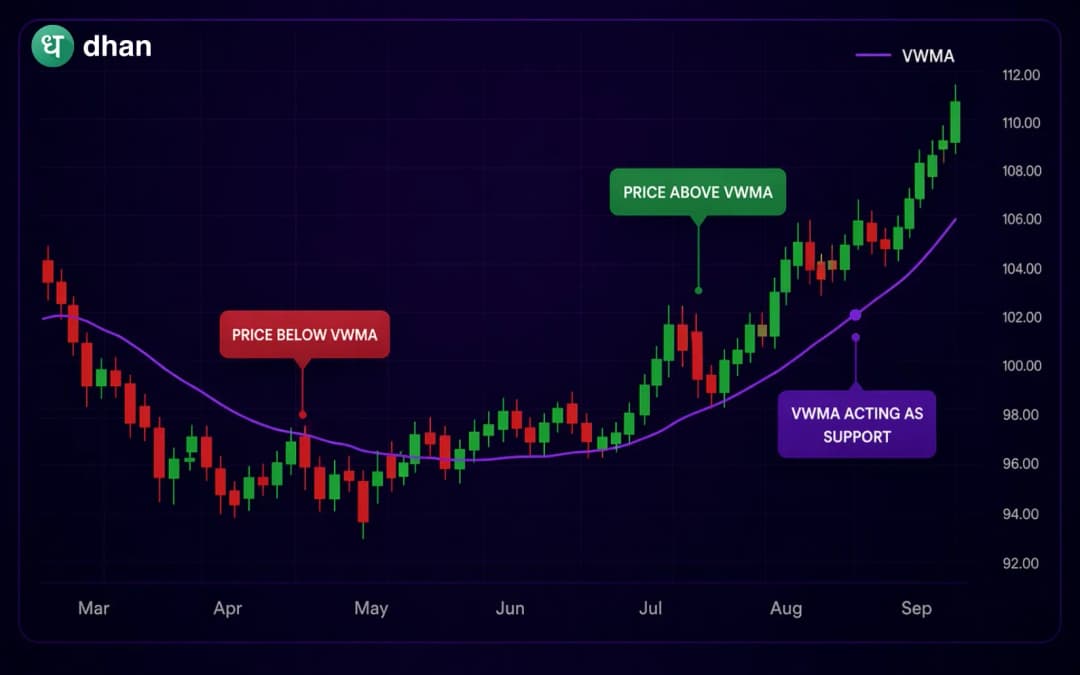
Price Above VWMA
When the price is trading above the VWMA, it is bullish. The signal is stronger if the price increase is accompanied by above-average trading volume.
Price Below VWMA
A price below the VWMA could be a sign of bearish sentiment. If there is a higher selling volume, this can further strengthen the signal, indicating more market participation on the downside.
Rising VWMA
When VWMA is rising, prices are trending higher with good volume support. This is often considered a sign of a continued uptrend.
Falling VWMA
If the VWMA is falling, it means prices are falling, and selling pressure is rising. This may be a sign of a continuing downtrend.
VWMA vs SMA: What's the difference?
Both of these indicators are used to identify trends; VWMA considers the volume in the calculations, while SMA only considers the price.
SMA is still popular, but VWMA adds a little bit more context by factoring in volume into its calculation.
How to use the VWMA indicator on Dhan
Traders can easily add and personalise technical indicators with just a few clicks on Dhan’s sophisticated charting platform. No matter if you trade stocks, ETFs, futures, options or indices, VWMA can be directly added to your chart for trend and volume analysis.
To add the VWMA indicator on Dhan:
- Select the stock, index, ETF or F&O contract that you want to analyse.
- You can open the chart view and switch to whatever time frame you want. 5 min, 15 min, hourly or daily.
- Click on the Indicators option available on the chart toolbar.
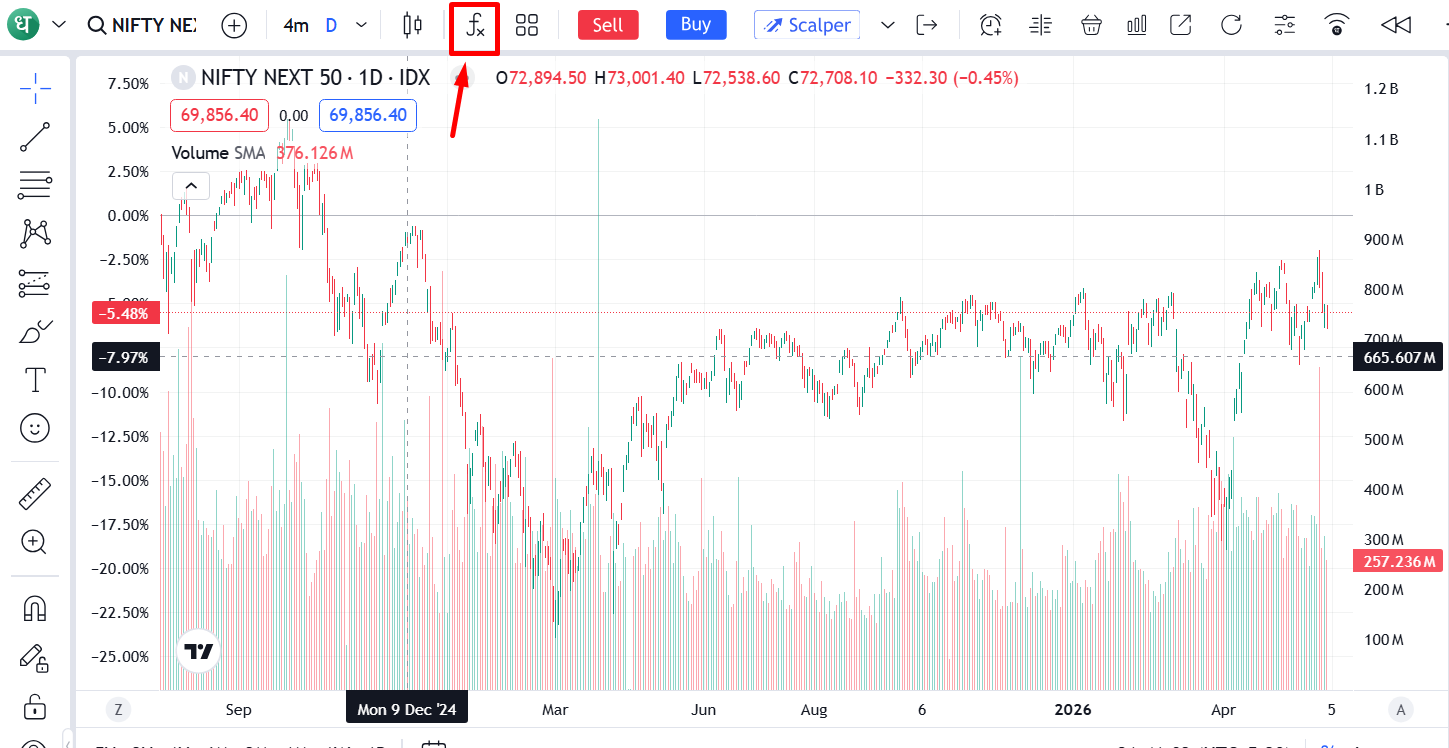
- Type VWMA (Volume Weighted Moving Average) in the search bar and select it from the list of indicators.
- Choose the VWMA period based on your trading style. Many traders prefer a 20-period VWMA for short-term analysis, while swing traders often use a 50-period VWMA.
- Apply the indicator and observe how the VWMA line reacts to price movements supported by higher trading volumes.
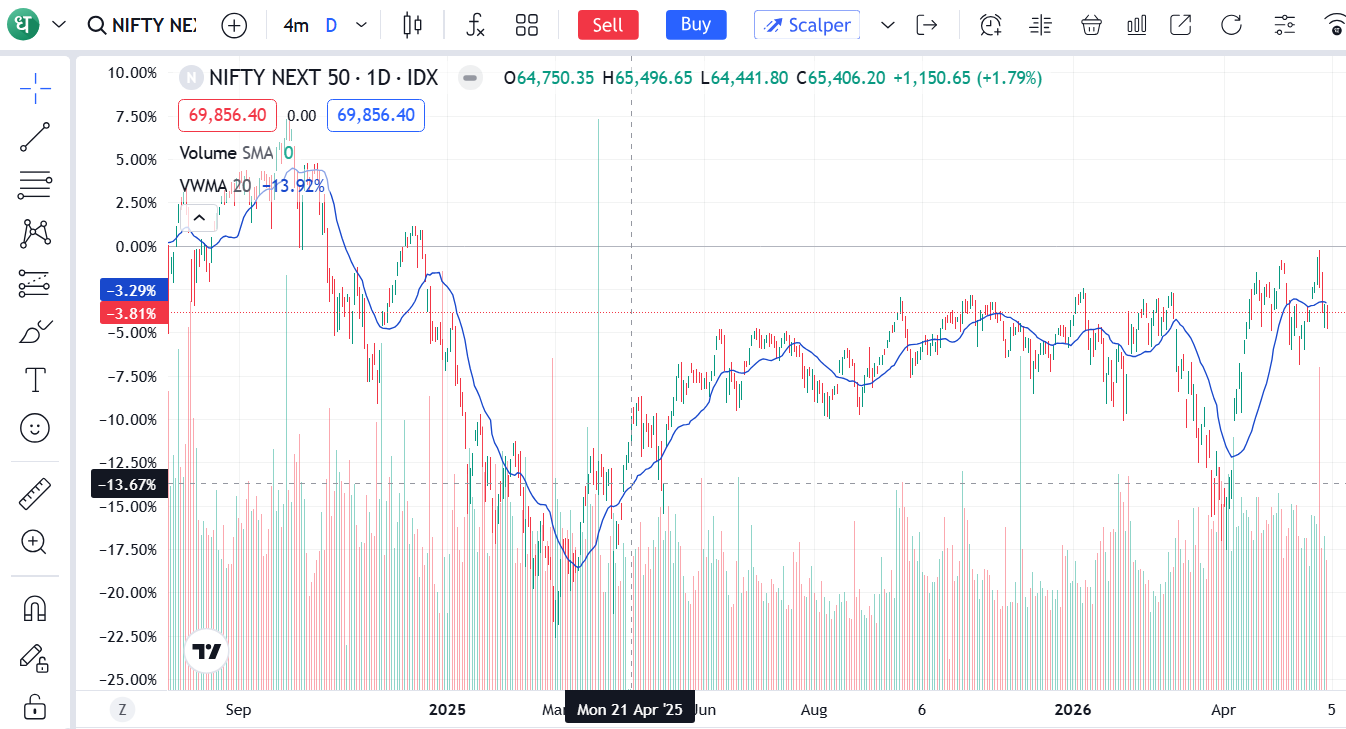
As you can see in the screenshot above, you can add and customise VWMA indicators on Dhan charts for technical analysis.
Best VWMA Settings for Indian traders
The best VWMA setting depends on your trading horizon and strategy. There is no single setting that works in all market conditions, but traders commonly use the following periods:
- Intraday Trading: Traders commonly use 9 VWMA and 20 VWMA to capture short-term price movements and identify quick trading opportunities.
- Swing Trading: 20 VWMA and 50 VWMA are popular choices for tracking medium-term trends and potential trend reversals.
- Positional Trading: Investors often rely on 100 VWMA and 200 VWMA to analyse long-term market direction and identify major support and resistance levels.
You can use these settings as a base. Traders can backtest different periods of VWMA and adjust it according to their trading strategy, risk appetite, and market conditions.
VWMA Trading Strategies
The VWMA indicator can be used in many ways to find trends, confirm breakouts and identify potential trading opportunities.
Trend Following Strategy
Traders use VWMA to determine the direction of the trend. If the price is trading above a rising VWMA, then it might be a sign of bullish momentum. A price trading below a falling VWMA can be a sign of bearish momentum.
VWMA Breakout Strategy
An up or down breakout is generally more reliable on high volume. A break of a key resistance level on increased volume when the stock is trading above the VWMA may show strong buying interest and a potential for trend continuation.
VWMA Crossover Strategy
The strategy is based on two VWMA lines, e.g. 10-period and 50-period VWMA. When the shorter VWMA crosses above the longer VWMA, it is seen as a bullish signal, and when it crosses below, it is seen as a bearish signal.
Whatever the strategy, the traders should use the right risk management and should not depend upon one indicator only.
Advantages of VWMA
- Combines both price and volume data, providing a more comprehensive view of market activity.
- Helps traders confirm the strength of an ongoing trend through volume participation.
- Useful for validating breakouts and reducing the chances of acting on weak price movements.
- Suitable for analysing stocks, indices, ETFs, futures, and options.
- Works well alongside indicators such as RSI, MACD, and support-resistance analysis.
Limitations of VWMA
- VWMA is a lagging indicator because it is based on historical price and volume data.
- May generate false signals during highly volatile market conditions.
- Can produce whipsaws and unreliable signals in sideways or range-bound markets.
- Performance depends on the selected time period and prevailing market conditions.
- Should not be used as a standalone trading tool for making investment decisions.
To Conclude
The VWMA indicator is a useful technical analysis tool for traders who want to combine price action with volume analysis. It also places more emphasis on high-volume sessions, helping to spot stronger trends and more reliable breakout opportunities.
Whether you trade stocks, indices or derivatives on Dhan, VWMA can be a useful addition to your charting arsenal. But like any indicator, it works best when used in conjunction with good risk management and a well-thought-out trading plan.
FAQs
What does VWMA stand for?
VWMA means volume-weighted moving average. It considers both price and trading volume.
Is VWMA better than SMA?
VWMA also takes volume data into account, which may give a better confirmation of the trend than SMA. However, both indicators have their merits.
Which VWMA setting is best for intraday trading?
Many intraday traders will use either 9-period or 20-period VWMA settings, depending on their trading style.
Can VWMA be used for Nifty and Bank Nifty trading?
Yes. VWMA can be used for Nifty 50, Bank Nifty, stocks, commodities and derivatives.
Should VWMA be used alone?
No. Usually, traders combine the VWMA with other indicators such as RSI, MACD, support and resistance levels and price action analysis.