



What is Stochastic Oscillator Indicator?






Traders use various tools and indicators to make sense out of market ups and downs. The Stochastic Oscillator is one of them. It was created by George Lane in the late 1950s and has endured, assisting traders in recognising overbought or oversold situations as well as trend reversals. In this blog, we will cover the stochastic oscillator indicator in detail.
What is the Stochastic Oscillator Indicator?
The Stochastic Oscillator measures momentum by comparing a security’s latest closing price with the range it has traded within over a defined time period. In simple words, in a rising market, the price tends to close near the top of recent highs. And in a falling market, the price tends to close near the bottom of recent lows.
The Stochastic Oscillator indicator is based on speed or momentum. There is a famous rocket analogy that traders use: before a rocket turns around and heads back to earth, its momentum must slow down. The Stochastic Oscillator highlights situations where momentum no longer supports the recent price behaviour and tries to capture this slowdown in momentum.
Components of the Stochastic Oscillator
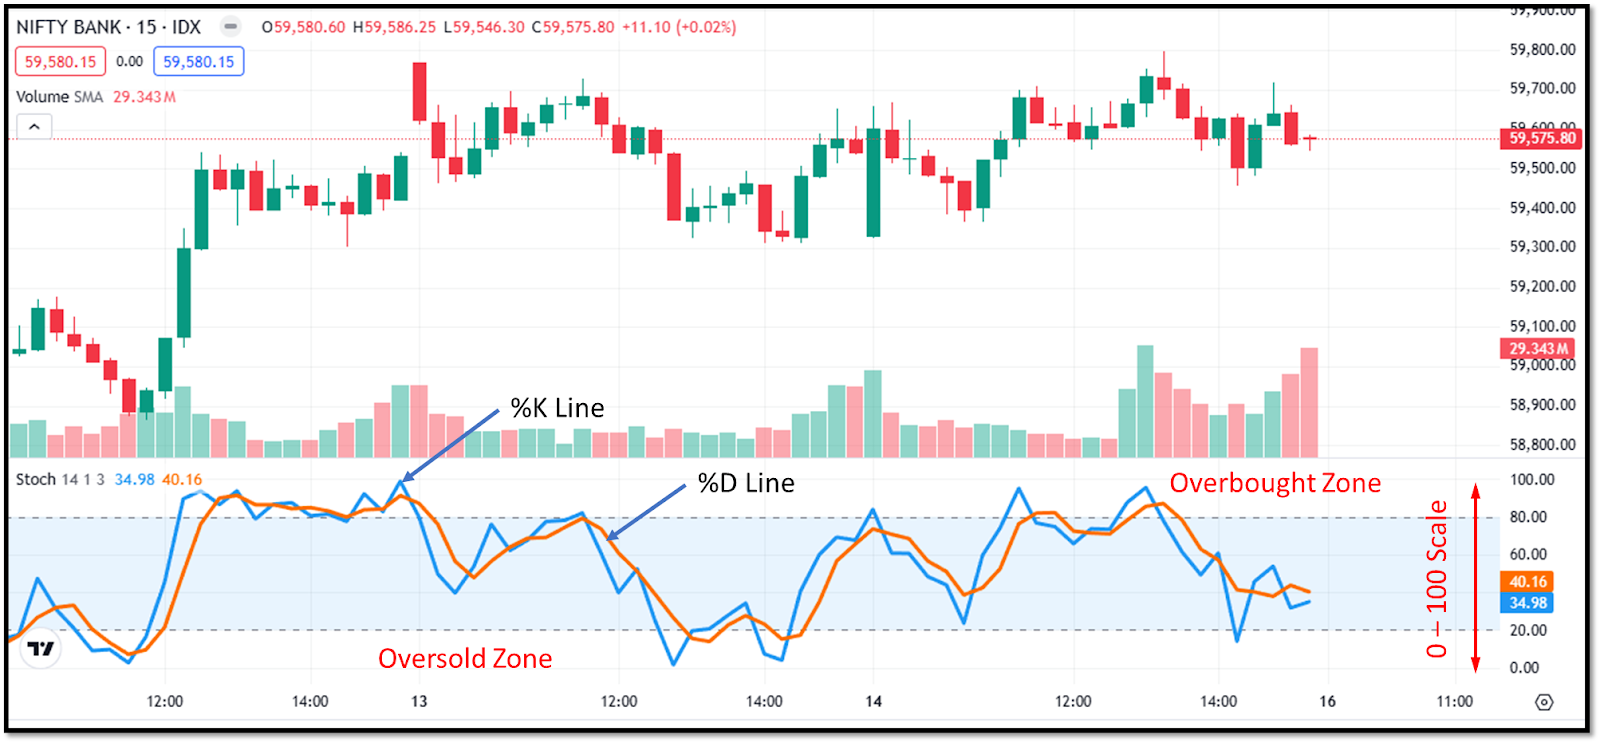
The indicator consists of two lines: %K (the fast line) and %D (the slow line). It oscillates on a scale from 0 to 100. Refer to the figure below.
%K line
The %K line is the faster line. It calculates the current price in relation to a given period's high and low. The period is set to 14 by default, but traders are free to alter it to suit their needs. The following is the formula for calculating %K:
%K = Current Close - Lowest LowHighest High - Lowest Low 100
%D line
This line is the moving average of the %K line. It is usually a 3-day simple moving average. It smooths the %k line and acts as a signal line. The crossover of the %K and %D lines is commonly considered an indication.
Overbought and Oversold Zones
The %K line and %D lines oscillate between 0 and 100 on the scale. If the lines cross over 80%, it is considered an overbought zone. Similarly, if the lines cross below 20%, it is considered an oversold zone. Prices tend to reverse or slow down in these regions. Although reversals are not guaranteed, as these levels describe only momentum.
Trading signals of the Stochastic Oscillator
To get the most out of this indicator, you need more than just "buy low, sell high." Here are three professional ways to trade it:
The Stochastic Crossover
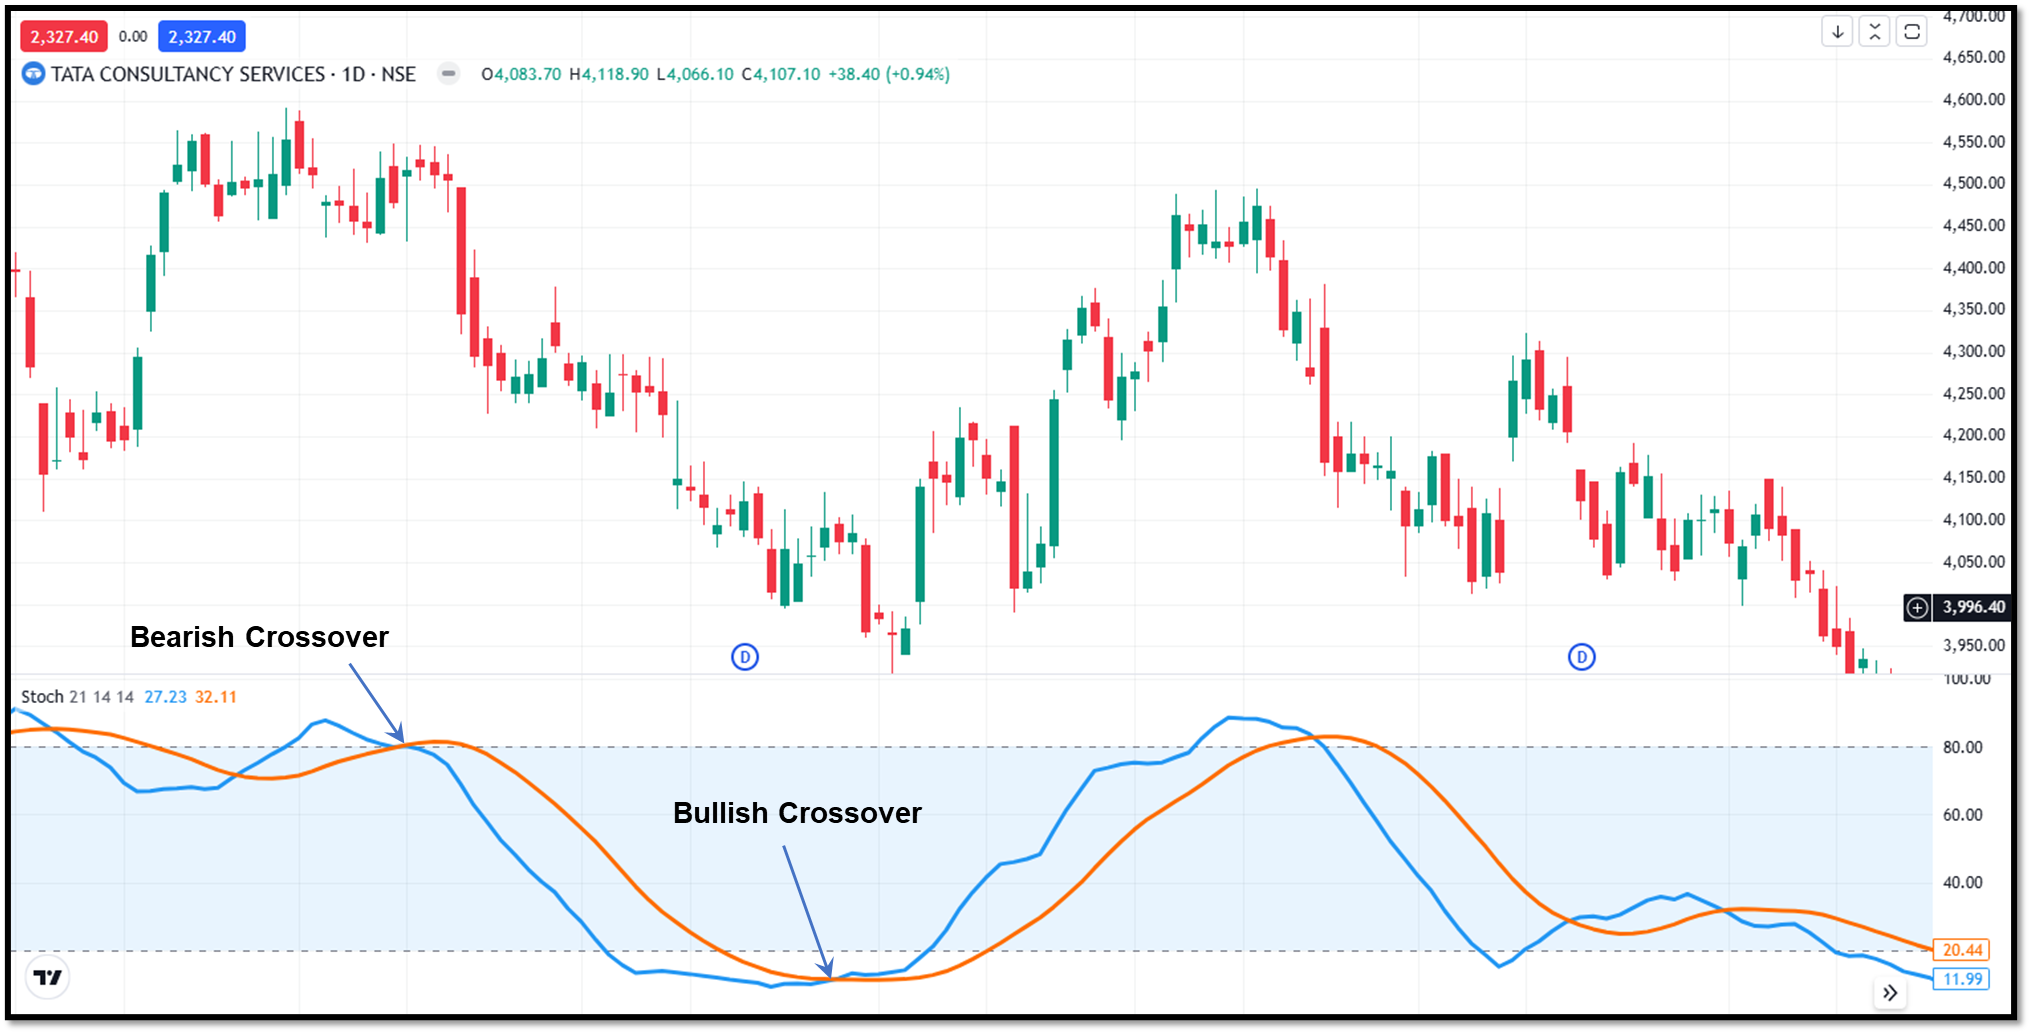
When the %K line crosses above the %D line, there are chances of a bullish market turn, especially when it happens in an oversold zone. Similarly, when the %D line crosses over the %K line, there are chances of a bearish market turn. When it happens in an overbought zone, the possibility increases.
This signal is very useful, but traders must align it with overall market conditions before concluding, as the Stochastic Oscillator tends to create false signals in certain conditions.
Overbought and Oversold Signals
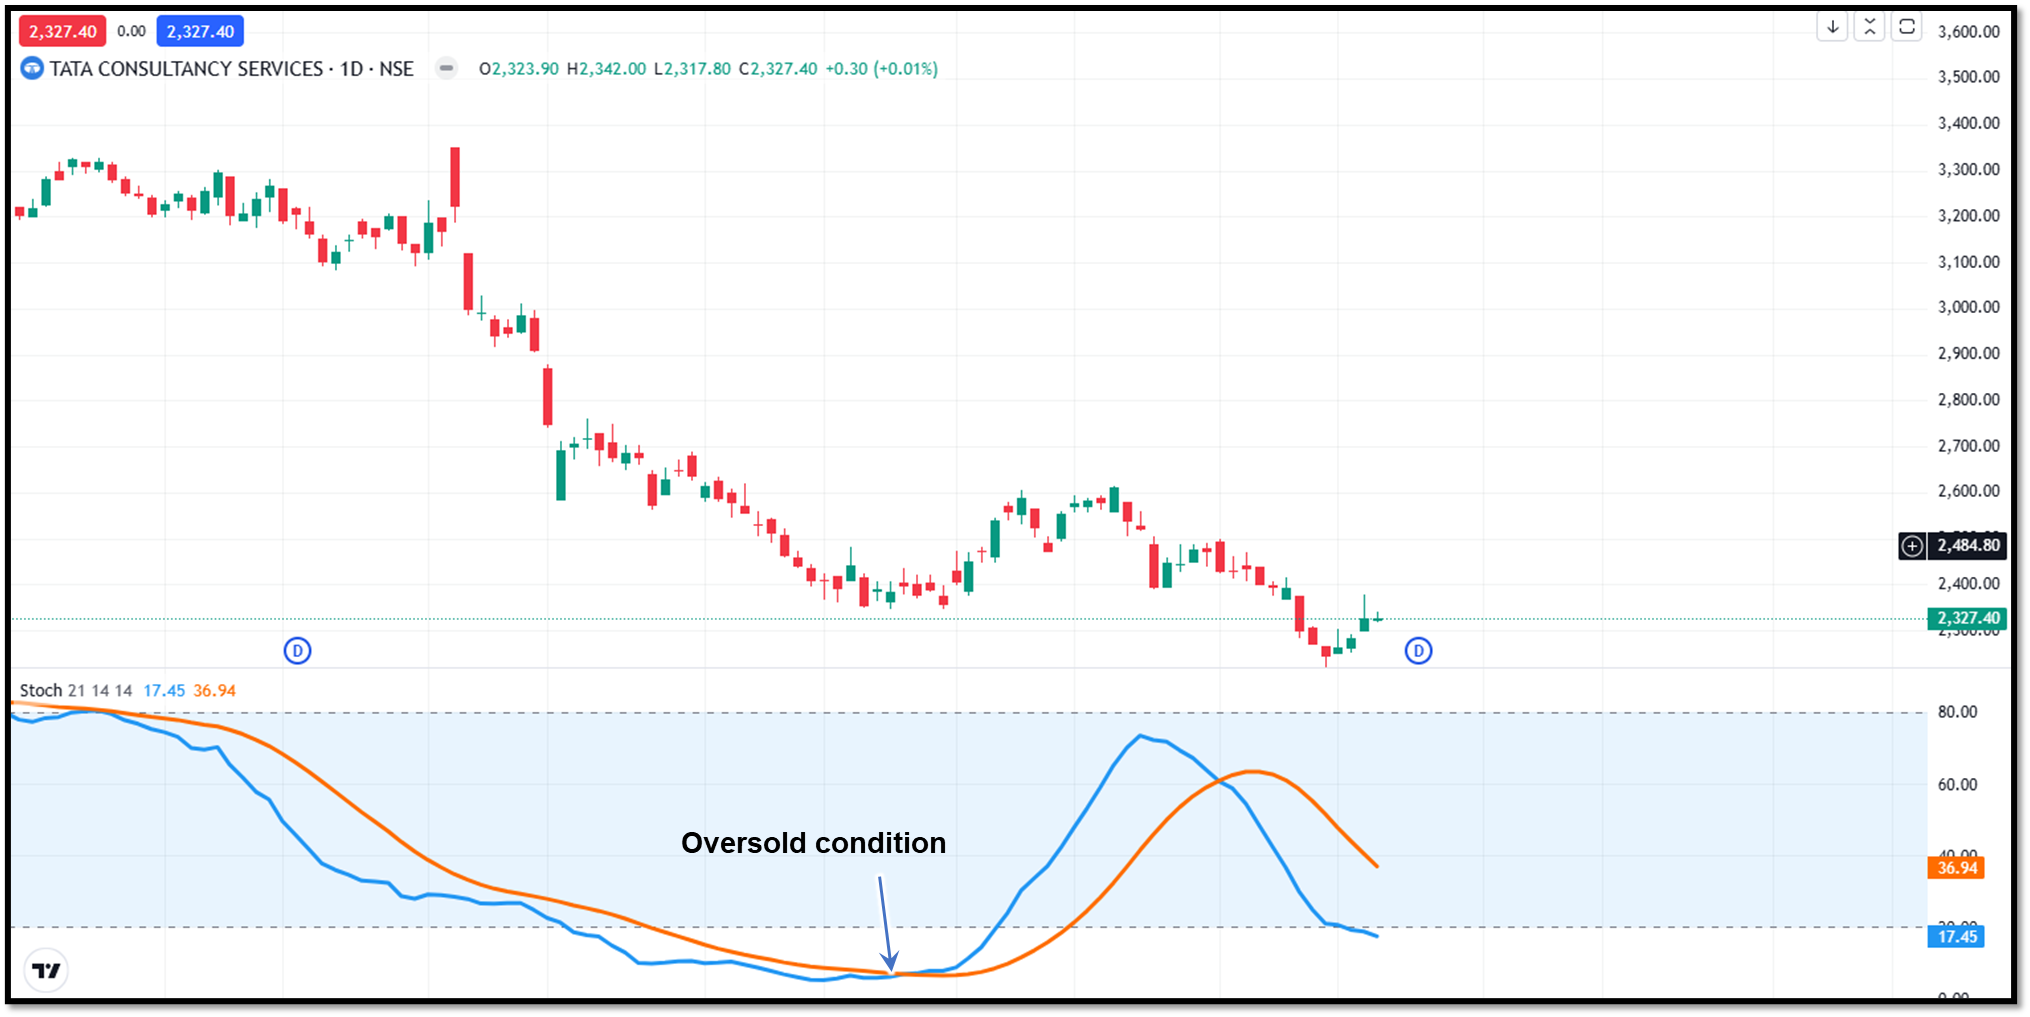
Many traders use the Stochastic Oscillator for reversals, but in practice, when the oscillator line crosses into overbought or oversold zones and stays there for some time, it represents strong momentum for that trend and not the reversal. If market conditions are favourable, traders use the 80 and 20 line as a breakout.
Divergence
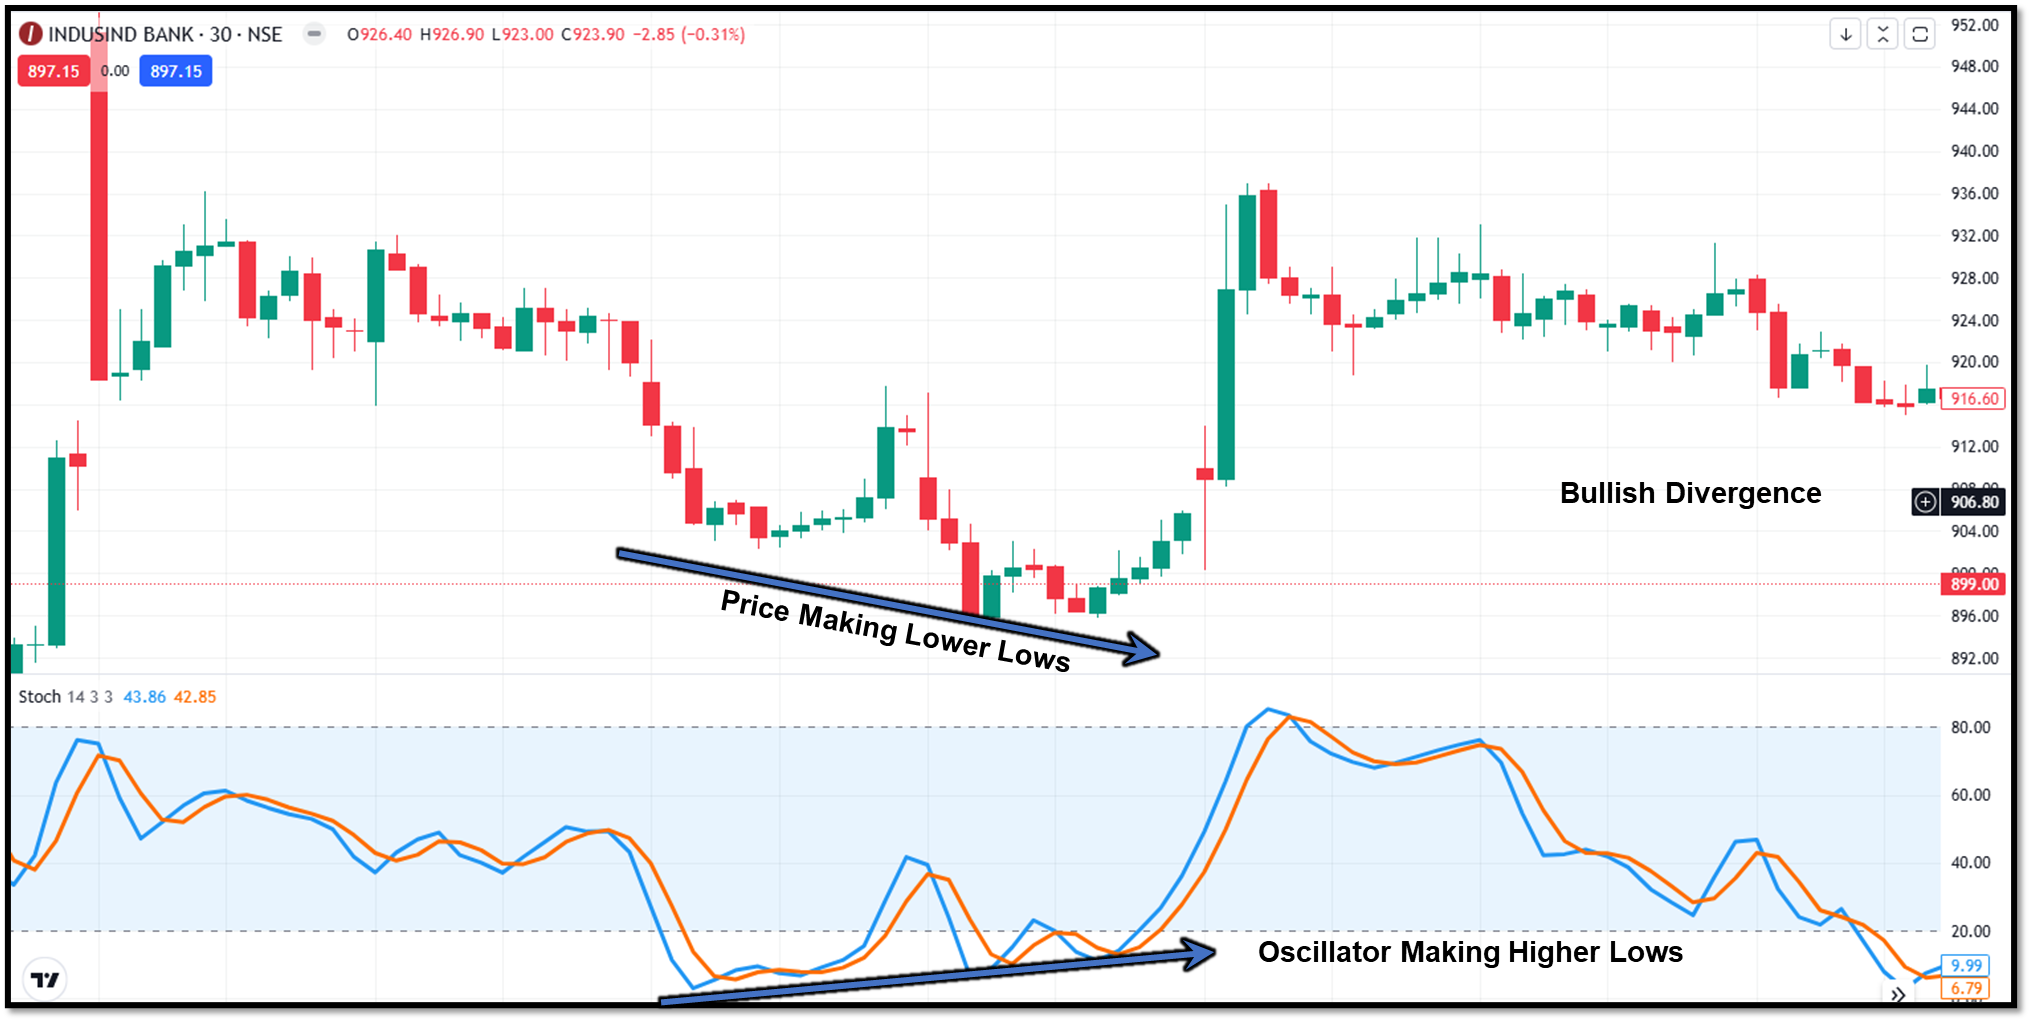
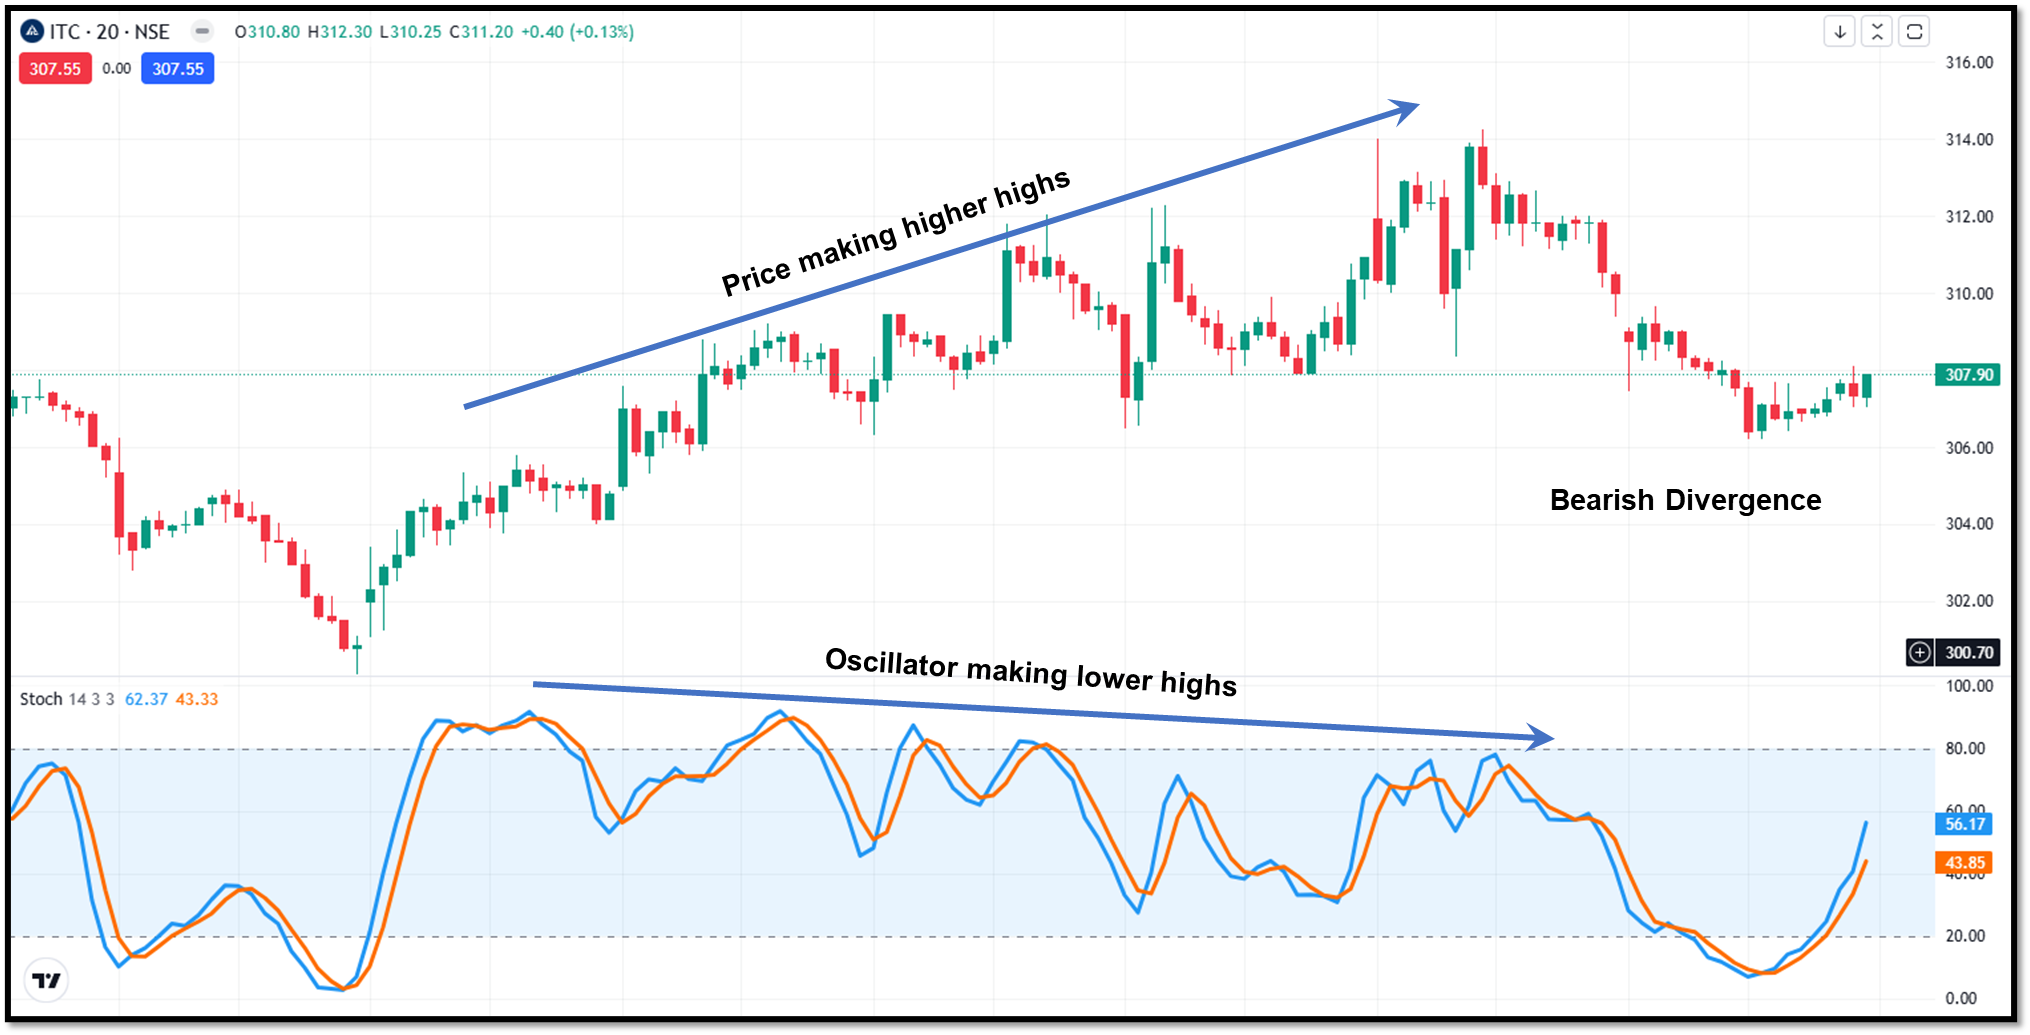
This is one of the strongest signals for which the Stochastic Oscillator is famous. Divergence occurs when price action and the oscillator are not in sync. There are two types of divergence:
- Bullish Divergence - When price makes a lower low but the oscillator lines show a higher low represents that the selling pressure is fading even when the price drops. In such conditions, there is a higher possibility of a bullish reversal.
- Bearish Divergence - In bearish divergence, price makes a higher high, but the oscillator lines show lower high, representing a decline in buyer pressure and possibility of a bearish reversal.
Best practices for trading with stochastics
Using the Stochastic Oscillator alone is quite risky. In a sideways market with very low volatility, the oscillator tends to produce false signals. Hence, traders have developed a few practical solutions to use the Stochastic oscillator.
Pairing with the trend
A common beginner's mistake is when they sell a security just because it went into the overbought zone during a strong uptrend. Traders must consider the overall market trend. Like, when there is a strong uptrend, look for the stochastic to fall into the oversold zone and then turn upward. It can be a safe buying opportunity.
Also, when there is a strong downtrend, wait for the stochastic to rise into the overbought zone and then turn downward. These are safer selling opportunities.
Use stochastic with other tools
The Stochastic Oscillator should be used as a confirmation tool rather than a standalone tool. Here are a few simple combinations:
- With RSI - If both RSI and stochastic show weakness or strength at the same time, the signal becomes more reliable.
- With Moving Averages - Moving averages help you find the trend direction. Using the Stochastic Oscillator to time better entries and exits will increase the possibility of a successful trade.
- With Support and Resistance - If the stochastic gives a buy or sell signal near an important support or resistance level, these signals become more reliable. It is known as confluence.
You may also find this related article useful - RSI vs MACD
Best setups for the Stochastic Oscillator
The commonly used settings are 14, 3, 3. It means the oscillator looks for the last 14 periods, smooths the %K line over 3 periods, and smooths the %D line over another 3 periods. This setting works well in most of the market conditions.
Traders adjust the settings for higher responsiveness on lower timeframes and slower responsiveness for higher timeframes. Faster settings increase sensitivity and noise. Slower settings reduce noise but may delay signals. Traders have to adjust the settings as per their trading style.
Common Pitfalls to Avoid
Here are some common mistakes that traders should avoid.
- Over-reliance on overbought/ oversold zones may lead to losses. During strong rallies in large-cap stocks, the stochastic can remain overbought for weeks without any meaningful pullback. Traders need to be cautious during such market conditions.
- Ignoring the timeframe is another major mistake that traders must avoid. A Stochastic signal on a 5-minute chart is much less significant than one on a Daily or Weekly chart.
- In a sideways market with very low volatility, Stochastics can give many flickering signals that lead nowhere. The Stochastics works well when there is clear price movement.
To conclude
The Stochastic Oscillator indicator is a powerful tool for momentum analysis. Because it continues to function in a variety of market environments, it has been in existence for more than 75 years. It will increase efficacy when combined with other instruments and indicators. The signal is important, but it only functions effectively if the trader is aware of the surrounding market conditions. Before making a trade, traders should check the signals with additional indicators and exercise caution regarding common pitfalls.
FAQs
What do overbought and oversold levels mean?
When the oscillator crosses above 80, the security is called overbought, and when the oscillator line crosses below 20, the security is called oversold.
What is divergence in the Stochastic Oscillator?
When the Stochastic Oscillator fails to sync with the price move, this signals a weakening of momentum and possible reversal. Such a condition is called divergence.
What is the Stochastic Oscillator mainly used for?
The Stochastic Oscillator indicator is mainly used for measuring momentum and to identify the potential overbought and oversold conditions.
Is the Stochastic Oscillator a trend indicator?
No. A stochastic Oscillator is a momentum indicator. But it works best when used with other tools like moving averages and RSI.
Which timeframe works best for the Stochastic Oscillator?
The Stochastic Oscillator is considered more reliable on higher timeframes like daily or weekly charts. Lower timeframes may produce false signals.







