Option Chain Strategy to track Market sentiment




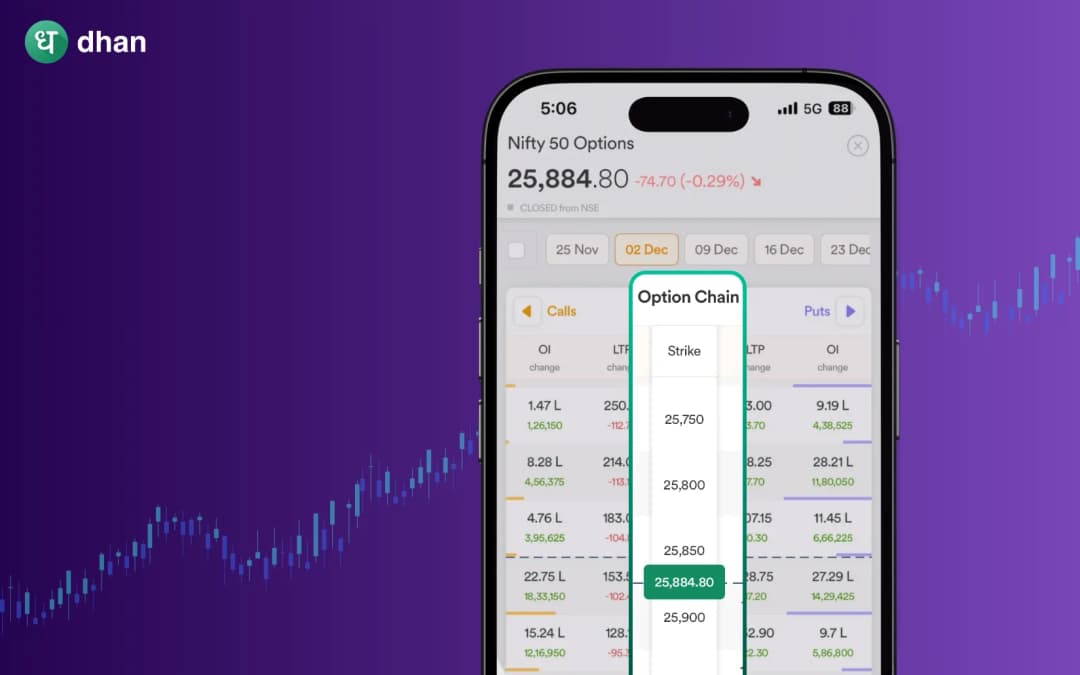




An option chain displays how traders are positioning themselves with calls and puts to help you sense whether the crowd expects higher or lower prices. If analysed properly, option chain data can highlight strengths and weaknesses, sometimes even reversals well in advance.
In this blog, we will explore some practical option chain strategy using option chains to track and interpret market sentiment effectively.
Two indicators in option chain strategy
Option chains hold several indicators that tell you how traders feel about the market. Learn to read them, and you can sense whether traders expect the prices to rise, fall, or stay flat. Let’s look at 2 of the most useful indicators.
Open interest (OI)
This reflects the total number of outstanding option contracts that are open. When OI is increasing with price, this usually indicates that new positions are being added in the direction of the move. An increase in call OI around a particular strike price can reveal resistance building, whereas increased put OI can indicate a support area.
Implied volatility (IV)
Implied Volatility expresses the level of uncertainty in the market. When IV goes up, it means traders are expecting bigger swings ahead. A fall in IV usually gives a signal of calmness or reduced fear. You will be able to anticipate either a potential breakout or a quiet phase by keeping track of IVs.
Popular strategies to track sentiment with option chains
Here are some option chain strategy to interpret sentiment and act accordingly:
1. Bullish sentiment strategy
A bullish sentiment strategy focuses on spotting when traders expect prices to rise in option chains.
If call open interest surges sharply at a few nearby strike prices while the stock price is stable or inching upward, it shows that more traders are buying calls expecting an uptrend.
For example, if the underlying Nifty is around 22,000 and you see a sudden jump in call open interest at 22,100 and 22,200 with steady implied volatility, then it shows growing optimism.
Traders may plan a long call or bull call spread with a view to benefit from the potential move while keeping risk in control.
2. Bearish sentiment strategy
The bearish sentiment strategy is based on finding when traders are anticipating price declines. You can identify this by looking for a sharp increase in put open interest and a decline in call open interest at key strike prices.
This is indicative of more traders buying protection or predicting a decline. It would be a bearish signal, for example, when Nifty is at 22,000 and the 21,800 puts show heavy open interest buildup with increasing volume.
You can plan a put buying or bear put spread in this case to benefit from the falling trend while keeping your risk defined.
3. Range or neutral strategy
The range or neutral strategy is used when the market does not have a specific direction, and a trader cannot determine where it will head.
It can be identified when both calls and puts open interest increase at nearby strike prices, and implied volatility also rises. This is an indication that participants are taking positions on either side for a sharp move but are unsure of the direction.
For example, if Nifty is trading around 22,000 and heavy OI is building up both at 21,900 puts and 22,100 calls, that would mean traders expect volatility ahead.
In such cases, many prefer buying a straddle or strangle to benefit from any strong upward or downward move.
4. Trend reversal or shift strategy
This approach is about catching early signals that traders' sentiment is shifting. Suppose, for example, the call option open interest starts to fall dramatically while the stock price is still on an upward move; this could mean that bullish traders are closing their positions.
At the same time, if put option open interest or implied volatility starts to increase, it's a sign of greater caution or a possible pullback.
Suppose Nifty continues on its upward trajectory toward 23,000, and suddenly traders unwind call positions and add puts at nearby strikes.
This is normally a situation of weakening bullish sentiment and an upcoming correction that provides the trader with an opportunity to position for short or protective trades ahead of the market's turnover.
Using Dhan to execute these strategies
Before diving into trades, you should notice that sentiment changes fast, and you do need a tool to monitor and act in the same rhythm. That's where Dhan becomes useful, as it allows you to open the option chain, see real-time cues of change in open interest, volume, and implied volatility, and then execute your view without switching platforms.
Here are some of its most relevant features:
- Advanced Option Chain view with Greeks, OI, volume, and implied volatility.
- Place orders directly from the option chain for calls and puts.
- Screener and scanner filters for OI change, volume spikes, and other sentiment cues.
- Integration with charting, via TradingView, so you can link underlying price action together with option chain signals.
These tools will help you monitor sentiment-driven signals in the option chain so that you can act more efficiently.
At last
Using the option-chain data helps you move past simple price tracking and gives insight into how traders are thinking. You may want to treat it as a signal when you notice a clear build in open interest, shifting implied volatility, or unusual strike behaviour. Always apply good risk rules, using sentiment cues as part of your toolkit rather than the full picture.
Frequently Asked Questions (FAQs)
1. What would be the primary cue within an option chain that would indicate bullish market sentiment?
When you see fast-rising open interest in the call option and the price of the underlying is showing a gradual rise, it mostly indicates bullish sentiment. A large call OI build indicates that traders are expecting more upside moves in the market.
2. How does the implied volatility in an option chain reflect market uncertainty?
When IV surges across strikes and expiries, this indicates that traders are expecting larger price swings or events in the near future. A low IV is indicative of calm and limited expected movement in the near term.
3. Why is the put-call ratio useful in capturing sentiment from an option chain?
The put-call ratio reflects volumes or open interest between the puts and calls. A high PCR indicates more bearish sentiments, whereas a low or falling PCR suggests bullishness. It gives a quick sense of market mood.
4. Can increasing open interest in put options ever indicate anything other than bearish sentiment?
Yes. If the price drops and put OI rises, that is classic bearish. But it might be hedging, not pure bearish trades, in case of price rise and put OI rising. The context of the price movement is important to interpret it.
5. How does a beginner apply option-chain sentiment cues before strategy execution?
First, scan for clear signals such as OI build, IV spikes, or PCR shifts. Then, combine those with your trend view and risk appetite. Never jump based on a single metric; always check liquidity prior to execution.
Lastly, do not forget to check out Dhan’s position size calculator. This will help you decide your risk amount beforehand.