Volume-based trading strategy explained






While we’re so focused on the price, there is another factor that we often overlook while trading: volume. You see, price tells you what is happening, but volume tells you how strongly the market believes in that move. So, to build a clearer picture of market sentiment, traders combine price action with volume. A volume-based trading strategy builds on this idea to identify strong trends, spot reversals, and filter out false breakout signals.
In this article, we will cover a volume-based trading strategy and how to use it.
What is a volume-based trading strategy?
This is a method of trading where traders look at volume data to confirm or reject price movements. Volume shows how actively a security is being bought or sold.
If the price movement and volume both are up, traders consider it a reliable signal.
If the price moves up with weak volume, there’s doubt on the validity of the price rise.
The celebrated technical analyst, John Murphy, explains that volume expands in the direction of the trend and contracts during corrections.
Why does volume matter in trading?
Volume is, in all honesty, a secondary but highly important indicator. Here’s why:
- Shows the strength behind price moves
- Identifies reversals early
- Confirms breakouts
- Lends confidence to other patterns
Here’s a cheat sheet on how price moves and volume affect trend:
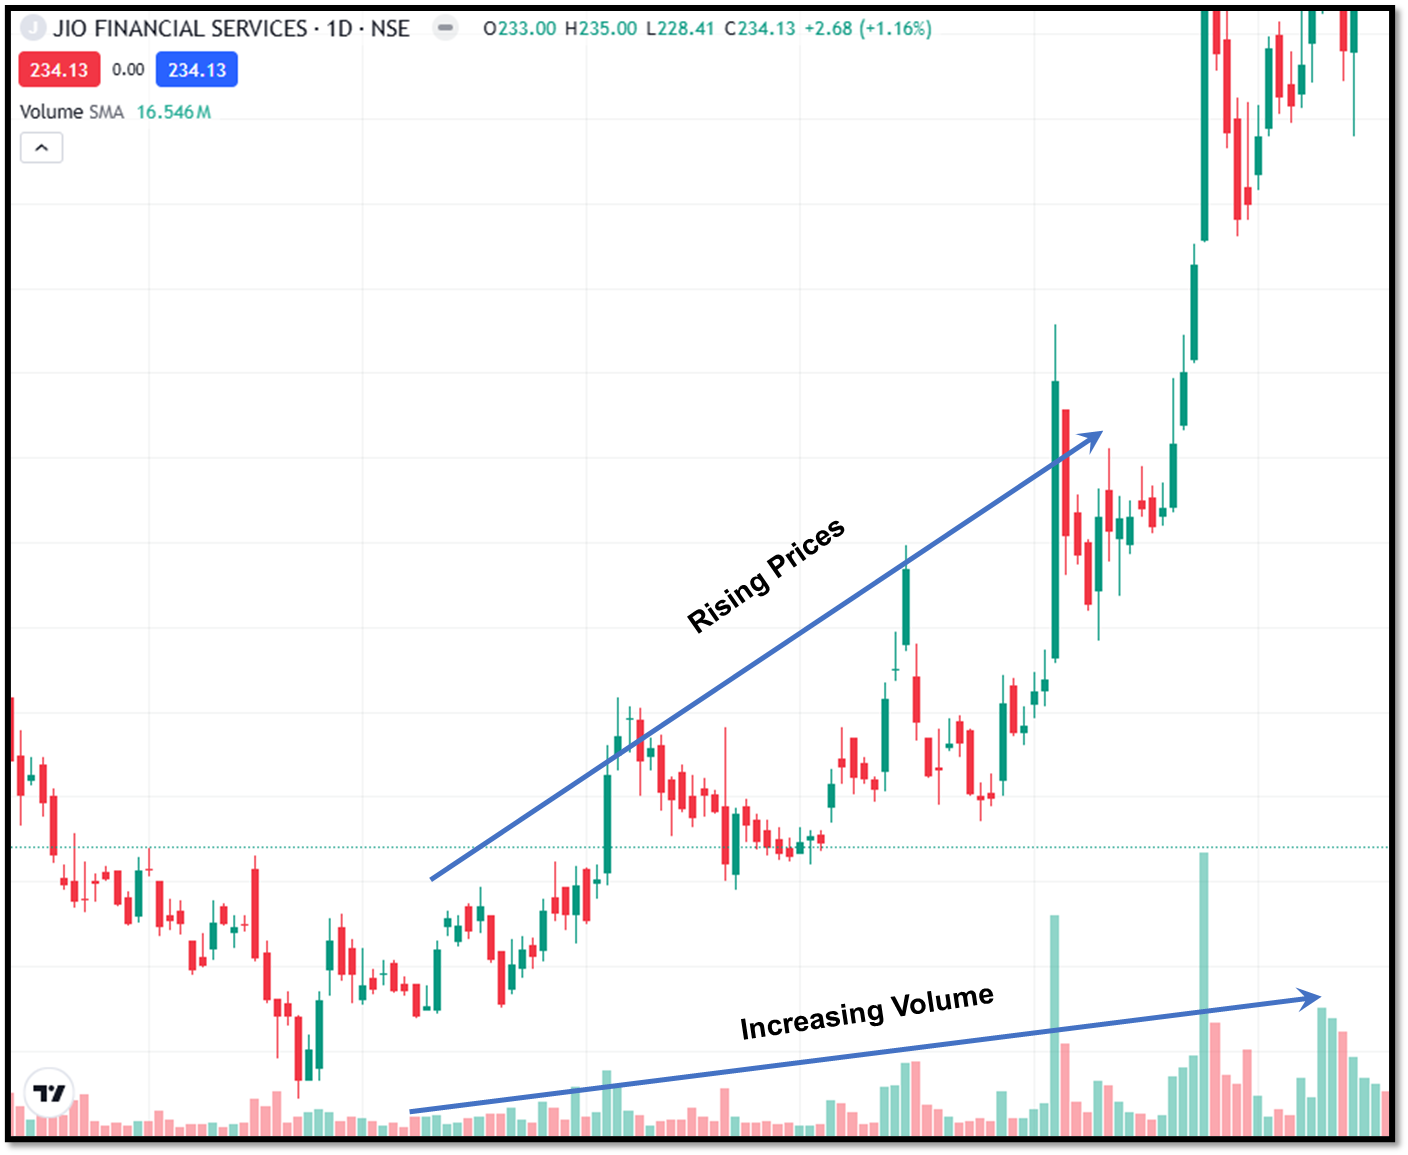
- Rising price + rising volume → strong trend continuation.
- Falling price + high volume → strong downtrend.
- Shrinking volume in an uptrend → weakening momentum.
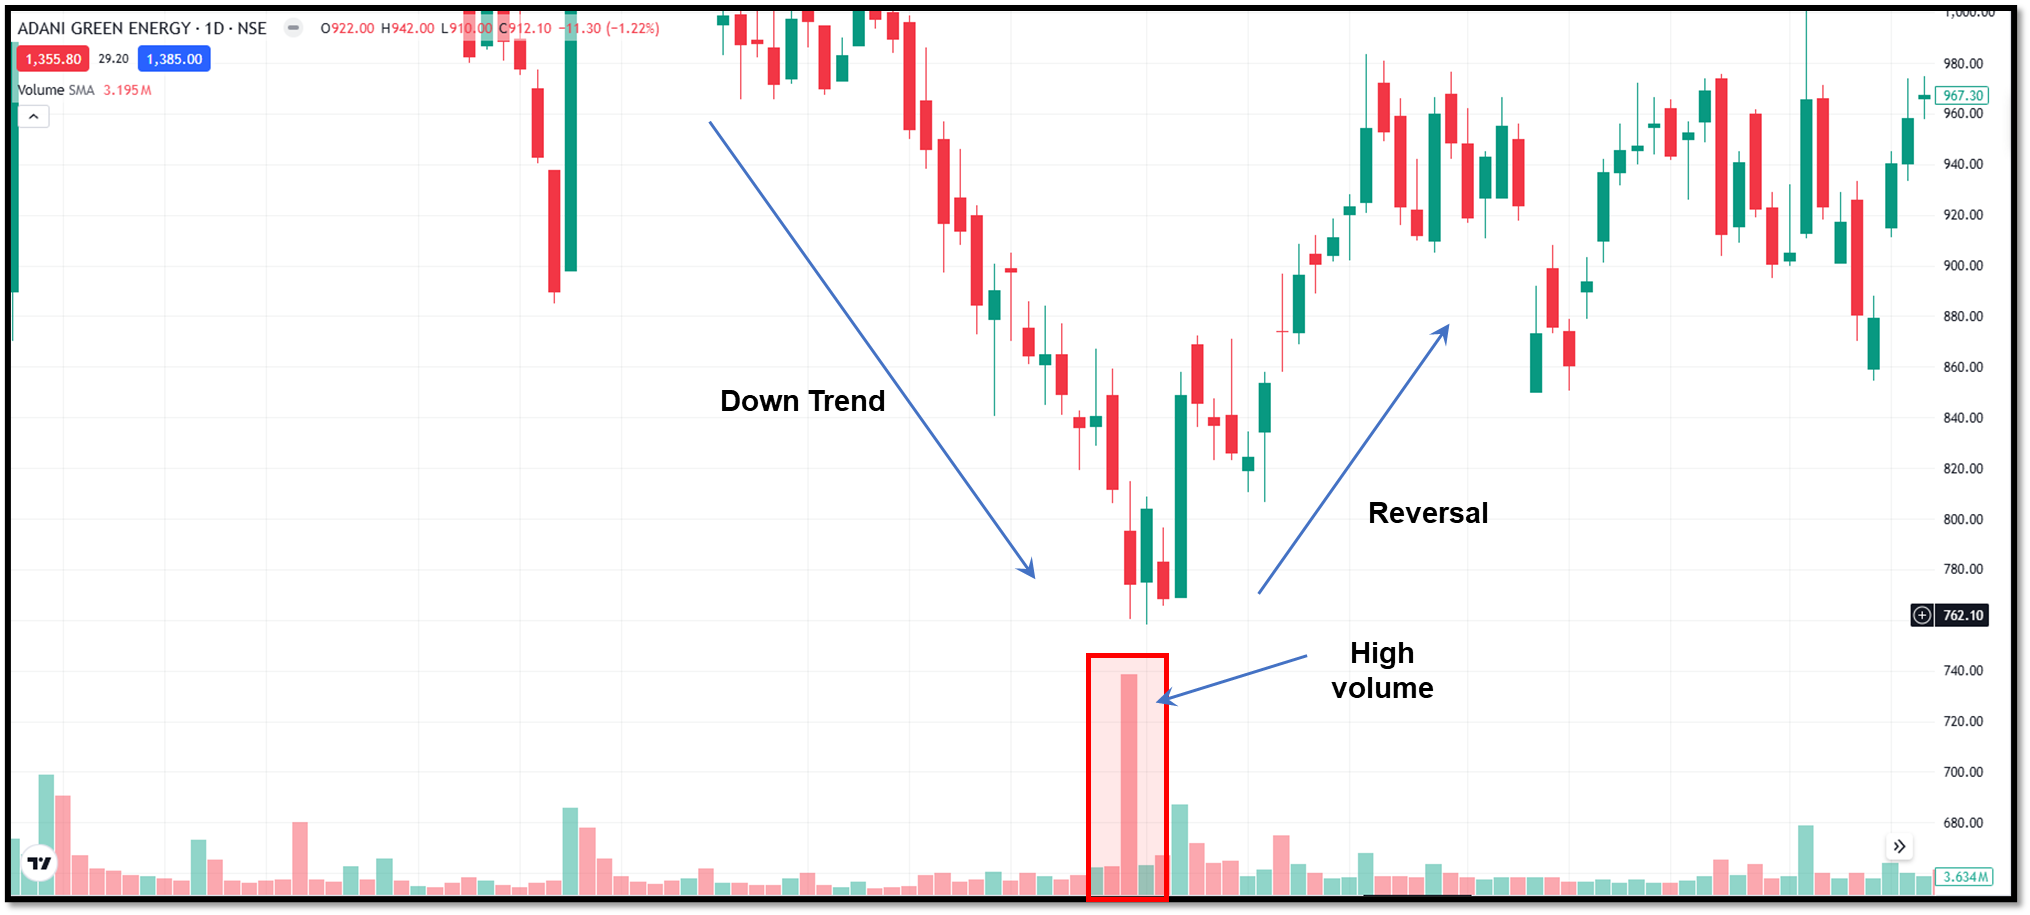
- Spikes in volume during a downtrend → potential reversal.
- Breakouts with high volume → more reliable than low‑volume moves.
Chart patterns such as triangles, flags, and head and shoulders often show clear volume patterns. When the volume matches what we expect, it gives us more confidence in the analysis.
What makes a volume-based trading strategy
A volume-based trading strategy has three components:
Baseline volume
Each stock has its own typical range of volume. To understand what qualifies as “typical range”, traders analyse the stock volume over a period of weeks. That helps them find the baseline volume and subsequently, any abnormal or unusual activity.
Volume indicators
There are several indicators that help interpret volume more clearly:
- On Balance volume (OBV): Created by Joseph Granville in the ‘60s, OBV is a cumulative indicator where today’s volume is added to the running total if the closing price is higher than yesterday’s, and subtracted if the closing price is lower. If OBV rises along with the price, the uptrend is strong. If OBV falls along with the price, the downtrend is strong. Divergence in OBV and price means there’s less conviction behind the move.
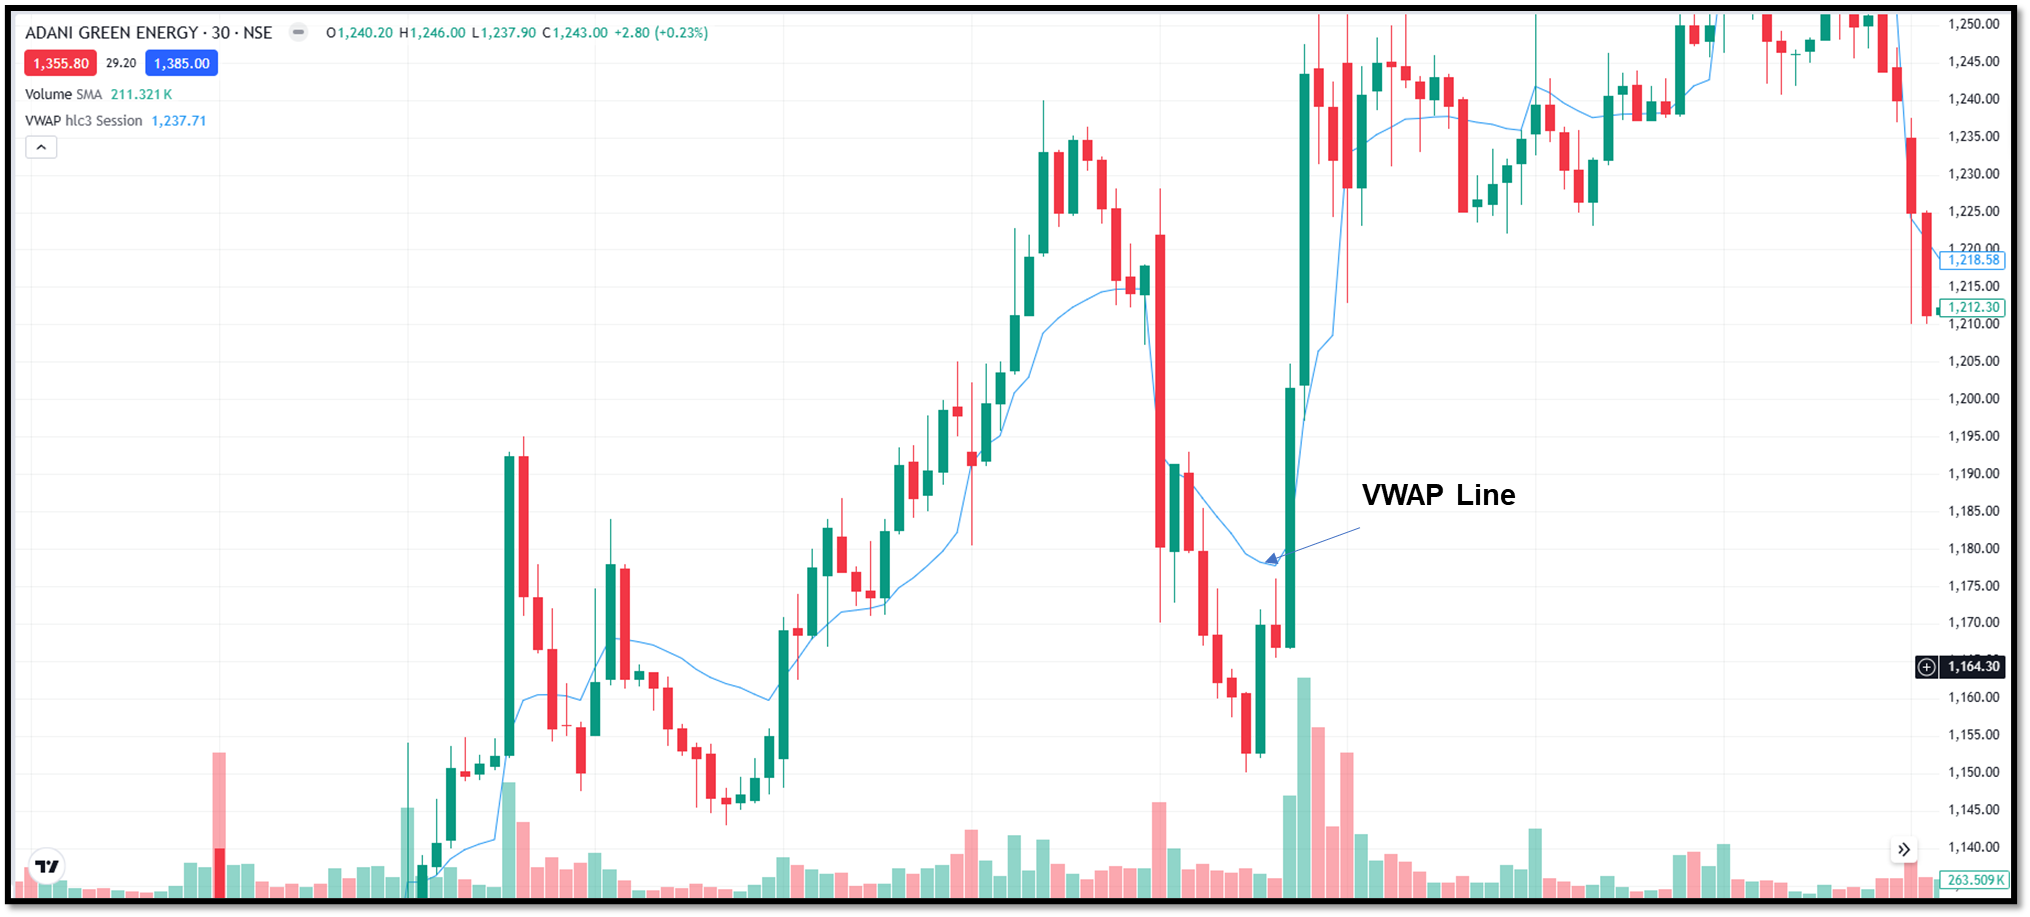
- Volume Weighted Average Price (VWAP): This ratio is the value of the stock (volume x price) divided by the total volume, revealing the average price of a stock (that is weighted by volume). Traders generally look to buy below the VWAP to get a “good deal”.
- Money Flow Index (MFI): Uses price and volume to measure buying and selling pressure on a scale of 0-100. For traders, they look at the figure: if MFI is above 80, then the asset is considered overbought. If it’s less than 20, the stock is considered oversold.
Price confirmation
Price and volume go together to derive any meaningful information. Looking at either volume or price in isolation can give false signals. Together, they paint a fuller picture of market conviction.
Common Volume-Based Trading Strategies
Volume-trading strategies are used mainly to confirm the strength of the prevailing trend. Here are some of the most common strategies traders use:
Volume breakout strategy
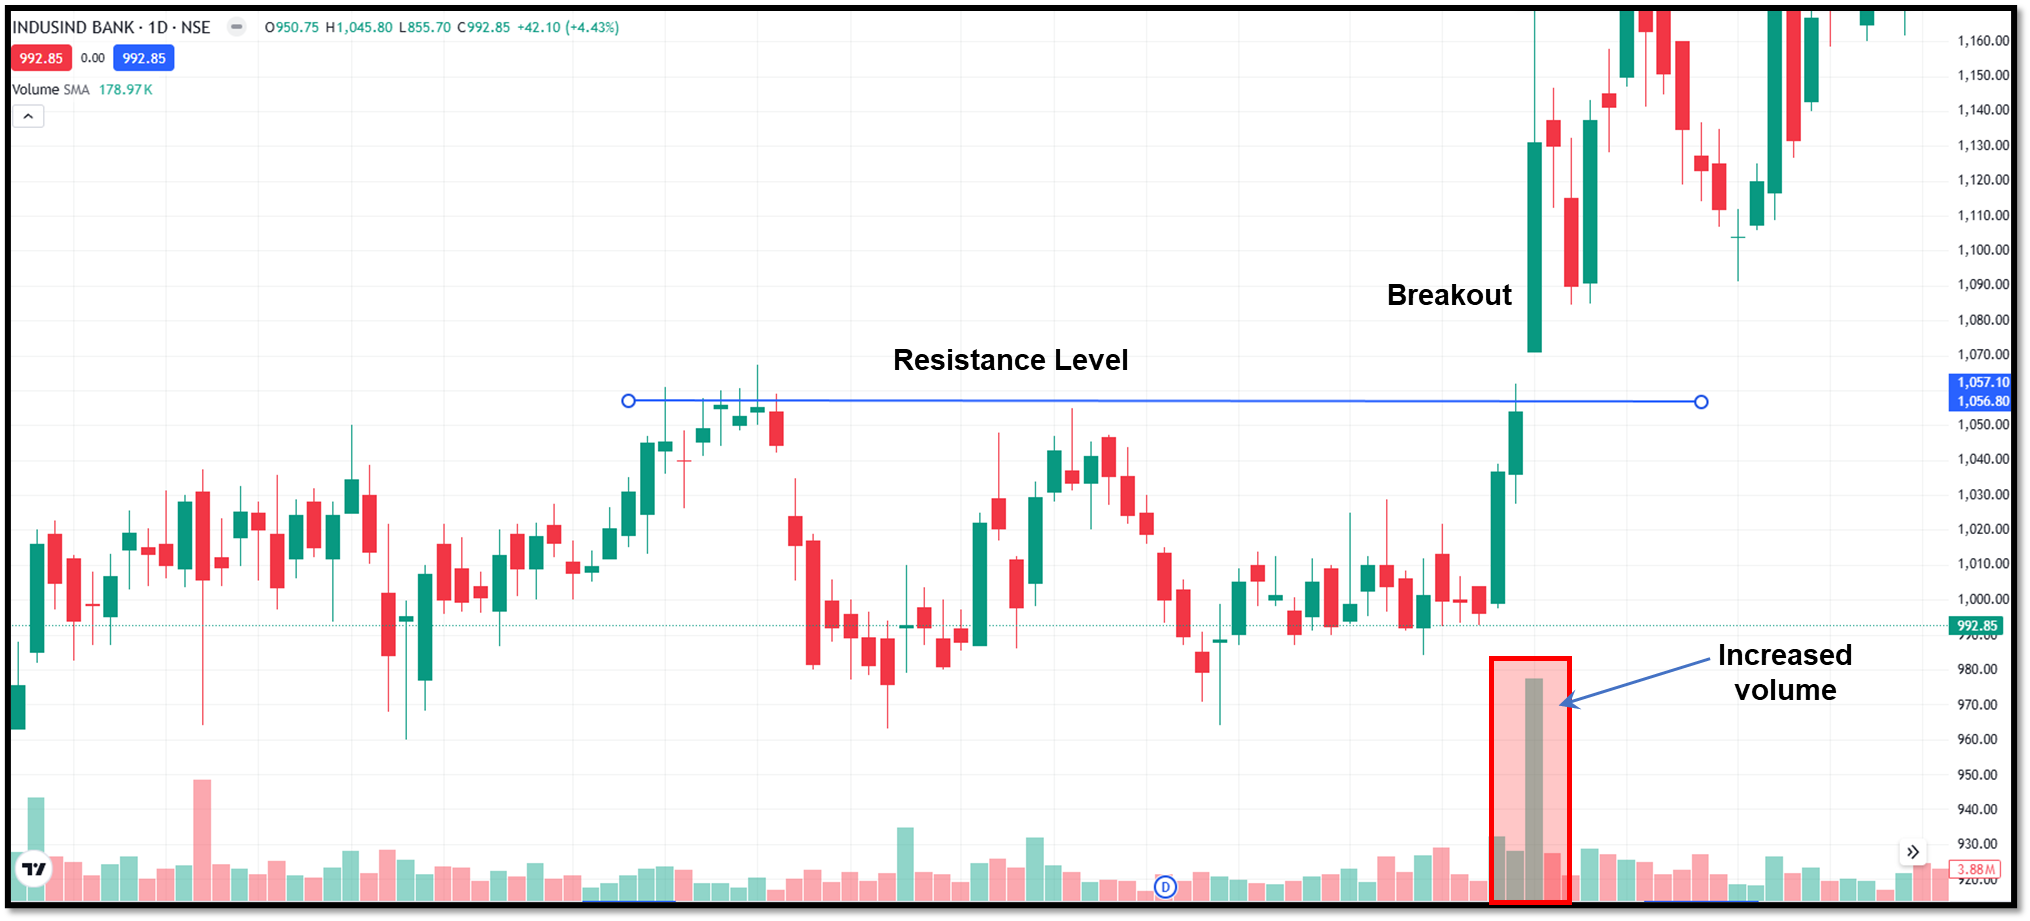
A breakout happens when the price sharply moves above the resistance level, or below the support level (also called a breakdown). When either of these moves happens with above-average volume, it is considered a reliable signal. Traders tend to wait for a candle formation beyond the support or resistance level to confirm the direction.
Volume trend strategy
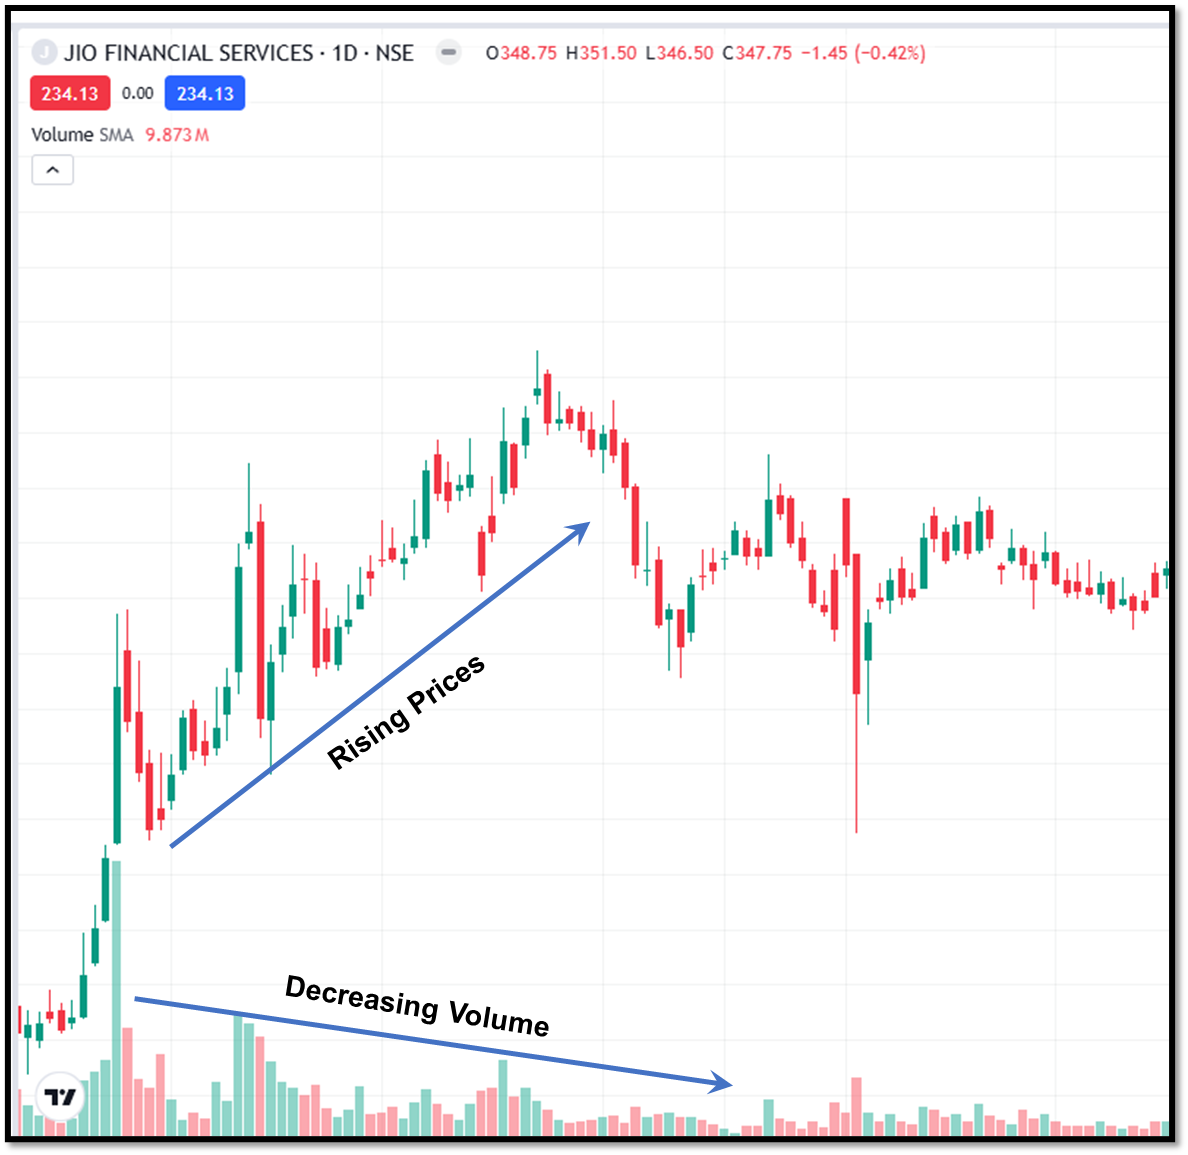
This confirms the ongoing trend. If volume rises during an uptrend or downtrend, it signals strong participation from buyers and sellers, respectively. If volume reduces while price rises, the trend may be weakening.
Volume exhaustion strategy
Extremely high volume after a long uptrend usually means that institutional investors are beginning to sell while retail traders are still buying. Meanwhile, at the bottom of a downtrend, abnormally high volume indicates “capitulation” or the final stage of decline. In both cases, it can precede a reversal.
Volume divergence strategy
If price makes a new high but volume does not, it’s called a bearish divergence. Buyers are probably losing interest. And if price makes a new low, and volume is also falling, sellers are weakening.
VWAP pullback strategy
Primarily used in intraday trading to find mean reversion points. When price moves far above or below the VWAP with high volumes, traders anticipate a pullback towards the average.
How traders implement these strategies
With components and strategies in place, let’s look at how traders actually go about using them.
Step 1: Identifying key levels and market phase
Volume behaves differently in different market phases. Market phase sets the context that helps filter out noise. Then, traders mark key support and resistance levels.
Step 2: Volume analysis
Traders study the average volume of the past couple of weeks to understand baseline volume behaviour. From that, they can understand key support and resistance levels and what constitutes abnormal spikes in volume.
Step 3: Validate with indicators
Traders use OBV or MFI to confirm the connection between price, volume, and direction strength.
Step 4: Enter the trade
Traders enter when volume supports the price action.
Step 5: Manage risk, and exit
Using divergence strategies, traders can place stops around recent swing levels. They exit when volume weakens against their position.
It’s important to note that these strategies work well in a liquid market where small trades do not significantly alter price, and where buyers and sellers are readily available. In illiquid markets, volume analysis may not be as reliable and remains its most significant drawback.
The final call
Volume is a fundamental indicator that, when used with price, works well to identify strong trends, detect reversals, and avoid traps. After the price, it is probably the next thing to look at before you move on to more advanced indicators. For beginners, though, using volume plus price action can help them avoid basic mistakes. To get started, download the Dhan app and create a demat account for free in just a few minutes. Get real-time access to price, volume and other advanced indicators and start trading!
FAQs
1. Why is volume important in trading?
Volume shows the strength behind a price move and helps confirm trends.
2. Which is the simplest volume indicator?
If you are looking for a simple indicator, the On Balance Volume is easy to understand and is used widely.
3. Is volume useful for intraday traders?
Yes. Day traders often use tools like VWAP and intraday volume patterns for more precise trading.
4. Can volume be used alone?
Volume works best when combined with price action and risk management.
5. Can volume predict reversals?
Yes, but not always. Big spikes in volume after a long trend can suggest a possible reversal is near, but research is needed.