Best Indicators for Option Trading






In recent years, options trading has gained tremendous growth due to its flexibility to profit from different market conditions. Although there are possibilities for profit, it also exposes traders to high risk. Understanding the market conditions to make decisions within the timeline is crucial. Technical indicators help in understanding the various factors associated with market movements, like volatility, time decay, momentum shifts, and liquidity conditions, and help traders to analyze the situation.
Selection and understanding of these indicators are very important to gain the right information at the time of requirement. Let's learn about the best indicator for option trading that professional traders use during trading.
What are Trading Indicators?
Indicators are calculations based on price, volume, or other data, plotted on charts to help traders spot trends, momentum, volatility, and potential buy/sell signals, acting as tools to forecast future market movements, though not foolproof. They provide visual cues to analyze market psychology and identify patterns, with common types including Moving Averages (lagging), RSI (momentum), and Bollinger Bands (Volatility).
The best indicator for option trading helps traders with:
- Trend filtering - to make the decision of whether to trade a call (CE) or a put (PE).
- Momentum confirmation - It should give an idea about the strong momentum or weak momentum.
- Volatility - It should show the volatility, as options lose value in low momentum.
- Liquidity - It should indicate the liquidity to avoid fills and slippage.
Best Options Trading Indicators
Options move for reasons that aren’t always obvious on a plain price chart, so these tools act like small clues that help you read momentum, volatility, and market intent a little more clearly. Keeping the above points in mind, we will explore the option trading indicators:
Exponential Moving Averages (EMA)
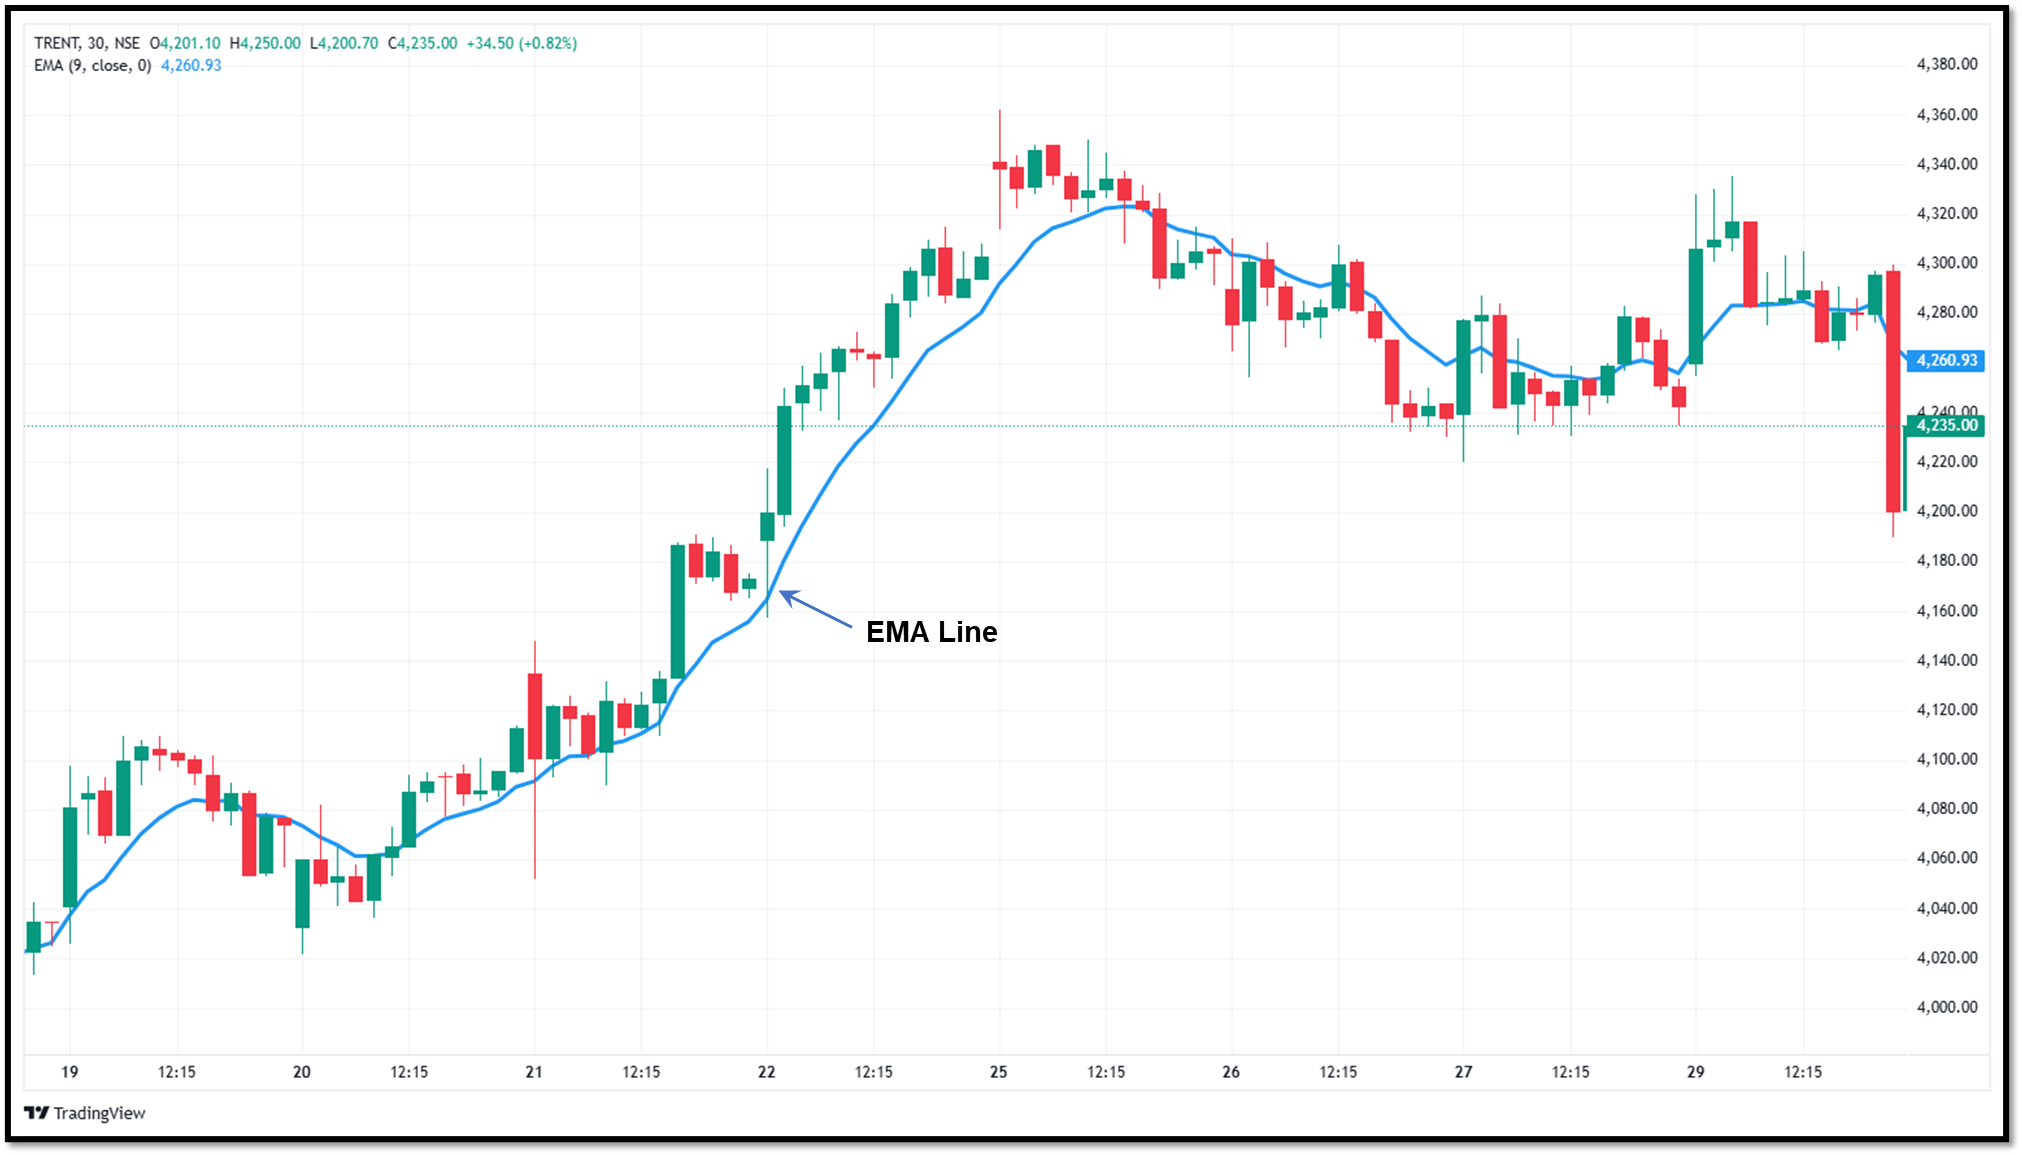
EMA is an upgraded version of the standard moving average. It gives the idea of the direction of the option. EMA emphasizes recent data points more heavily and responds swiftly to price fluctuations.
Traders use EMAs with 9 and 20 to identify short-term directional shifts and EMAs with 50 to give the broader market view.
How does EMA help in options trading?
- Provides the possible market direction
- Provides dynamic support and resistance zone
- Helps to detect trend change
Relative Strength Index (RSI)
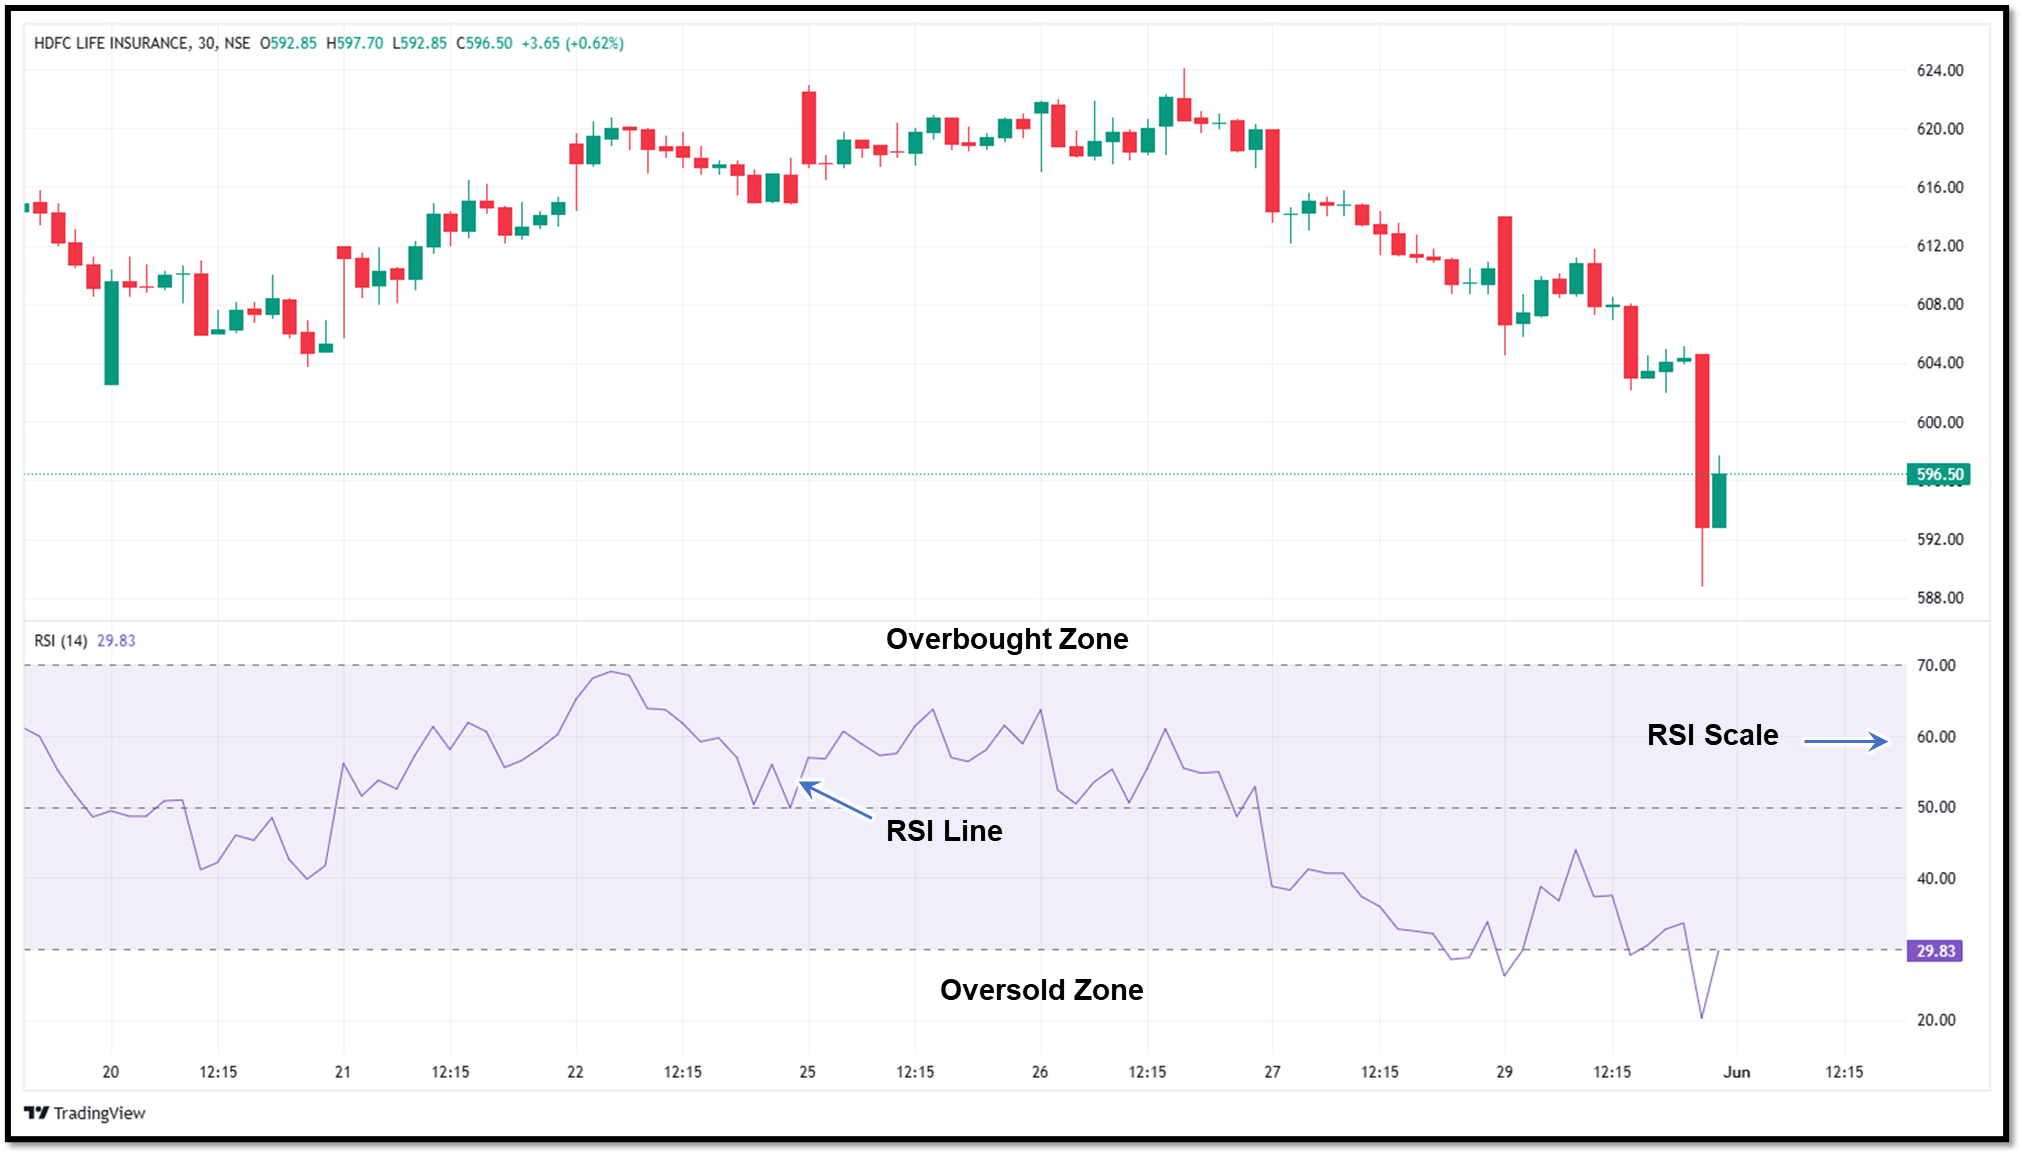
RSI measures how quickly and strongly a price has moved up or down to gauge momentum. RSI gives the idea of whether the option is overbought or oversold. It changes between 0 and 100. If RSI is above 70, it represents the overbought zone, and for RSI below 30, it is an oversold zone.
The indicator helps traders to make the decision to close the long position or short when the security is overbought and vice versa.
How does RSI help in option trading?
- Identifies overbought and oversold zones
- Shows momentum strength
- Confirms trend continuation
Bollinger Bands
Volatility plays an important role in options trading. Bollinger Bands measure the volatility of a security. This band has an upper band and a lower band. The price of the security usually stays in-between these two limits. If the volatility is high, limits get broader, and if the volatility is low, they shrink.
If the price of the security approaches the upper band, it represents that the security is overbought, and crossing it can result in a reversal. Similarly, if the price approaches the lower limit, it means the security is oversold, and a breakout can result in a reversal.
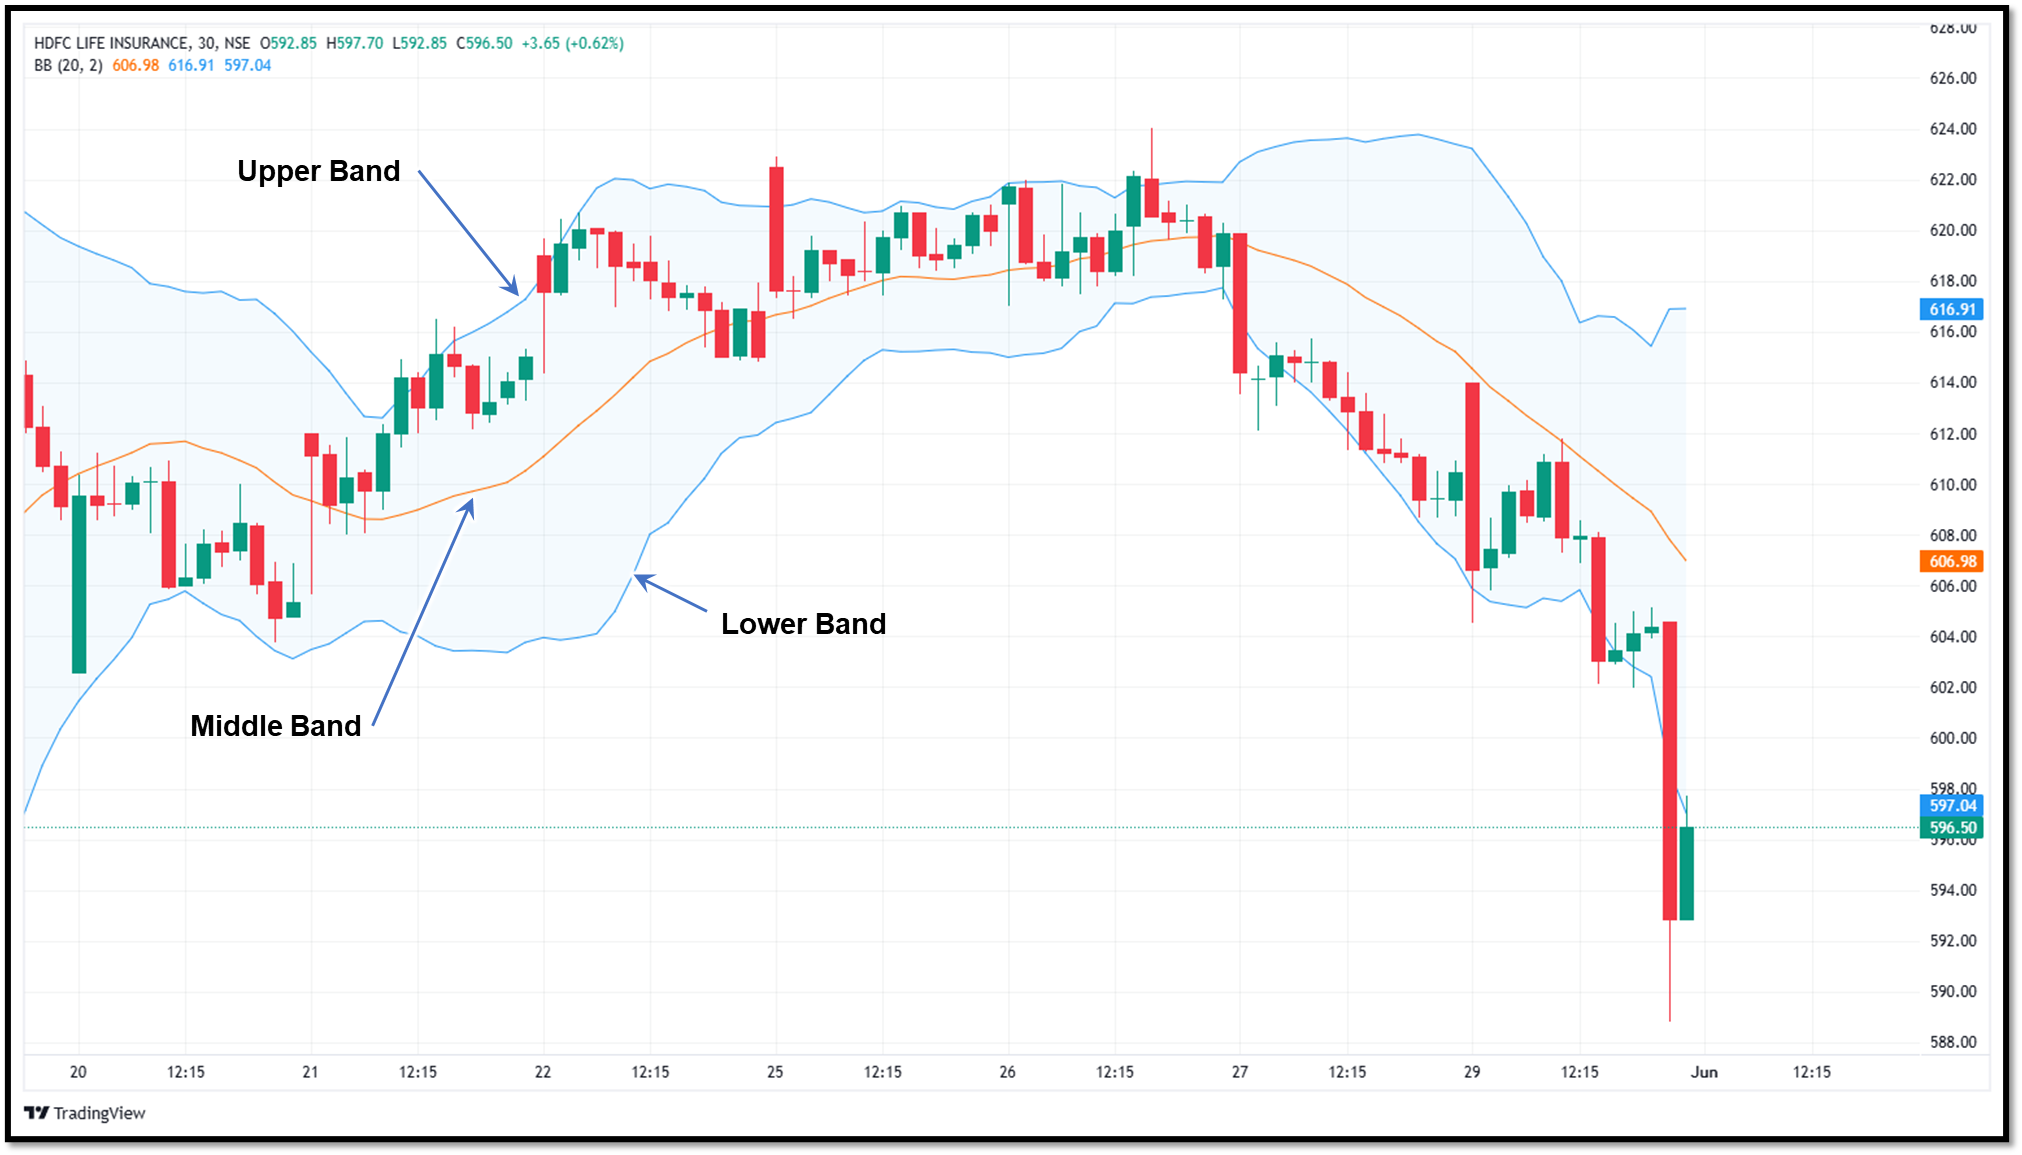
How do Bollinger Bands help in option trading?
- Helps traders decide when to use debit strategies (low IV) or credit strategies (high IV)
- Touches at upper/lower bands often hint at exhaustion or pullbacks, useful for reversal trades or iron condors
- Squeeze patterns signal upcoming big moves
Put-Call Ratio (PCR) Indicator
In options trading, the PCR indicator is an important tool that a trader should have. It helps traders to understand which options are being purchased more, call or put. Traders can sense the market sentiment by looking at the PCR.
If the PCR indicator is below 1, it signifies that more calls are being purchased and the market can move upwards (bullish sentiments). If the PCR indicator is above 1, it signifies more puts are being purchased, and the market can go downwards (Bearish sentiment).
How does PCR help in option trading?
- Useful for gauging market behaviour
- PCR trend changes help confirm entry direction
Open Interest (OI)
Open interest measures the number of open contracts at a particular strike price. Traders use it to analyze the strength of a trend. It is often used in conjunction with price for trend analysis.
An increase in OI indicates that fresh positions are being created, and if supported by price movement, indicates the trend strength is strong and will be sustained, while a decrease in OI indicates that the traders are closing positions, which represents the trend is losing steam. Traders use OI for hedging and deploying complex strategies.
How does OI help in option trading?
- Shows where traders are placing their money
- Rising OI with rising price confirms a strong trend
- Rising OI with falling price suggests fresh short buildup
Volume-Weighted Average Price (VWAP)
VWAP represents the average price that is traded during the day, weighted by the total traded volume. If the price moves above the VWAP line indicates that buyers are becoming active (possible uptrend), and if the price moves below VWAP represents that sellers are becoming active (possible downtrend).
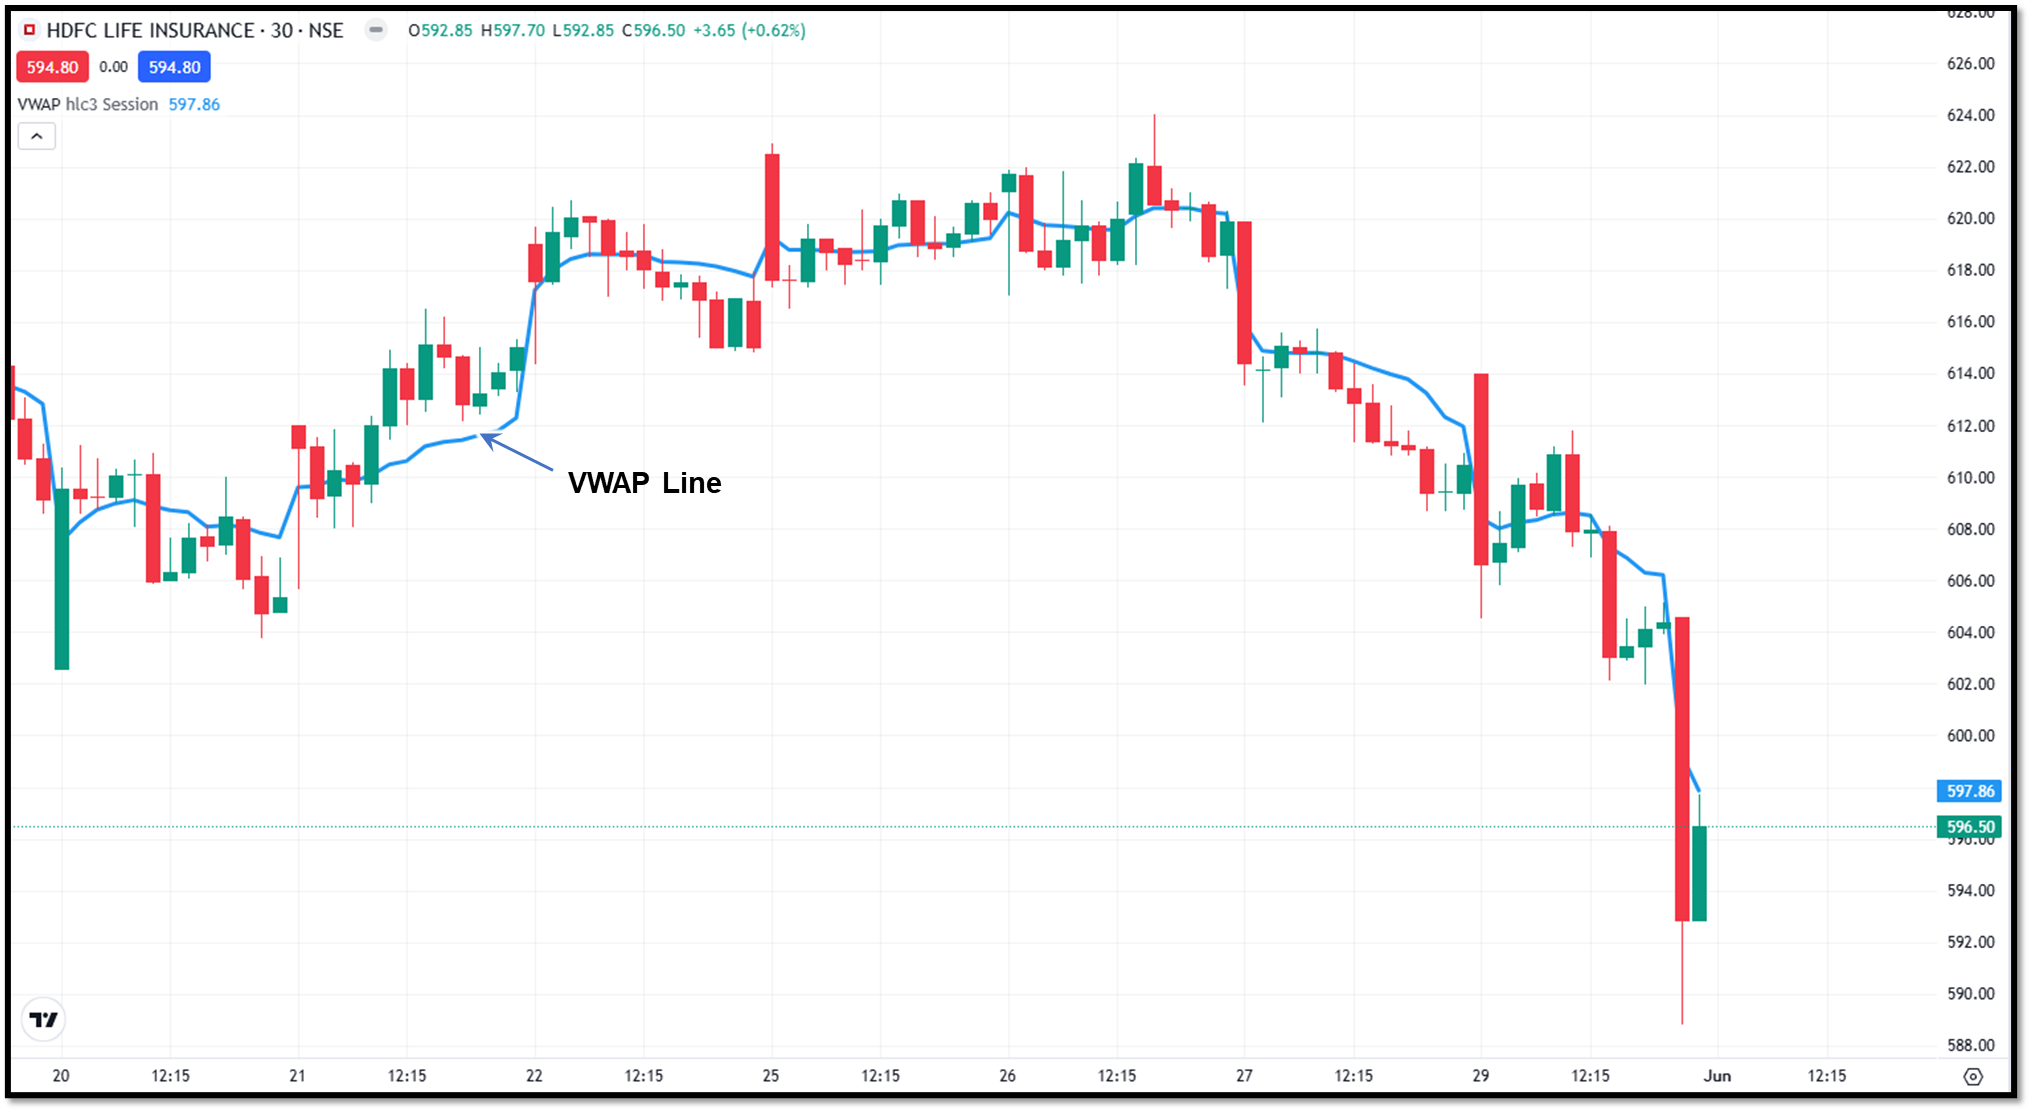
How does VWAP help traders in option trading?
- help traders judge whether the price is trading in a premium or a discount zone
- Great for identifying trend vs. pullback
- Confirms institutional activity
Common mistakes that option traders must avoid
Following mistakes a trader must avoid in order to prevent false indications.
- Some traders use only price indicators and ignore volatility. Traders must understand that option premiums decay when the price doesn’t move fast enough.
- Entering the trade when RSI and BB show sideways is very risky. It can be a theta trap.
- One should always check the volume profiles while trading strikes because worst fills happen near low-volume zones.
- Traders purchase futures or options without knowing the expiry, and also forget to roll before delivery cycles. Remember, Futures need closure, options don’t obligate, but expiry affects premium value.
- Leaning on one indicator only can be dangerous; before entering the trade, traders should verify the trend with other indicators as well.
- Trading without a stop loss will increase the risk. Traders must analyze and apply stop losses.
To wrap up
In option trading, the best indicator for option trading provides a lot of information on which a trader can rely. But one should not misinterpret the indication, which can lead to loss. Having good knowledge about the indicators always helps traders to analyze the situation clearly.
There is no single ‘best indicator’ that will indicate accurate moves. The trader must use and interpret the indicators depending on the situation. Also, using a number of indicators will lead to confusion.
Indicators don’t guarantee profits, but they dramatically increase your probability of making informed and timely decisions.
FAQs
Can I trade options just using moving averages?
Yes. But it is risky. Options also need validation from volatility. Moving averages can help you spot the direction of the trend and find cleaner entries, yet options behave differently from stocks because of time decay, volatility shifts, and rapid intraday swings. So relying solely on them often leaves traders blind to factors that matter more in options than in equities.
Which indicator is best for 0-DTE option trading?
Intraday directional indicators like Supertrend and VWAP are highly practical for 0-DTE trades because they respond quickly to price movement and help you stay aligned with momentum.
Why do traders avoid sideways markets in CE/PE buying?
Traders generally stay away from buying calls or puts in a sideways market because premium decay works against them every single minute. When the price drifts without direction, the option loses value even if the trader’s view isn’t technically wrong.
Which indicators can a beginner use?
A beginner can use three indicators that represent trend (like EMA or Supertrend), momentum (RSI or MACD), and volatility (Bollinger Bands or ATR). Using too many indicators will lead to confusion.
What timeframe works best for analyzing indicators for options?
Many traders use a 5-minute candle chart for intraday trading and a 15-minute candle chart for trend confirmation. For checking a broader view, one can use a 1-hour candle chart as well.