Bearish Candle Patterns








Key takeaways
- Bearish candle patterns help in identifying early signs of weakness in an uptrend.
- Understanding different bearish patterns like the bearish engulfing pattern, evening star, shooting star, hanging man, and others enables traders to spot changes before a major decline. This helps them protect their profits and reduce losses.
- The pattern is mostly reliable when it appears after an uptrend and is confirmed through trading volume or price action.
- Bearish patterns work the best when combined with other tools and technical analysis.
The financial market largely revolves around a single goal of making profitable trading decisions. Whether you are looking for short-term or long-term opportunities, trying to protect gains, success often comes when you understand where the market may move next. Of course, predicting price movements with complete accuracy is challenging. That’s why traders rely on trends, market sentiments and chart patterns to identify potential opportunities.
Among the various tools in technical analysis, candlestick patterns are among the most widely used methods for understanding stock and market trends.
While some patterns suggest that a stock may keep moving higher, others show that it may start moving lower. Bearish candle patterns fall in the second category, indicating that a stock is losing strength and that sellers are gaining market control.
In this article, we will explore what a bearish candle pattern is, how it works, its types, advantages and limitations and how traders can leverage it for a broader trading strategy.
What is a Bearish Candle Pattern?
A bearish candle pattern signals possible downward momentum. Some patterns are reversal patterns that form after an uptrend and signals weakened bullish momentum. While some patterns forms after It appears when a higher price movement starts to lose strength, indicating the price of a stock, commodity, or other asset may be moving lower. This happens when sellers push prices substantially lower than where they opened and begin to take market control.
Thus, a stock may continue to rise as long as buyers continue supporting the move upward. However, when buyers lose confidence, and sellers step in, the trend gets weaker. A bearish candle pattern enables traders to spot these early signs of weakness before a large decline happens.
List of Bearish Candle Patterns
Here are some of the popular bearish candle patterns.
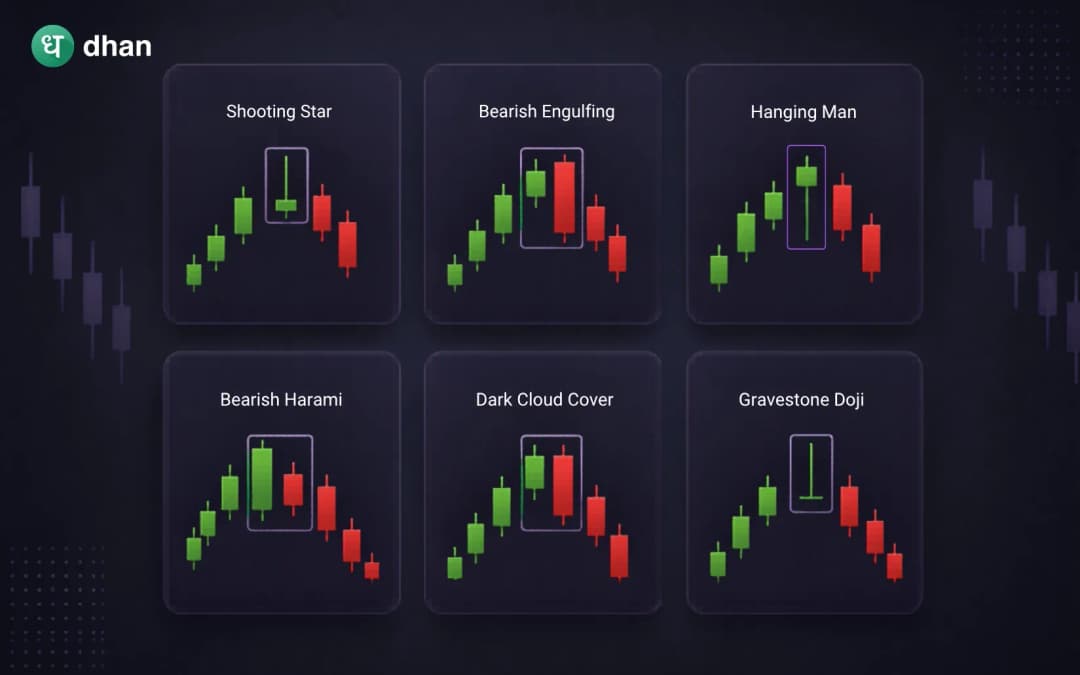
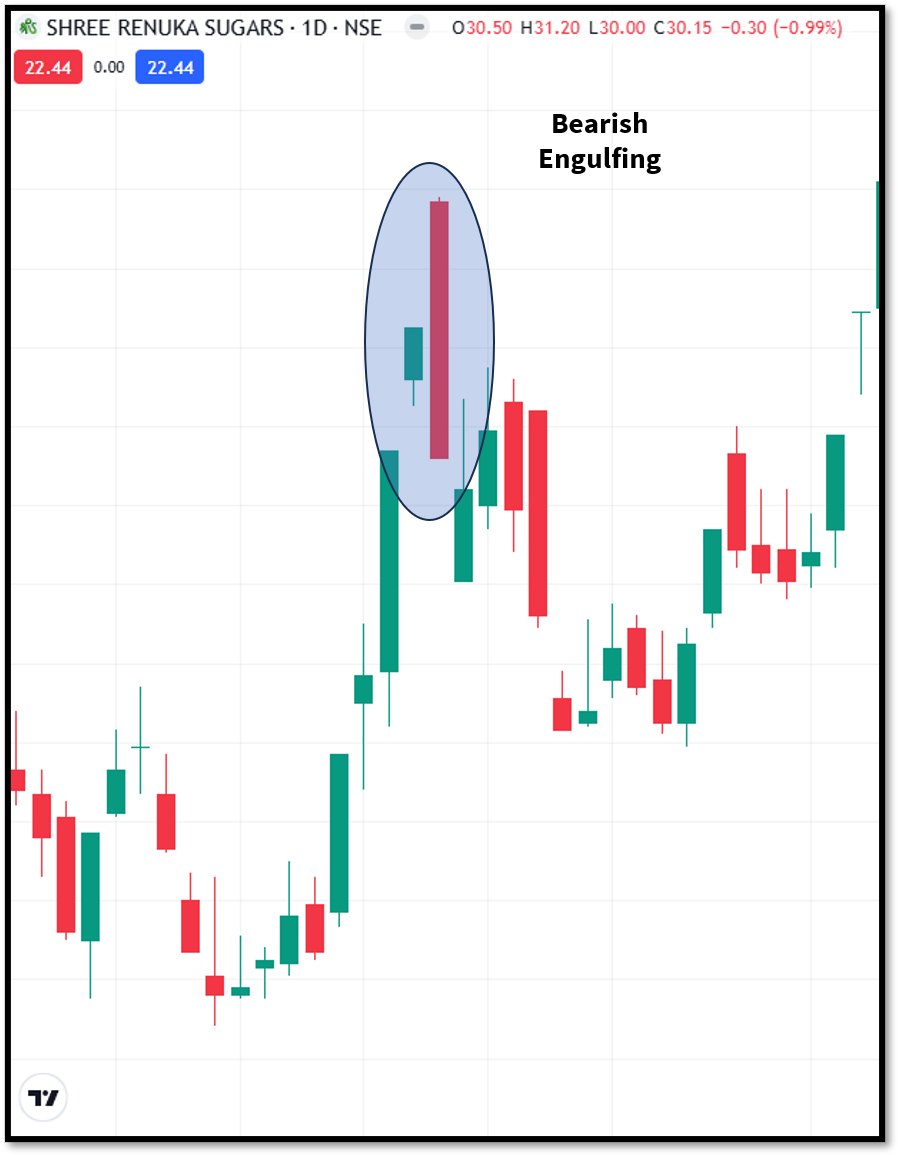
1. Bearish Engulfing
Bearish engulfing pattern forms when a slightly bullish candle is followed by a strong bearish candle. It suggests that sellers have completely overpowered the market, taking full control.
2. Shooting Star
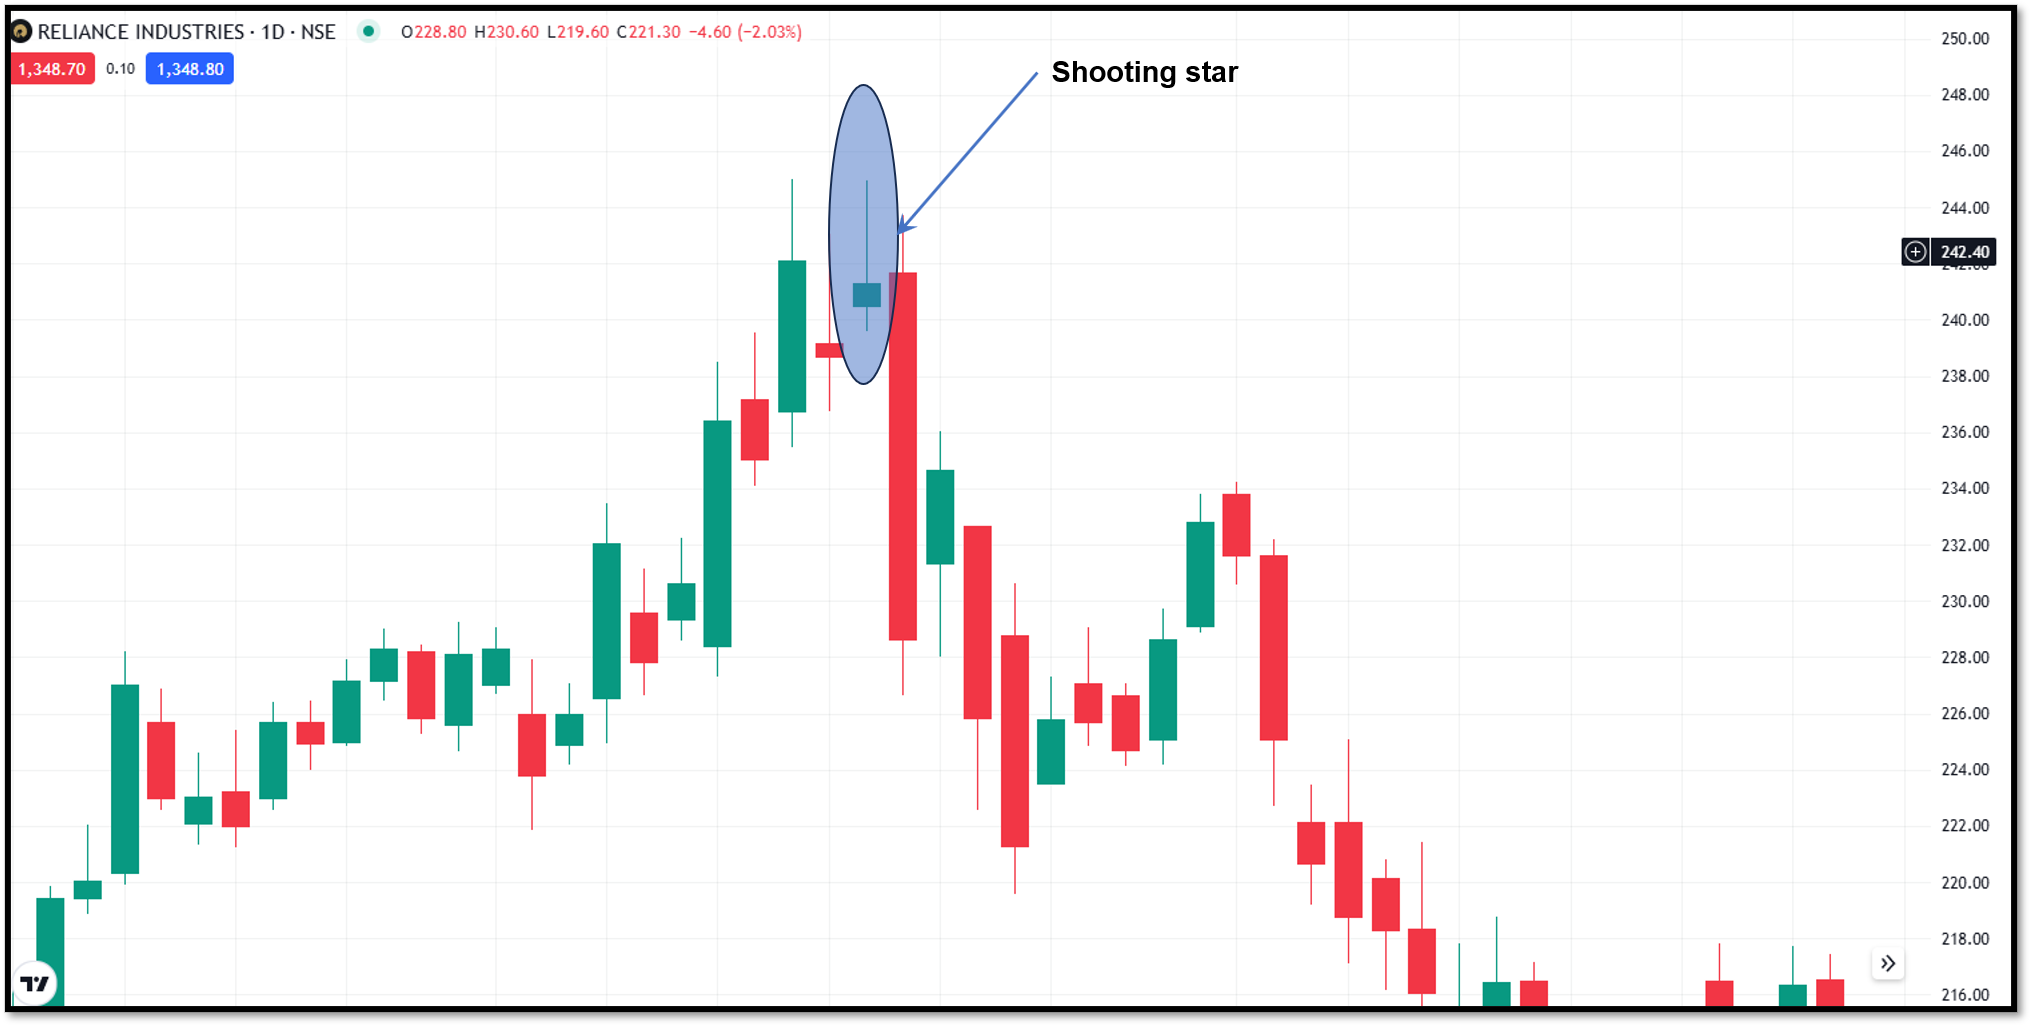
A shooting star is a single candle pattern that appears after an uptrend. During the session price moves higher but fails to hold the gains and closes near the bottom. It indicates the sellers pushed back against the upward move.
3. Evening Star
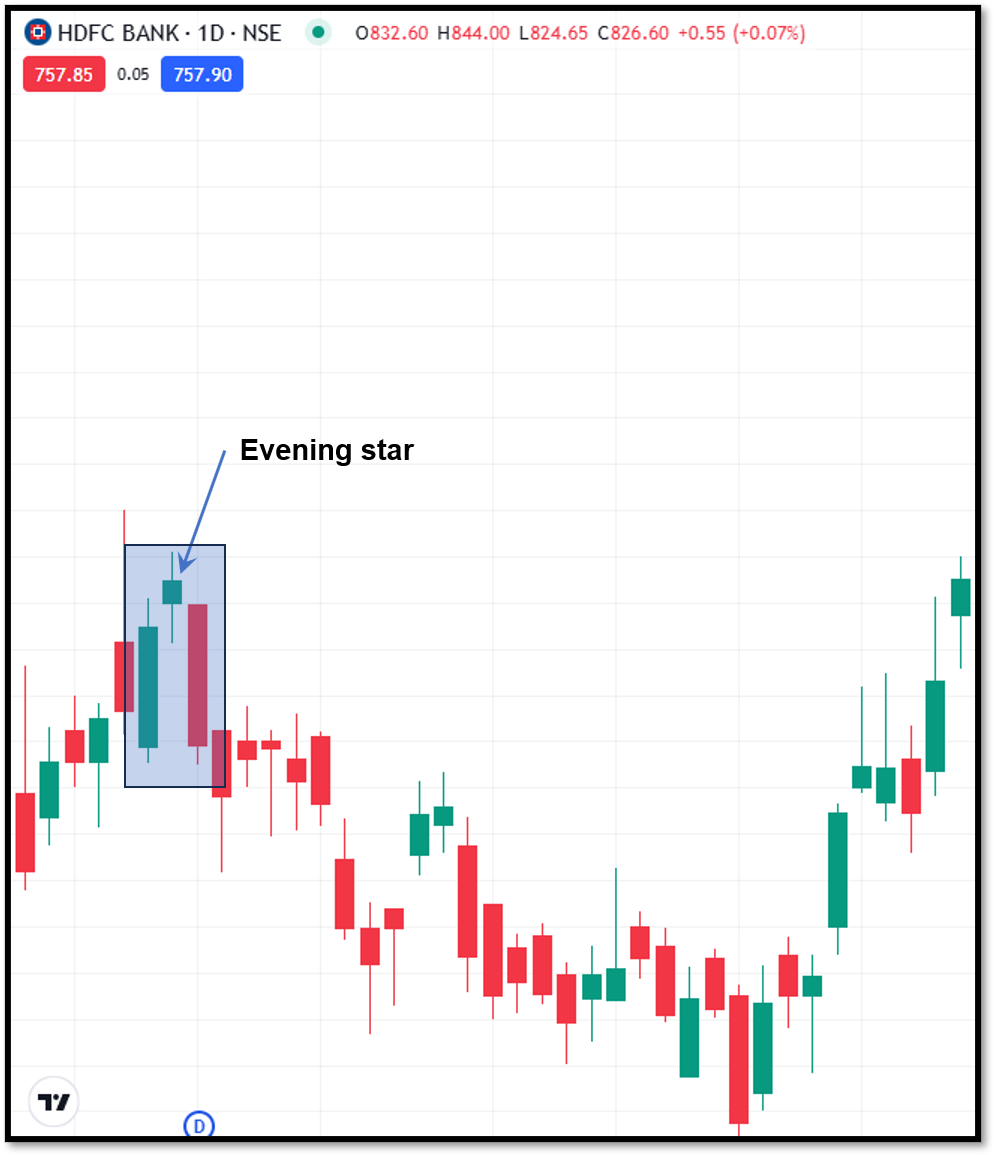
This evening star pattern consists of a strong bullish candle, a small -bodied candle depicting indecision and a bearish candle that closes into the body of the first candle. It reflects a gradual shift from buying pressure to selling pressure.
4. Hanging Man
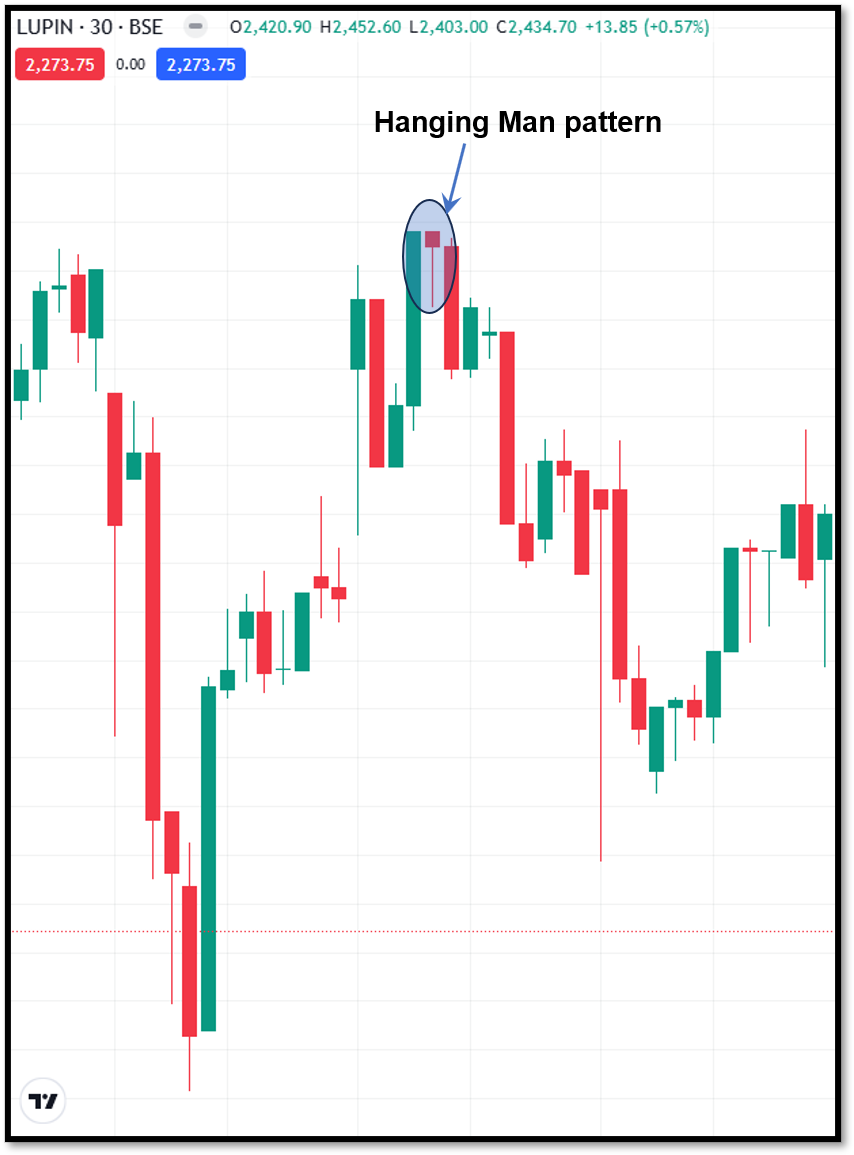
The hanging man appears after a strong upward move and is recognised by a small candle body with a long lower wick. It represents that sellers are testing the market, even though the price is still moving higher.
5. Dark Cloud Cover
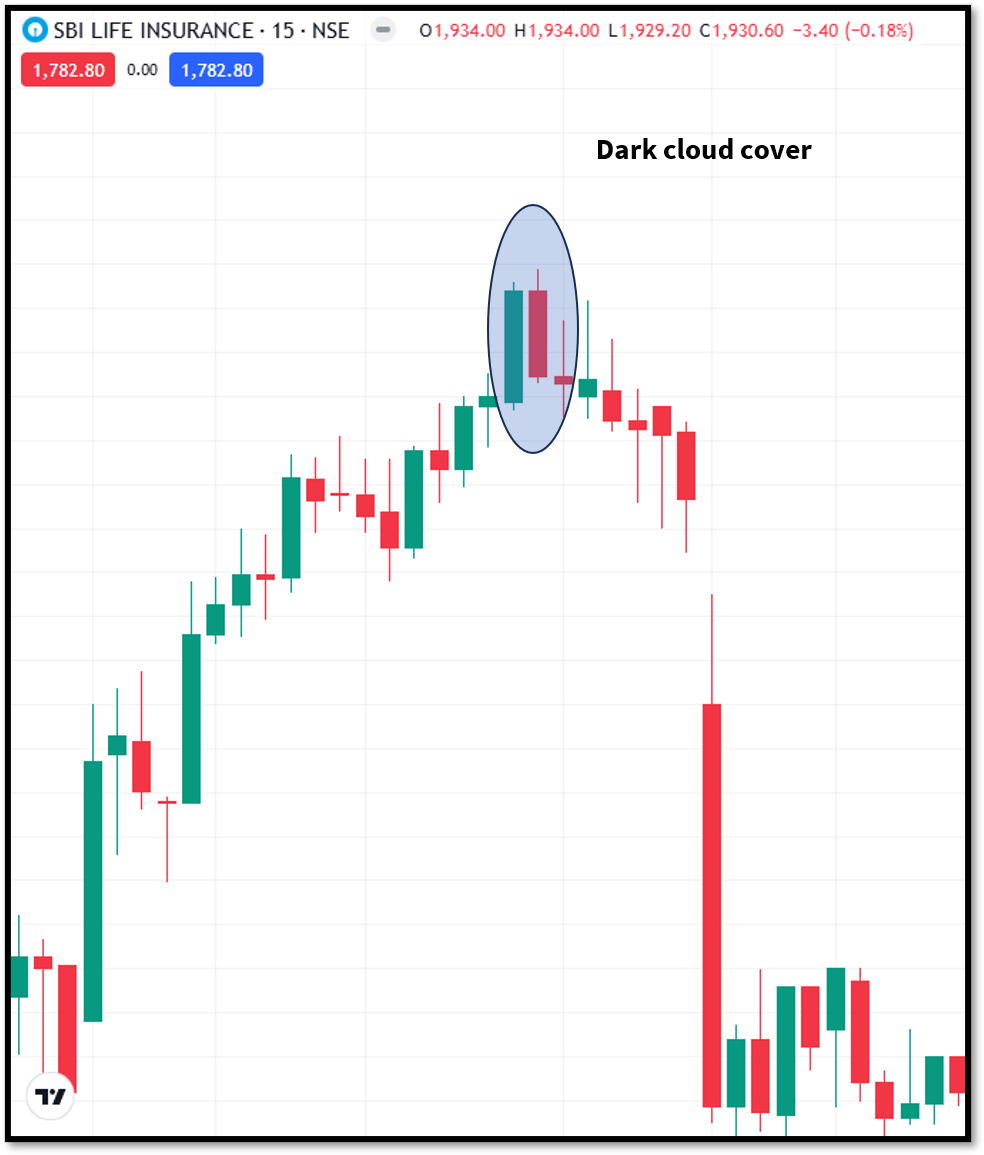
This dark cloud cover pattern forms when a bearish candle appears after a bullish one and closes below the midpoint of the first candle’s body. It implies that sellers have stepped in a big way, and the buying momentum is weakening.
6. Three Black Crows
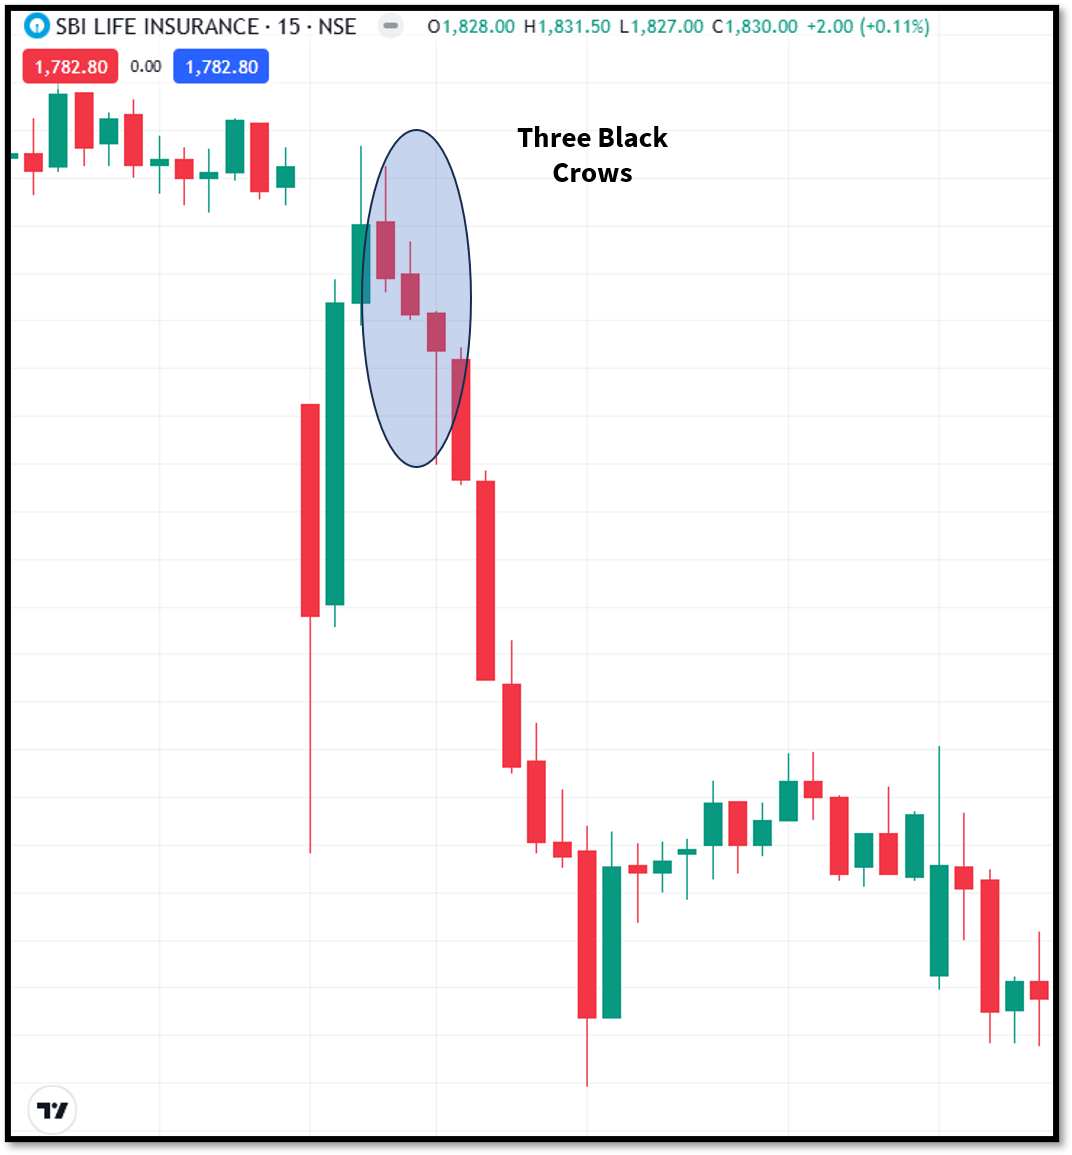
The three black crows pattern forms when the three consecutive strong bearish candles close below the previous candle, each closing lower than the previous one. It usually suggests that sellers are firmly controlling the market and that prices may continue to move downward.
7. Gravestone Doji
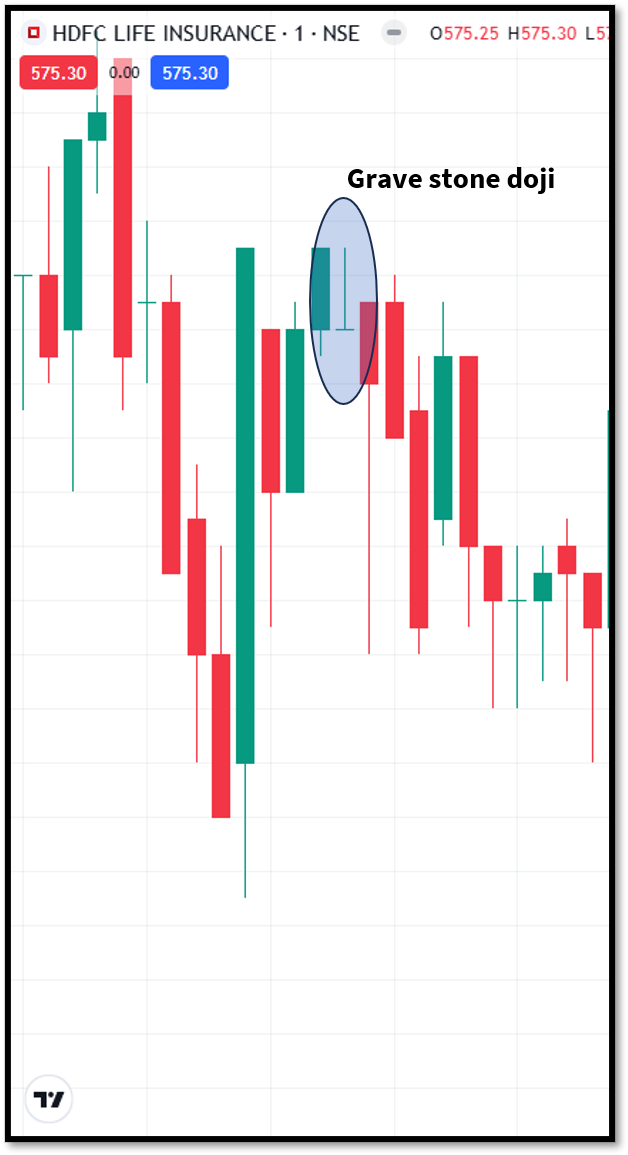
The gravestone doji forms when the opening, closing, and low prices are nearly the same, with a long upper shadow. The pattern shows buyers pushed prices much higher during the session, but sellers jumped in and pushed prices closer to the open. When a gravestone doji forms after an uptrend, it suggests the possibility of a bearish reversal.
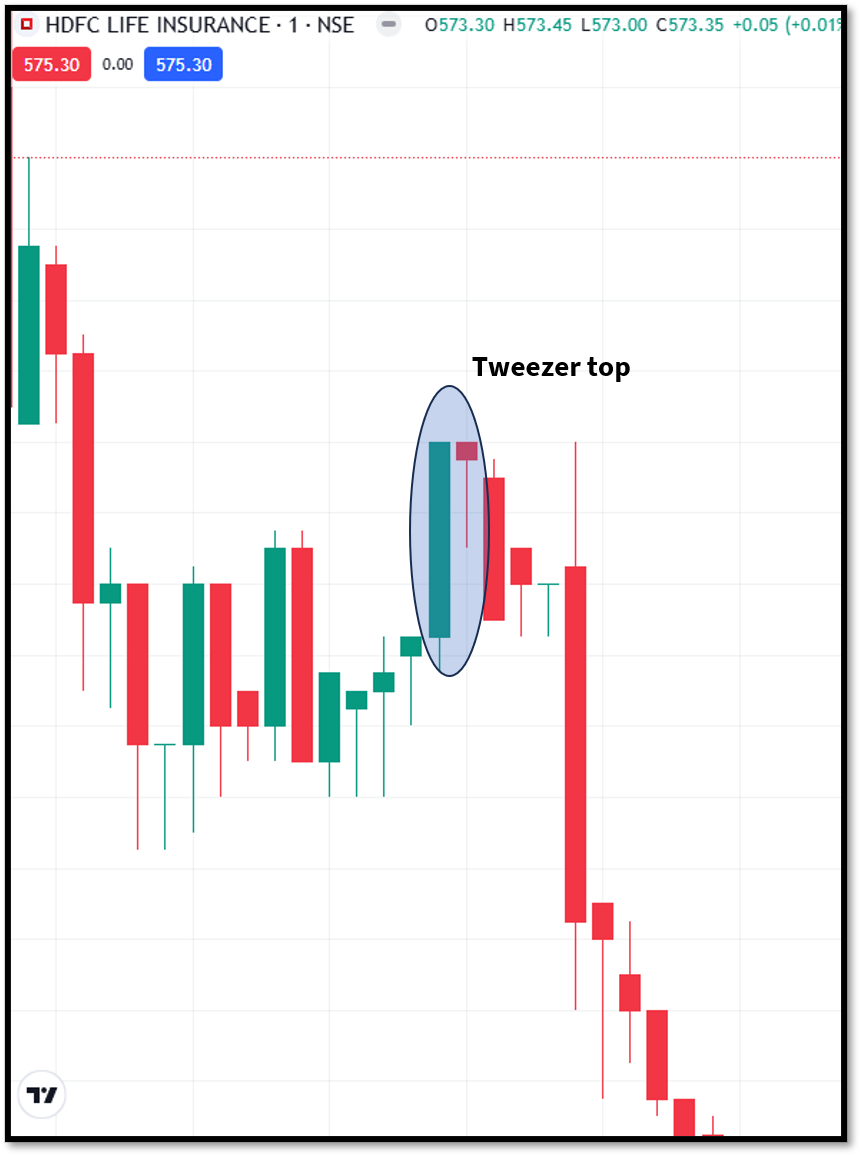
8. Tweezer Top
The tweezer top is a two-candle bearish reversal pattern. The pattern appears near the top of an uptrend. It’s when two consecutive candles reach a similar high but are unable to push higher. This shows buyers are having trouble breaking resistance, and sellers might be getting ready to take over.
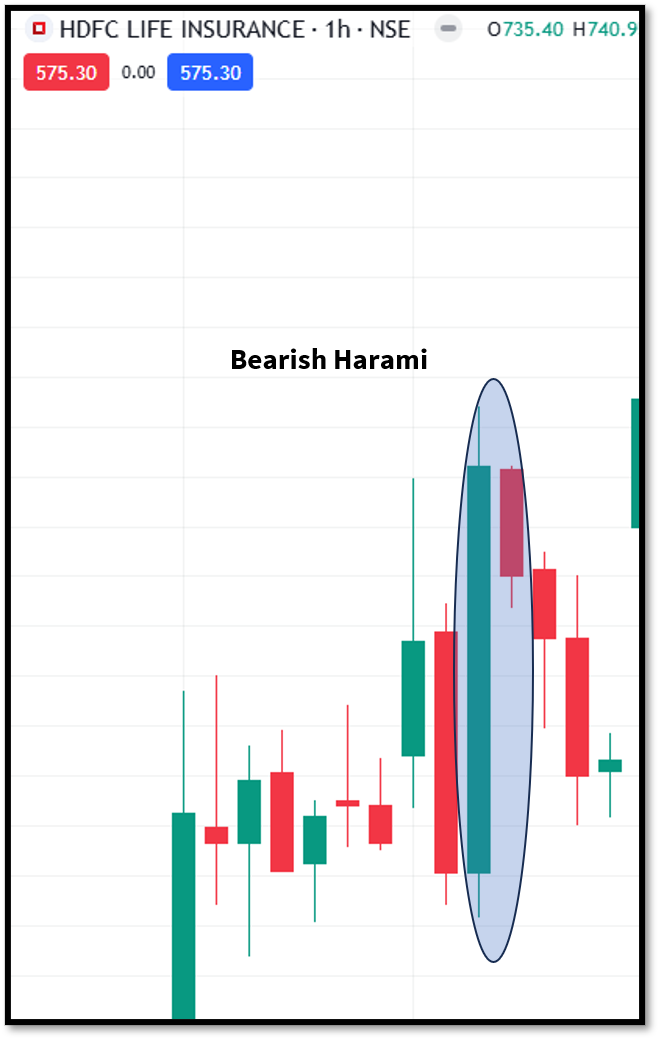
9. Bearish Harami
A bearish harami pattern forms when a large bullish candle is followed by a smaller bearish candle that closes within the body of the first candle. The pattern suggests that the bullish momentum is weakening. Traders usually watch the next candle for confirmation of a reversal.
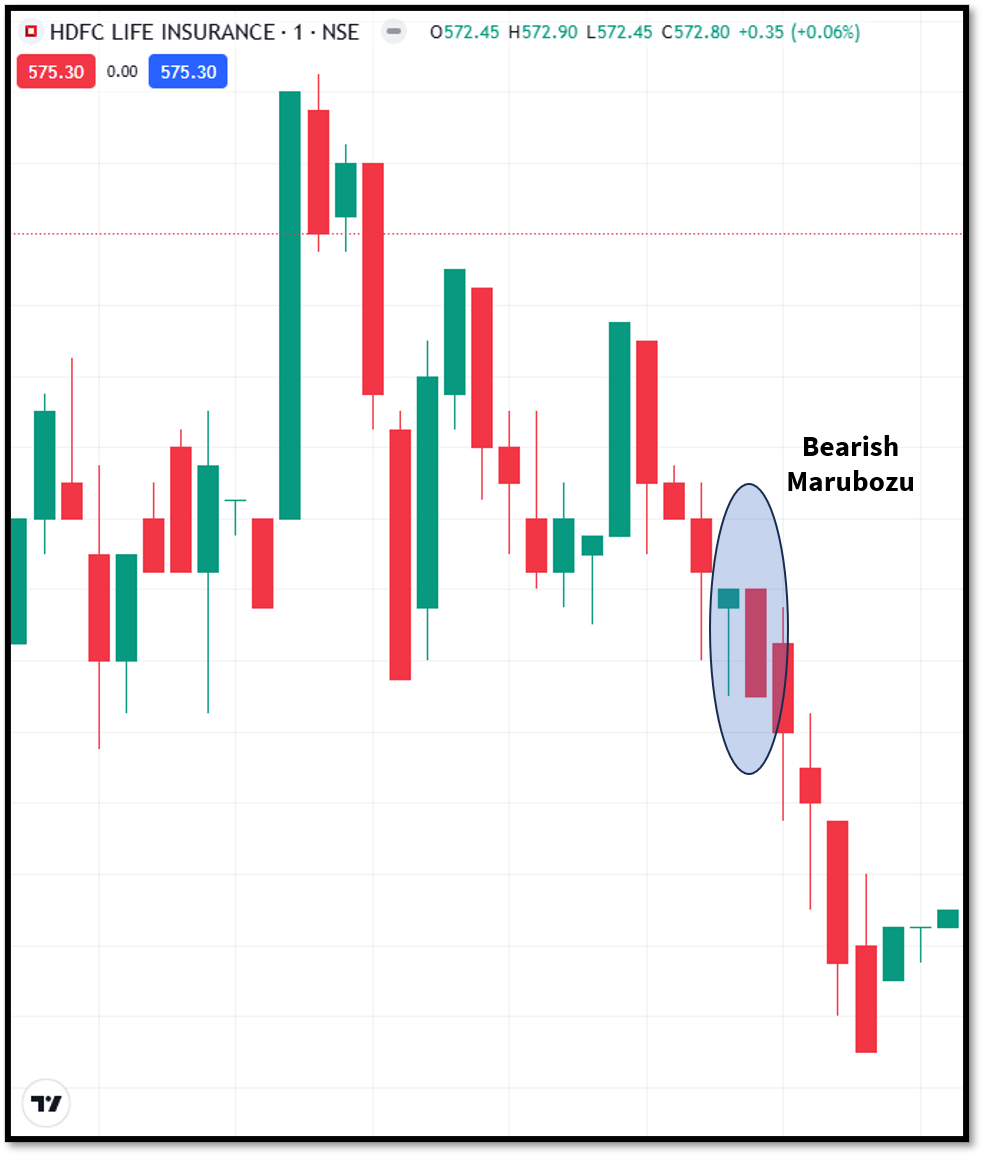
10. Bearish Marubozu
A bearish marubozu is a long bearish candle with little or no upper or lower shadow. It suggests sellers were in charge of the entire trading session, driving prices lower from the open to the close. The pattern can be seen after an uptrend, which suggests a possible reversal. If the pattern forms during a downtrend, it signals a trend continuation.
How to identify a Bearish Candle Pattern?
Bearish candle patterns are fundamental as they can provide early signs that a rising market is beginning to lose strength. These patterns provide seasoned and first-time traders with valuable insights into market sentiment, helping them make more informed trading decisions.
Consider a stock that has risen from Rs 600 to Rs 800 in a matter of weeks. At first, there is plenty of excitement and buying activity. But as the price continues to rise, some investors decide to lock in their gains. The upward move starts slowing down, and the chart begins to show signs of weakness. This is where bearish candle patterns appear, and the price may start declining.
To identify a bearish candle pattern, traders usually look for:
- A market that has been moving upward
- A bearish formation appears near the top of the trend
- Signs that the recent upward momentum is slowing
- Confirmation from the next candle or price movement
Although each pattern has its own structure, they all highlight the possibility that the current uptrend may not be as strong as it appears.
How to trade Bearish Candle Patterns?
Identifying a bearish candle pattern is only the first step. The real challenge begins when you decide how to act on it. The safest way to trade them is to stay patient and wait for the pattern to form. It is crucial to confirm the price is falling before placing a trade.
To trade a bearish candle pattern, keep these few things in mind:
Identify the upward trend
Wait till you witness the price constantly moving higher and forming a clear upward trend. A bearish candle pattern holds no value without a prior uptrend.
Spot the pattern
A bearish reversal pattern has to be identified, such as a bearish engulfing, shooting star and evening star at the peak of an upward trend.
Confirm before acting
If the next candle closes completely, it proves that sellers have completely taken over, suggesting you can now enter a trade.
Check trading volume
Witnessing higher volume on a bearish candle can validate larger institutional selling, confirming that buyers are losing interest and sellers are taking over.
Use a stop loss
A stop loss that helps you limit your losses is of utmost significance. Placing it above the recent high of the bearish pattern can help you protect your capital if the price again moves upward.
Advantages of Bearish Candle Pattern
Bearish candle patterns are popular because they provide an understanding of when the market is about to drop. Learning the advantages can help traders to prevent losses and protect their savings. Other key advantages include:
- Helps traders identify early signs when a current upward trend is losing momentum, helping them to protect profits before a major price decline occurs.
- Bearish candle patterns have distinctive and easy-to-spot structures, making it easy for beginners and experienced investors to identify them.
- The pattern functions in equities, commodities, etc., and can be applied to swing, intraday and long-term trading.
- Identifying signs of potential reversals can help traders reduce the risk threshold and safeguard profits.
Mistakes to avoid when using Bearish Candle Patterns
A bearish candle pattern is highly beneficial for traders, especially beginners, helping them to spot early signs of downward price movement. However, this pattern also has its own limitations, and traders must avoid making these mistakes:
- Avoid entering into a trade as soon as a bearish pattern appears. This can be risky. It would be optimal to wait for the next candle to completely close and confirm that sellers have taken over the market.
- The pattern is most effective after an uptrend. Trying to trade against a bullish momentum can be risky.
- Do not overlook the trading volume. A bearish candle pattern backed by high volume is often more reliable than one formed during low trading activity.
- Never enter a trade without a stop loss, as it can help traders to reduce losses if the market doesn’t move in the anticipated direction.
- Never trade a pattern in isolation. Always use tools like volume analysis and technical indicators to make informed decisions and get optimum results.
To Conclude
A bearish candle pattern is considered one of the most widely used tools for technical analysis. It helps traders to understand market sentiment and provides early signals that an uptrend may be losing strength.
Patterns like the engulfing bearish pattern, evening star, and shooting star offer varied and valuable insights into changing market behaviour. Mastering bearish candle patterns can help traders to recognise opportunities even when the selling pressure is high. Combining this pattern with other technical tools helps unlock absolute wealth-building opportunities with evidence and confidence.
FAQs
What is a bearish candle pattern?
It is a chart formation that shows that prices are likely to move downward. A bearish candle pattern represents that sellers have taken over the market from the buyers.
Which bearish candle pattern is considered the strongest?
There is no single pattern that guarantees success every time. That said, patterns like bearish engulfing, evening star and three black crows are mostly used as they often signal a potential shift in market sentiment. Many traders still look for confirmation before acting on them.
Can a beginner use a bearish candle pattern?
Yes. Most bearish candle patterns are visually easy to spot on a chart, making them a starting point for beginners learning technical analysis. However, relying on a single candlestick pattern is not recommended, especially when it is about money.
Should I immediately sell after spotting a bearish candle pattern?
No. This is like your yellow traffic signal, indicating to traders to get ready. You must not panic and instead wait for confirmation from the next candle or price movement. This helps reduce the chances of acting on a false signal.
Do bearish candle patterns work in intraday trading?
Yes, they can be used in intraday, swing and positional trading. However, their effectiveness depends on factors like market conditions, trading volume and support from other technical indicators.