



Best public & popular indicators on TradingView Charts








Key takeaways:
- In addition to the built-in charting tools, Dhan users can also access TradingView's vast library of public indicators created by its community.
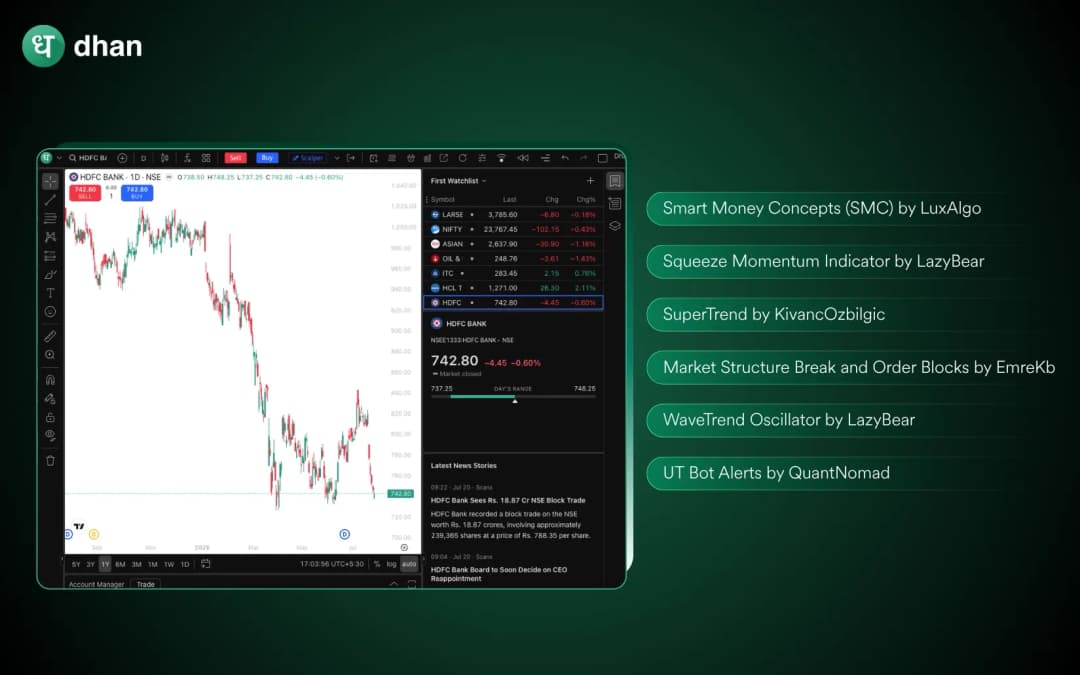
- Traders can use popular public indicators like Smart Money Concepts (SMC), Squeeze Momentum, SuperTrend, WaveTrend Oscillator, Market Structure Break and Order Blocks, and UT Bot Alerts to analyse trends, momentum, volatility, and market structure.
- Each indicator is used for a specific purpose and it is important to select the tools that are suitable for your trading style and not use a lot of indicators at once.
- Two or three complementary indicators can be used together to enhance trade analysis and minimise the risk of false signals.
- Before using an indicator in a trading strategy, it is crucial to grasp its operation and the market conditions that favour its use.
TradingView's charting capabilities are among the most powerful features that Dhan offers to its users. While built-in indicators like RSI, MACD, and Bollinger Bands are universally known, TradingView's real strength lies in the thousands of community-built public indicators available in its open library. These are scripts written and published by traders, developers, and analysts from around the world, many of which have been tested across multiple market conditions.
As a Dhan user, you have access to these TradingView charts and can apply them to your trade setup. In this blog, we will explore some of the most popular public indicators on TradingView Charts that are available to Dhan users.
Smart Money Concepts (SMC) by LuxAlgo
Smart Money Concepts is one of the most popular public indicators on TradingView. It is based on the concept that institutional players, sometimes referred to as smart money, leave visible footprints on the chart through their buying and selling behaviour. This indicator will automatically plot key elements such as order blocks, breaker blocks, fair value gaps, and liquidity sweeps directly on your chart.
SMC is often used by traders seeking a structured view of how institutions' movements influence the market. It is popular among swing traders and those who analyse price action around key structural zones. When traders identify a change in character around an order block on their charts it often provides them with valuable context before they decide to enter or exit a trade.
Squeeze Momentum Indicator by LazyBear
The Squeeze Momentum is a momentum-focused indicator that combines the Bollinger Bands and Keltner Channels. When the Bollinger Bands contract within the Keltner Channels, the indicator signals a market squeeze, implying that volatility has been compressed and a breakout could be imminent. After the squeeze fires, it reveals whether the momentum is gaining bullishly or bearishly.
This indicator is especially helpful for positional traders and those seeking consolidation breakouts. Traders who trade trending indices or midcap stocks on Dhan often use this indicator on their charts to anticipate directional moves early.
SuperTrend by KivancOzbilgic
One of the simplest trend-following indicators in the market is SuperTrend. It plots a trailing stop line above or below the price based on the ATR (Average True Range), which turns green when the price is in an uptrend and red when it is in a downtrend, with no complicated interpretation required. For intraday traders on Dhan, SuperTrend works well on 15-minute and hourly charts, helping them stay aligned with the broader directional bias throughout the trading session.
Rather than using it as a direct entry signal, many traders use it to decide whether to search for buying or selling opportunities. Because of its visual simplicity, it is a suitable starting point for beginner traders exploring trend-following setups.
Market Structure Break and Order Blocks by EmreKb
This indicator by EmreKb is similar to the SMC by LuxAlgo but with a more limited scope. It highlights moments when price has exceeded a previous swing high or low, indicating a potential change in market structure. Once the structure break is confirmed, it analyses the immediate preceding price action and marks the origin candles of those moves as order blocks.
For traders who use ICT or SMC methodologies on TradingView, this indicator provides automated visual cues that would otherwise require manual chart analysis. It is especially suited to traders who study market structure as the foundation of their entries and exits.
WaveTrend Oscillator by LazyBear
The WaveTrend Oscillator is another indicator from LazyBear and is a momentum indicator that can be used to identify overbought and oversold markets as well as divergence opportunities. WaveTrend, unlike a standard RSI, employs channel-based smoothing to filter out market noise and produce cleaner, more reliable signals.
This indicator is often used by traders seeking reversal setups and those who study momentum divergence. It is especially effective when used with a trend-confirming indicator such as SuperTrend, thus providing traders with both direction and timing context on the same chart.
UT Bot Alerts by QuantNomad
The UT Bot Alerts is an ATR-based trailing stop indicator that uses a momentum filter to give buy and sell signals on the chart. When the price crosses above the trailing stop, it indicates a buy signal, and when it crosses below, it indicates a sell signal. It is also popular among traders who want to have combined trend direction and entry signals.
UT Bot indicator is often used as a trigger layer by traders who prefer rule-based setups. However, like all public indicators, it works best when validated against other indicators on charts rather than being treated as a standalone indicator, as it is likely to give false signals or whipsaws in consolidating markets.
How to use public indicators responsibly?
Before using public indicators, traders should take time to understand the rationale behind them, what market behaviour they are meant to identify, under what circumstances they work best, and in what circumstances they fail. The above indicators are truly potent tools; however, there is a significant caveat. No indicator can give 100% accurate signals every time.
Therefore, traders should use public indicators as confirmation layers rather than standalone trade signals. The goal should not be to find a single indicator that does everything; rather, to build a layered analysis framework with 2-3 indicators where each indicator serves a specific purpose.
Wrap up
The Dhan users have access to some of the most advanced community-built indicators in the world through the public library of TradingView. The above-mentioned public indicators can be utilised to analyse institutional footprints, track momentum squeezes before a breakout, or map structural shifts with order block indicators, thus enabling traders to significantly enhance their chart analysis.
The key to using public indicators effectively is to treat each indicator as a confirmation tool rather than a 100% accurate prediction. When used thoughtfully alongside Dhan's powerful charting environment, these public indicators can help traders build confident trade setups in the Indian stock market.







