



Diamond Top Pattern







Key takeaways
- The Diamond Top pattern is a bearish reversal chart pattern which appears after a strong uptrend.
- It signifies that buying momentum is decreasing, and sellers are slowly taking control.
- The pattern is confirmed when the price falls below the lower boundary of the diamond shape.
- The combination of trading volume and technical indicators can strengthen the breakout and reduce false signals.
- As with any chart pattern, traders should use proper risk management strategies and not rely entirely on them when making investment decisions.
Identifying a potential trend reversal is one of the main goals of technical analysis. Although no chart formation can give absolute information about future price movements, various formations provide insightful information about the shifts in investor’s mood and the possible changes in trend direction.
The Diamond Top Pattern is one such technical formation. The pattern occurs after a strong upward move and indicates that bullish momentum may be losing its strength. By understanding how the pattern forms and how to trade with this pattern effectively, traders can make more informed trading decisions and manage their risk effectively.
What is the Diamond Top Pattern?
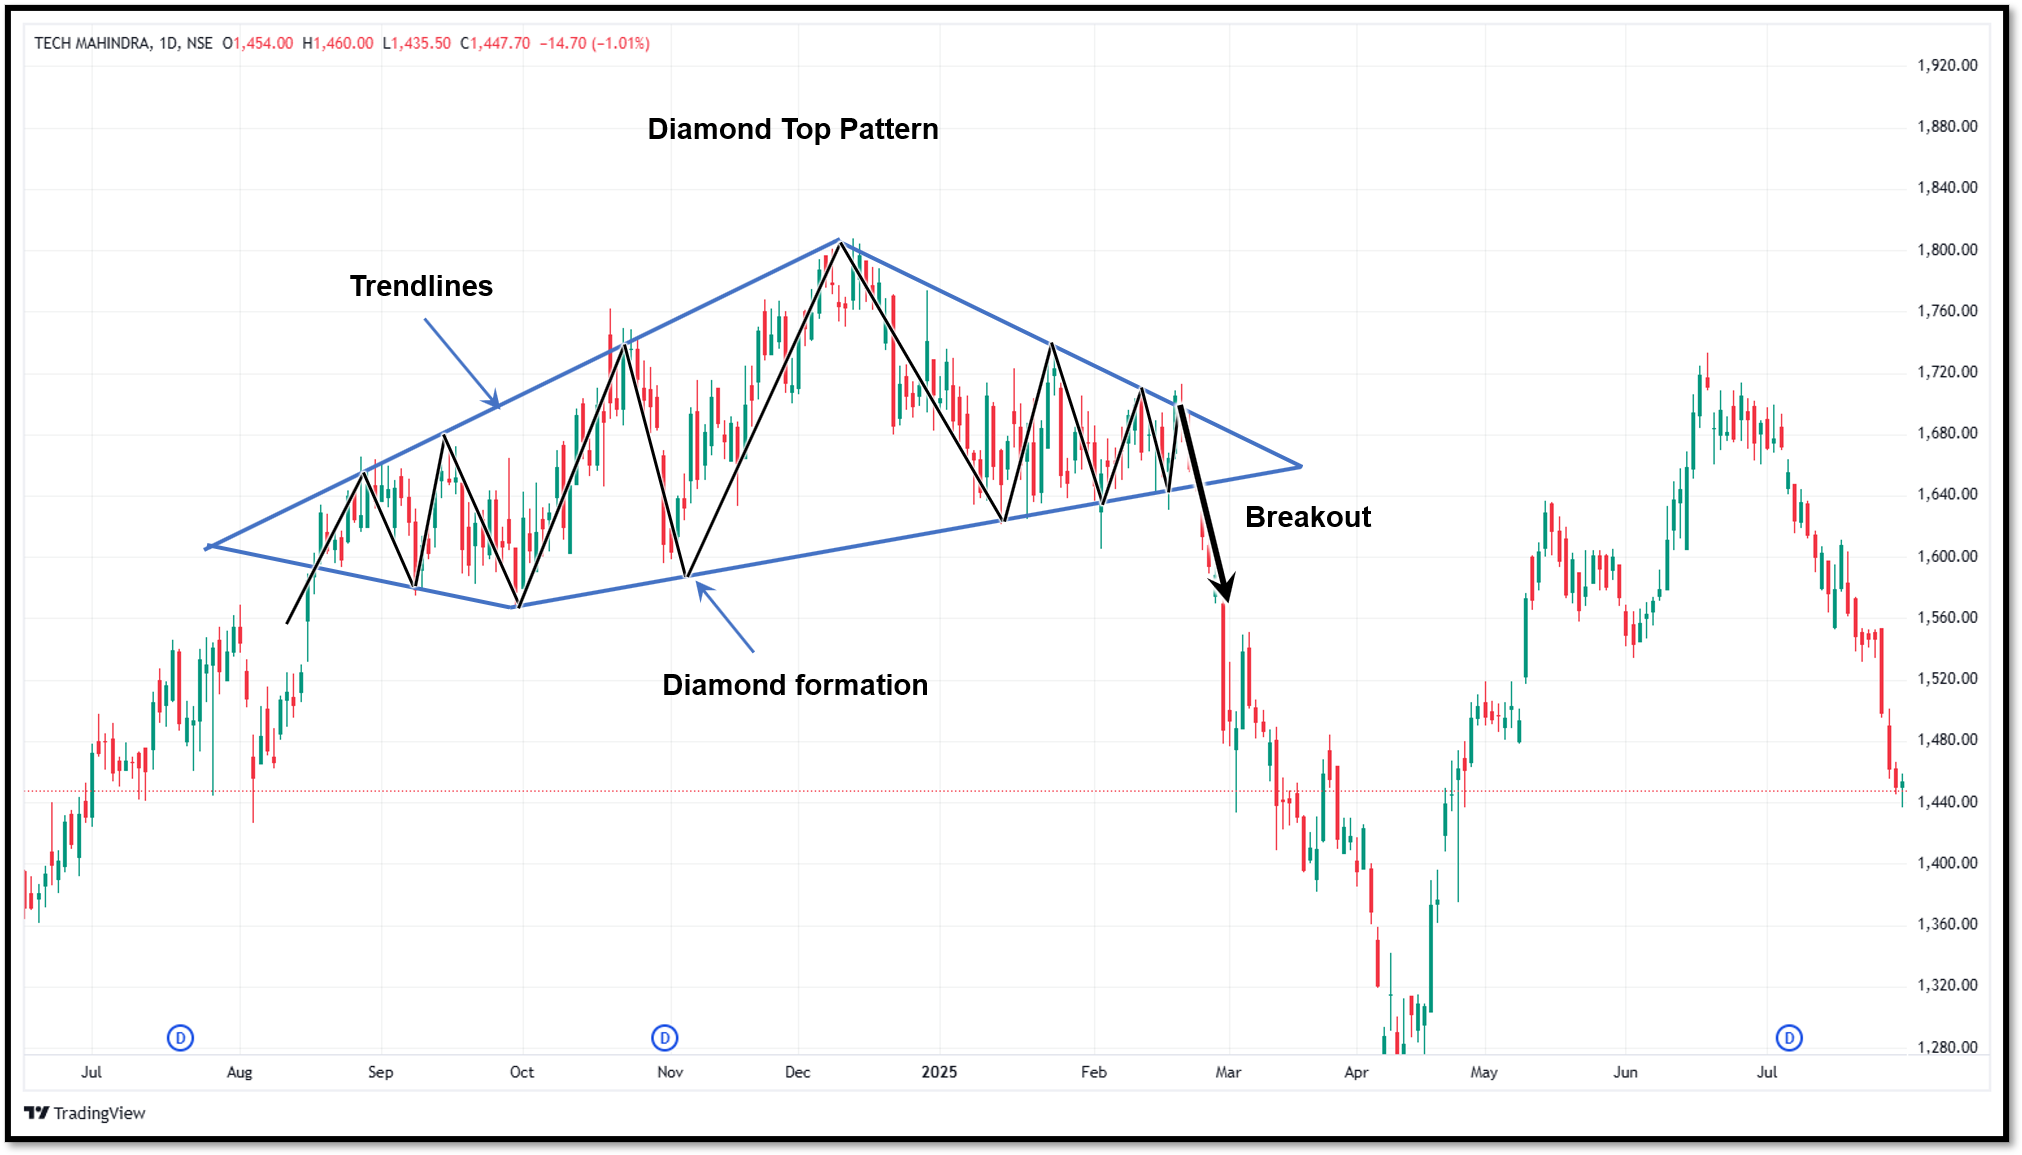
A diamond top pattern is a bearish reversal formation that forms at the end of a strong upward trend. The name diamond comes from its appearance. When you connect the high and low points on a price chart using trendlines, the price movement first expands outwards, creating a broadening top and then shrinks back inwards like a symmetrical triangle. Combining these two sections resembles a diamond.
The pattern shows a change in market sentiment. During the first half, buyers drive prices to new highs, but each attempted bounce is met with intense selling pressure, resulting in wide, choppy swings. This battle between bulls and bears indicates increasing uncertainty about direction. In the second half, the price swings decrease as fewer traders follow the upward trend. With momentum fading, a break below the pattern's support line occurs, which confirms that sellers have taken charge and signals the start of a downtrend.
Structure of Diamond Top Pattern
- Diverging and converging trendlines - There are four trendlines on the price chart, with two trendlines diverging and being followed by two other trendlines that are converging, indicating an uptrend.
- Upper trendline – It is formed by connecting a series of higher highs, while another line is drawn by connecting a series of lower highs, which acts as a strong resistance line.
- Lower trendline - It is formed by drawing a line connecting a series of lower lows and another line by connecting the series of higher lows that acts as strong support.
- Breakdown candle - As the bearish candle closes below the support line of the pattern, it indicates a breakdown of the pattern.
How to identify the Diamond Top Pattern
Identifying a genuine diamond top pattern requires some experience, as real charts are far from the charts found in textbooks. Here's what to look for:
Established uptrend
The pattern should form after a strong and sustained increase in prices. Without a well-established prior uptrend, the setup is not a genuine diamond top.
Expansion phase
Initially, there should be larger moves in both directions, with higher highs and lower lows for a few weeks creating a widening structure on the left side of the formation.
Contraction phase
Then, the swings will begin to contract, with lower highs and higher lows forming the right side of the diamond.
Four trendlines
There should be two upper and two lower trendlines that are joined together to form the outline of the diamond. The rough symmetry between the two halves adds credibility.
Volume behaviour
Trading volumes generally decline as the formation develops, reflecting increasing indecision in the market.
How to trade the Diamond Top Pattern
Once you know how to identify the pattern, here's a practical framework for trading it:
Entry
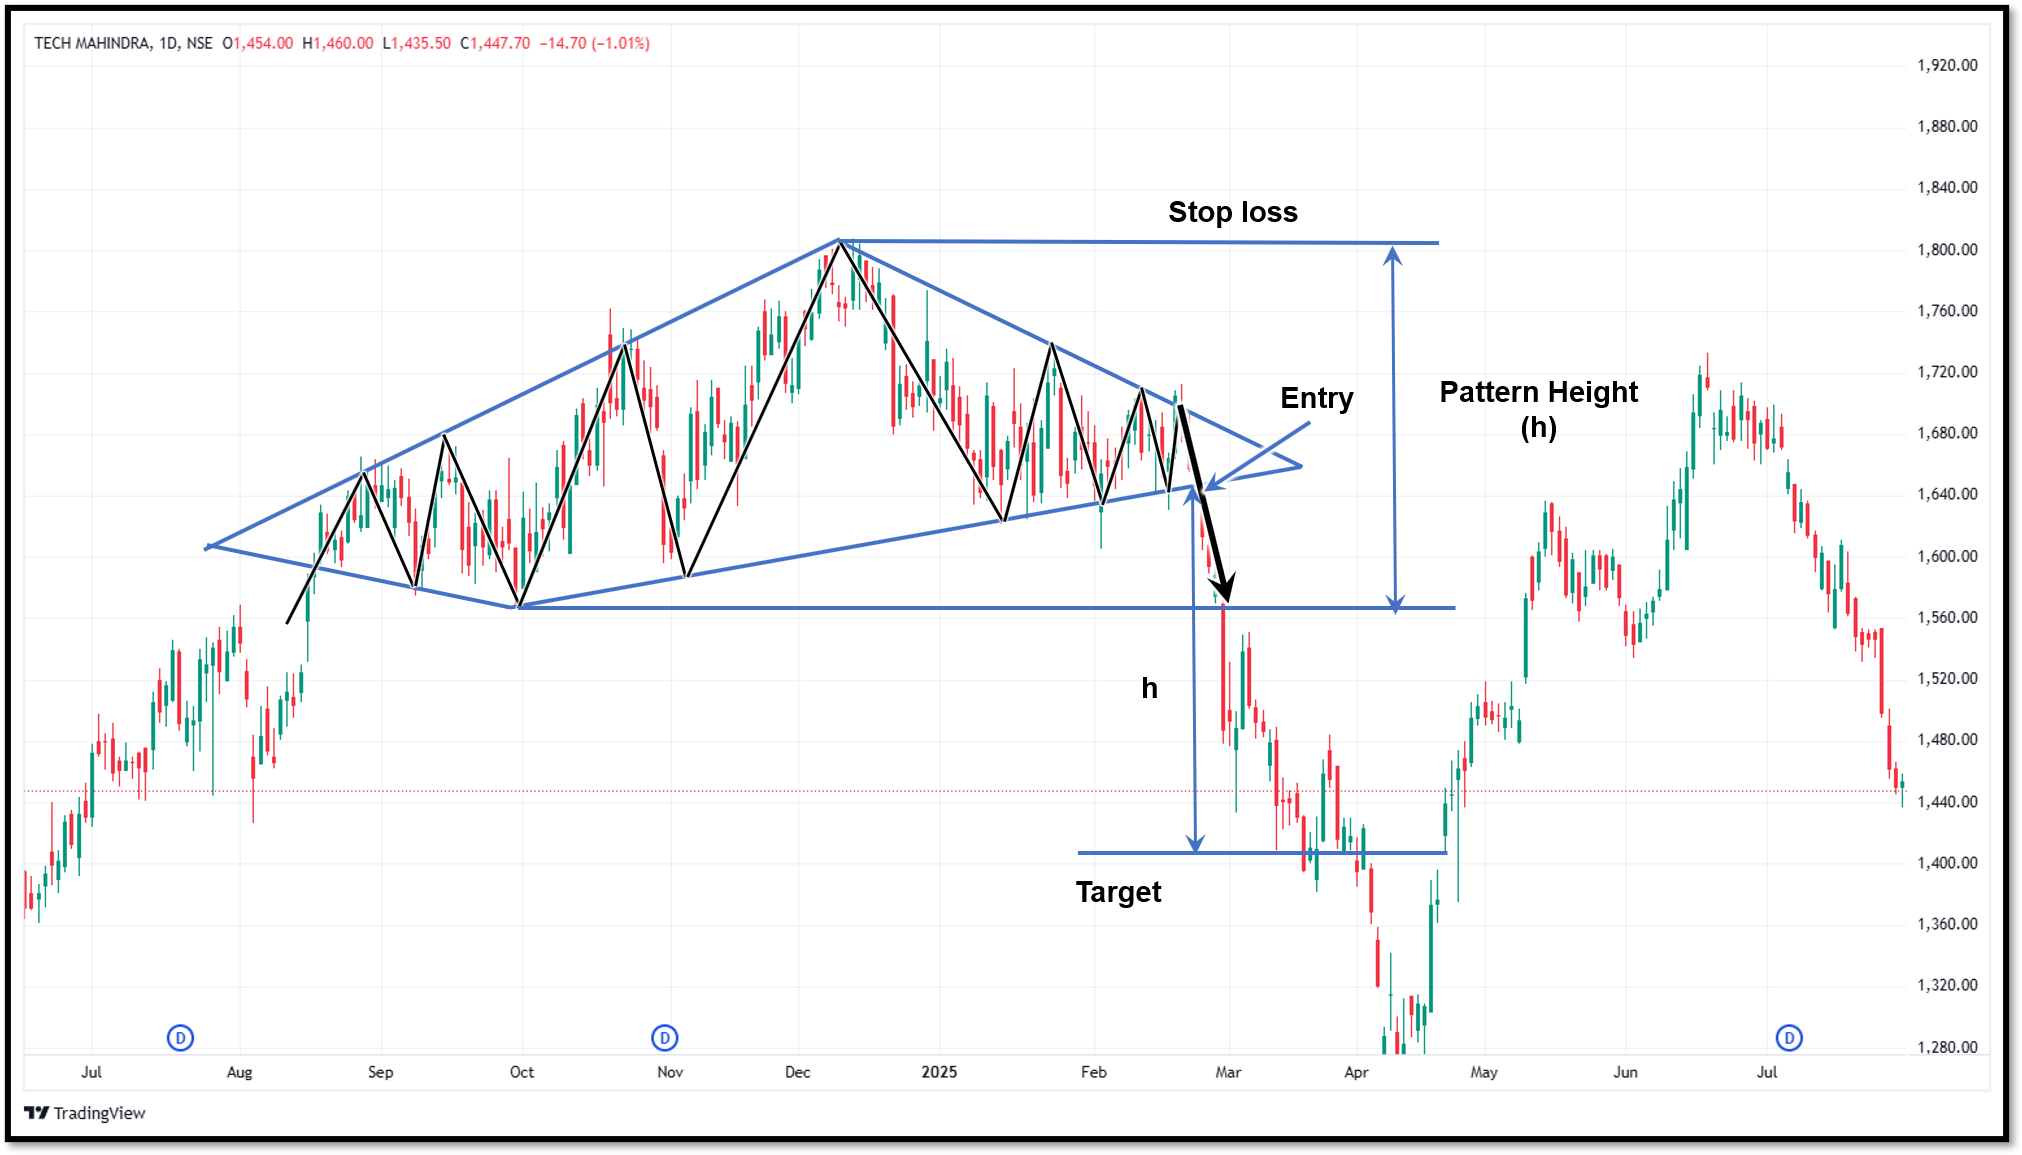
Enter a short position when the price closes below the lower trendline with supporting volume. Do not enter too early on a small drop; wait for a confirmed close.
Stop-loss
Position your stop-loss above the highest point of the diamond, also referred to as the apex. Many traders prefer to set a more restricted stop right above the recent swing high for an enhanced risk-reward ratio.
Target
Measure the vertical height of the diamond from its highest point to its lowest point, then project this distance downwards from the breakout point. This will give you an estimated minimum target price for when the breakout occurs.
Position sizing
False breakdowns can happen frequently, so it may be good not to put your full capital in one trade. Instead, scale into the trade gradually, making small entries rather than one large. Increase your position size as the price moves in your favour after the breakdown.
Time-based exit
If the price has not touched the stop-loss or target after a number of sessions, consider closing the trade. Patterns that stall for too long usually lose their effectiveness.
Advantages of the Diamond Top pattern
Some advantages of the diamond top pattern are:
- Gives an early warning that a strong uptrend is losing strength, usually before other indicators start to notice.
- Comes with a built-in method for establishing price targets and stop-losses; therefore, risk management becomes simpler.
- Due to its rarity, when it appears clearly, it attracts more attention and leads to a stronger, more decisive movement.
- Gives both a sell signal for existing long positions and a buy signal for new short positions. So, it serves two functions at once.
- It can be applied across various time frames, making it suitable for both swing traders and longer-term position traders.
- It works well with volume and momentum indicators, providing sufficient information to act upon. There is always a second layer of confirmation available.
Limitations of the Diamond Top pattern
Some limitations of Diamond Top Pattern are:
- As the diamond top pattern rarely appears, traders may have to be patient, waiting for authentic setups that are worth acting on.
- Fake breakouts can occur, especially when the market is highly volatile.
- The pattern demands patience and significant analysis time, as it may take weeks or even months to fully develop.
- Compared with daily or weekly charts, the pattern is less trustworthy on lower time frames; it can be affected by noise and may not work well with shorter trades.
- While the formation is still in progress, it can be difficult to distinguish between a genuine diamond and other patterns like a broadening top, triangle, or a head-and-shoulders pattern.
- After confirming the breakdown, the pattern does not give much information on the duration of the resulting downtrend.
Common mistakes with the pattern
Avoiding these common mistakes can improve the reliability of your trades.
- Getting confused with other formations such as head and shoulder patterns, broadening tops or triangles, all of which appear similar during initial stages
- Entering a short position before price has closed below the lower trendline on the basis of speculation that a breakdown will occur.
- Trading the pattern without ensuring that it forms after a genuine and well-established uptrend.
- Setting the stop loss too close to the entry point increases the chances of being stopped out due to normal market movements.
- Ignoring broader market or industry trends and trading the pattern alone, even when the wider backdrop indicates no sign of trend reversal.
- Risking a large portion of capital on a single diamond top pattern trade because the pattern is rare and despite the fact that not all formations will produce the expected result.
The final verdict
The diamond top formation won't appear on your charts every week, but when it does, it gives a reliable indication that an uptrend is coming to an end. The key is to be patient, wait for the complete pattern to form, confirm the breakdown with volume, and manage risk by setting stop-loss and target levels. View it as one of several indicators rather than a stand-alone signal, and it can become a valuable addition to your trading toolkit.
FAQs
Is a diamond top pattern always bearish?
Yes. When it forms after an uptrend, the figure is known as a bearish reversal pattern. When the same diamond pattern forms after a downtrend, it is known as a diamond bottom, which is bullish in nature.
How long does a diamond top pattern usually take to form?
The time required for the formation of diamonds can vary but typically takes several weeks to months to complete, allowing enough space for the formation of both the expansion and contraction phases, resulting in clear price movements.
Which markets display the diamond top formation most frequently?
The diamond top formation can be seen in stocks, forex, commodities and cryptocurrencies, although they are relatively rare compared to formations such as triangles or double tops.
Is the diamond top pattern more reliable on certain timeframes?
Yes. The pattern is more reliable on daily or weekly charts, as shorter time frames create more noise and can lead to false breakdowns.
Is it possible for the diamond top pattern to fail?
Yes, it can fail. Sometimes the price falls below the support level and then quickly reverses back above the diamond pattern. This is known as a bust. To avoid being caught in a bust, it is important to wait for confirmation of the pattern before entering a trade.







