



Neutral Candlestick Patterns








Key takeaways
- Neutral candlestick patterns are those that show market indecision; that is, neither buyers nor sellers are clearly in control of the market.
- The patterns do not directly signal buy or sell, but they help traders to identify potential trend reversals, continuations, or consolidation phases when combined with market context.
- Neutral candlestick patterns are most effective when analysed alongside support and resistance levels, trading volume, trend direction, and technical indicators rather than in isolation.
Candlestick charts are among the most widely used tools in technical analysis because they provide a visual representation of price movement and market sentiment. While many traders focus on bullish and bearish candlestick patterns, neutral candlestick patterns are equally important because they reveal moments when the market lacks a clear direction.
A neutral candlestick suggests that buyers and sellers are evenly matched and no one has gained superiority during the trading session. During the formation of the pattern, the prices may fluctuate, but they do not establish a clear trend.
These periods of indecision usually appear before important breakouts, trend reversals, or continuation moves, which can produce an opportunity for a trader. Hence, understanding how to interpret neutral candlestick patterns can help traders avoid making impulsive decisions and wait for stronger confirmation before entering a trade.
What are Neutral Candlestick Patterns?
Neutral candlestick patterns are candlestick formations that reflect indecision or temporary balance between buyers and sellers. Bullish patterns suggest buyers are more active, or bearish patterns suggest that selling pressure is higher, but neutral patterns simply show that neither side was able to dominate the market during the trading session.
These patterns form during trend pauses, before potential reversals, near important support or resistance levels, during periods of market consolidation, or ahead of major news events.
The Neutral pattern signals uncertainty rather than direction; hence, traders generally wait for additional confirmation before making trading decisions.
Market psychology behind Neutral Candlestick Patterns
Every candlestick reflects the interaction between buyers and sellers. Bullish candles signal that the buyers are driving the market while bearish candles show that sellers are in control of the session. But neutral candlesticks represent that no one is in control.
Throughout the trading period, prices may rise sharply, fall significantly, or fluctuate in both directions. However, by the close, buyers and sellers reach a temporary balance.
Common Neutral Candlestick Patterns
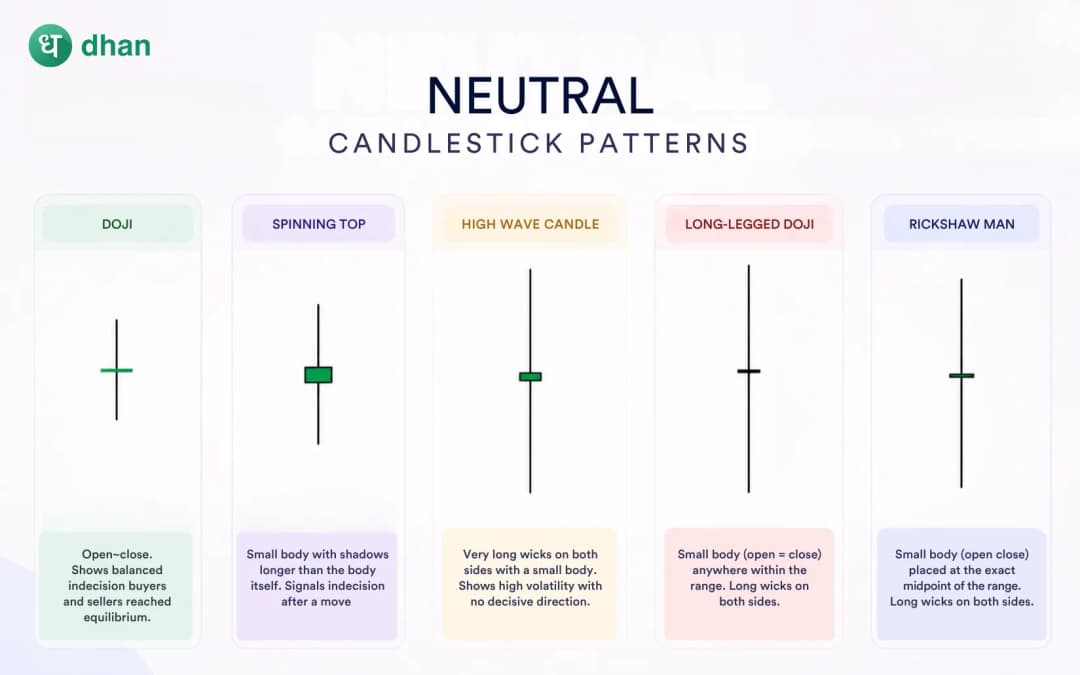
Several candlestick formations fall into the neutral category. Although they share the common theme of indecision, each has unique characteristics.
Doji
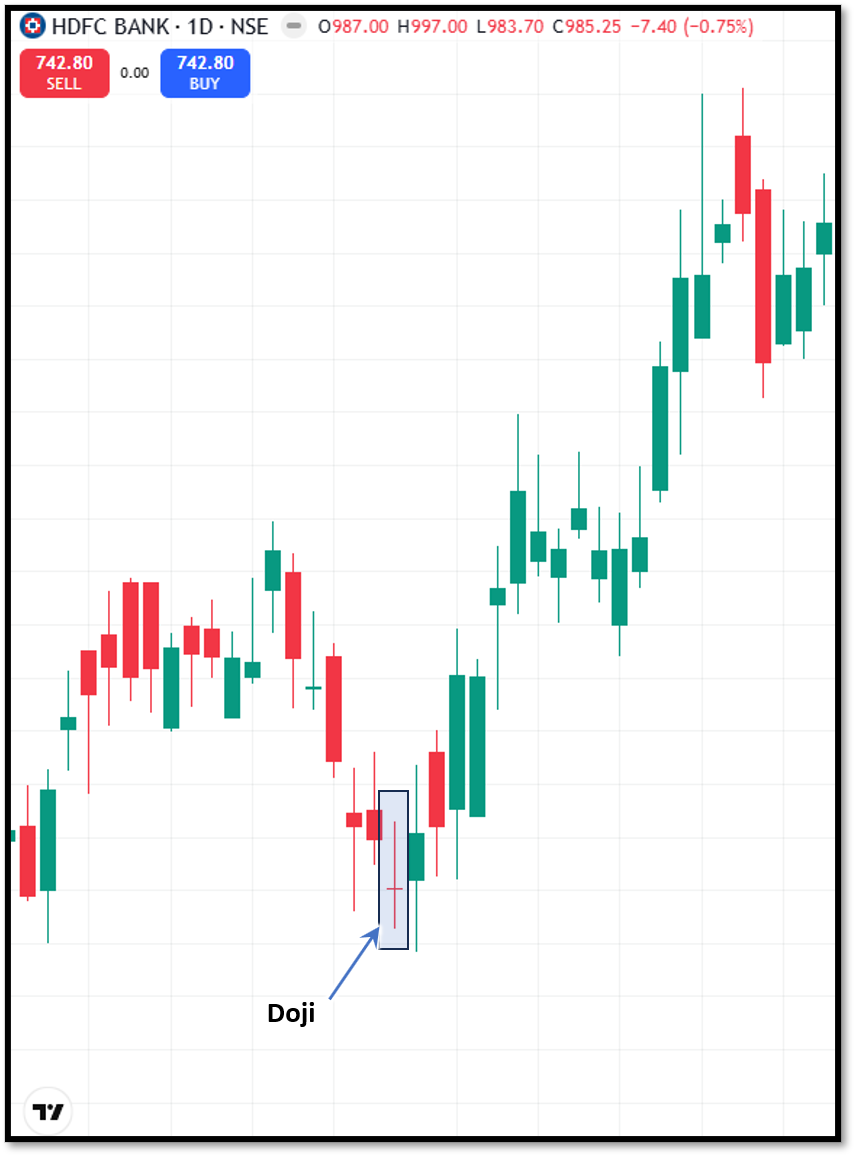
The Doji is one of the best-known neutral candlestick patterns. It forms when the opening and closing prices are nearly identical. Depending on intraday price movement, the candle may have long or short shadows.
The Doji indicates that buyers and sellers cancelled each other out during the session. When it appears after a strong trend, traders often watch for confirmation of a possible reversal.
Spinning top
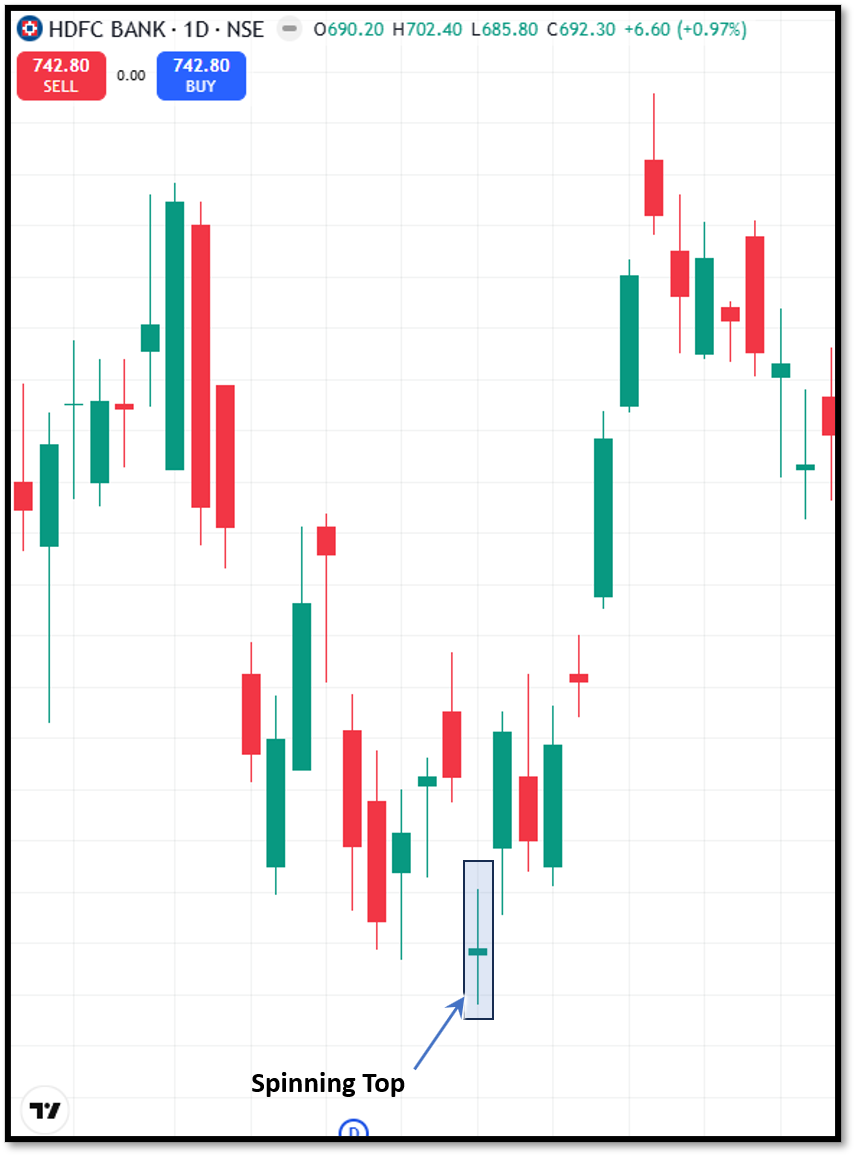
A spinning top has a small real body with upper and lower shadows. Unlike the Doji, the opening and closing prices are close but not identical.
The pattern shows that prices moved in both directions before closing near the opening level. It symbolises indecision and often occurs before continuation or a reversal of a price trend, depending on the violation.
High wave candle
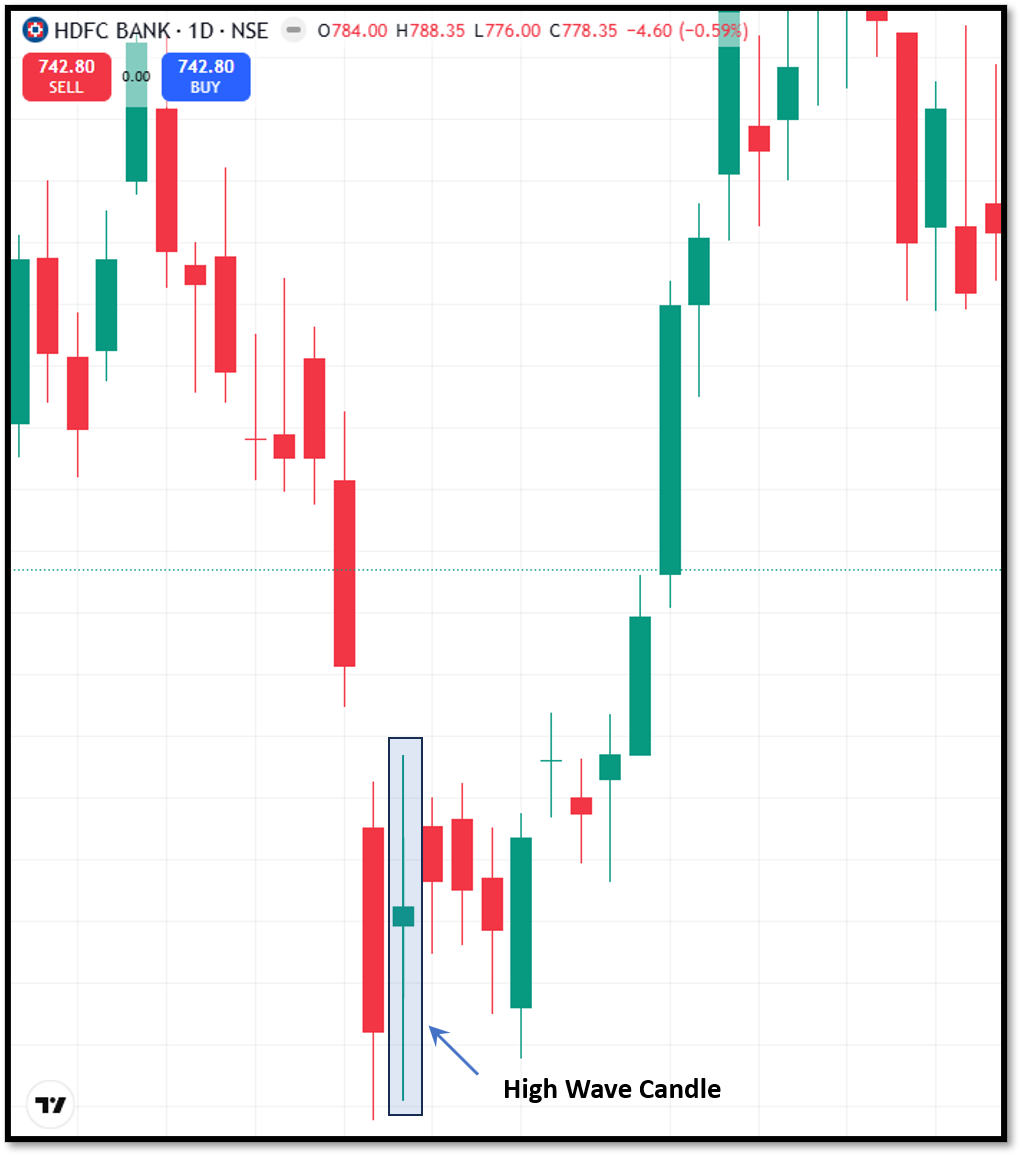
The high wave candle resembles a spinning top but features much longer upper and lower shadows. Its long wicks indicate unusually high intraday volatility.
Although buyers and sellers both made aggressive attempts to control prices, neither side maintained its advantage by the close. This pattern frequently appears during periods of increased market uncertainty.
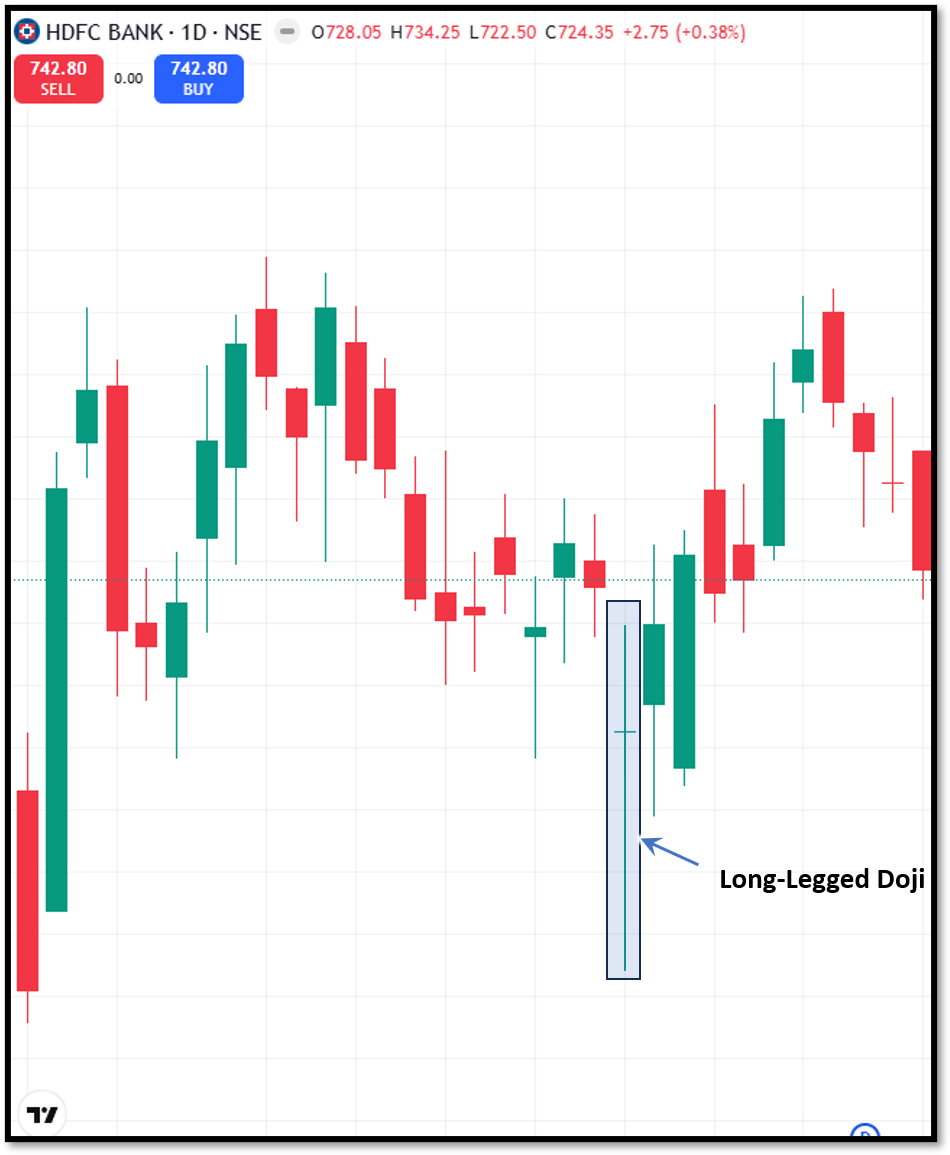
Long-legged Doji
The long-legged Doji is a variation of the standard Doji with exceptionally long upper and lower shadows. It signals intense price fluctuations during the session.
The candle suggests that both buyers and sellers were highly active but ultimately failed to establish a lasting trend. Because of this strong indecision, traders often wait for the following candle before making trading decisions.
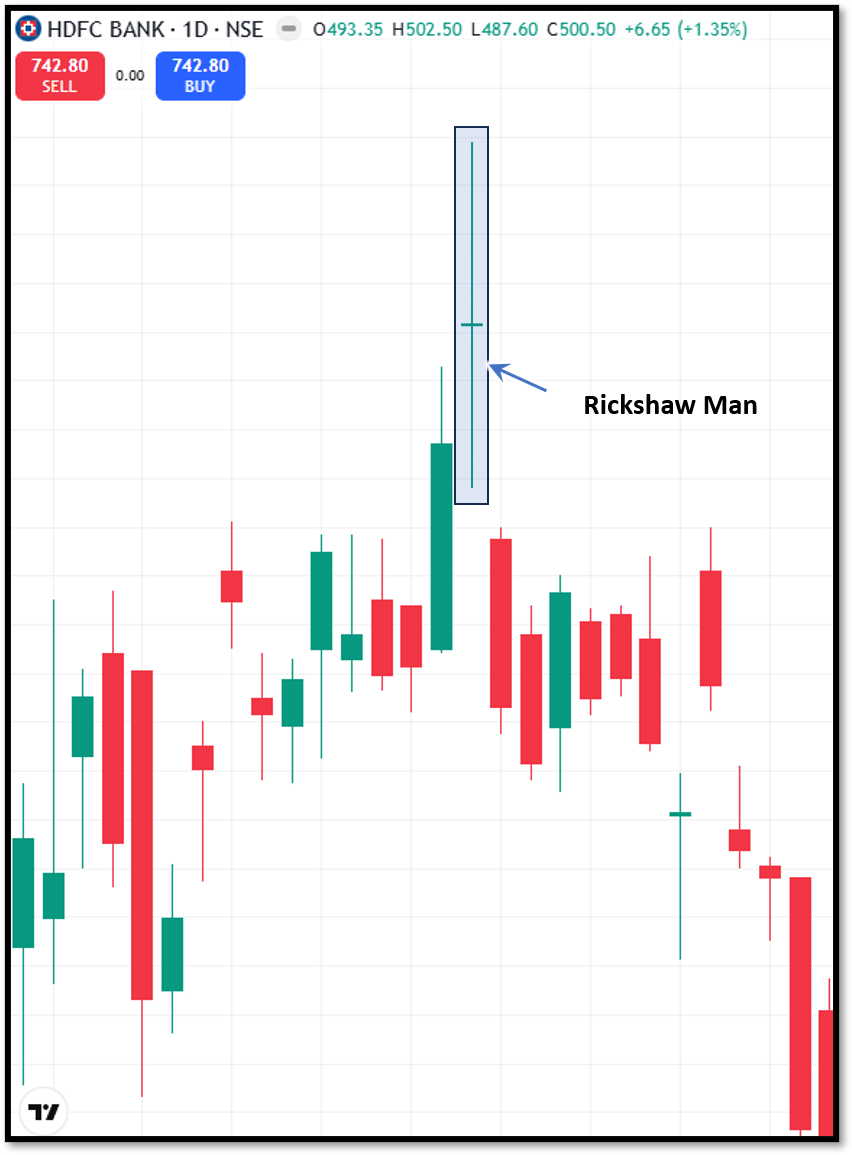
Rickshaw Man
The Rickshaw Man is another type of Doji that has long upper and lower shadows with the opening and closing prices positioned near the middle of the trading range.
Its balanced appearance reflects an evenly matched struggle between buyers and sellers.
Like other neutral patterns, it becomes more meaningful when it forms after a prolonged trend or near key support and resistance levels.
Where do Neutral Candlestick Patterns usually appear?
Neutral candlestick patterns can develop in almost any market condition, but they often become more meaningful in specific situations.
After a strong uptrend
A neutral pattern following a significant rally may indicate that buying momentum is weakening. Although it does not automatically signal a reversal, it acts as a warning for traders.
After a prolonged downtrend
When neutral patterns appear after a steady downfall, they may suggest that sellers are losing momentum and there is a possibility of a reversal if buyers enter the trade during the next sessions.
Near support and resistance
Support and resistance levels usually have increased buying and selling activity. As a result, neutral candlestick patterns frequently develop around these price zones while the market decides whether to break through or reverse.
Cconsolidation
Periods of sideways movement usually produce multiple neutral candlesticks as buyers and sellers wait for new information before establishing a fresh trend.
Neutral Candlestick Patterns vs reversal patterns
Neutral candlestick patterns are usually confused with reversal patterns because both can appear near turning points. The following table highlights the difference between neutral and reversal patterns.
To wrap up
Neutral candlestick patterns play an important role in technical analysis because they reveal periods when buyers and sellers are evenly matched. Instead of giving traders instant trading signals, they advise them to stop, evaluate the state of the market, and wait for confirmation before acting.
These patterns can highlight changing market sentiment when they appear after strong trends or near important support and resistance levels.
FAQs
What are neutral candlestick patterns?
Neutral candlestick patterns are candlestick formations that show a sign of indecision in the market where the buyers and sellers are evenly matched during the trading session.
Are neutral candlestick patterns bullish or bearish?
The neutral candlestick patterns are neither bullish nor bearish. As they represents a confused state of the market, the direction can not be anticipated.
Can beginners use neutral candlestick patterns?
Yes. Most neutral patterns are visually easy to identify, making them suitable for traders who are learning candlestick analysis.
Which indicators work well with neutral candlestick patterns?
RSI, MACD, moving averages, Bollinger Bands, volume analysis, and support and resistance levels are commonly used alongside neutral candlestick patterns.
Why is confirmation important when trading neutral candlestick patterns?
Because neutral patterns indicate uncertainty rather than direction. A confirmation here helps determine whether the market is likely to continue the existing trend or reverse.







