



Stalled Candlestick Pattern







Key takeaways
- The stalled candlestick pattern is a bearish reversal pattern that indicates buying momentum may be weakening after a long uptrend.
- The pattern consists of three bullish candles with the third candle having a smaller real body, indicating hesitation by buyers.
- Always wait for bearish confirmation, such as a lower-closing candle or increased selling pressure, before making trading decisions.
- The pattern works best when it comes near resistance levels, after a long rally or when it is accompanied by other technical indicators.
Markets don’t often turn around without a signal. An uptrend can begin to lose momentum even when prices continue higher. Another such signal is the stalled candlestick pattern, which is a bearish reversal pattern that is formed by three candles and indicates that buyers may be losing momentum and sellers may be about to take over.
No candlestick pattern can assure a trend reversal, but recognising early signs of weakening buying pressure can help traders make better decisions. The stalled candlestick pattern is most effective when viewed together with the prevailing market trend, support and resistance levels, trading volume and technical indicators.
In this article, you’ll learn what the stalled candlestick pattern is, how it is formed, what it means, and how you can identify and trade it more effectively.
What is the Stalled Candlestick Pattern?
The stalled candlestick pattern, also known as the deliberation pattern, is a bearish reversal candlestick pattern that forms after a long uptrend. It is three bullish candles in a row, but the last one shows that the buying momentum is starting to weaken.
The third candle in a stalled pattern, compared to strong bullish continuation patterns, has a relatively small real body and opens near the close of the previous candle. Buyers succeed in moving prices a little higher, but have difficulty sustaining the same momentum as the early part of the uptrend.
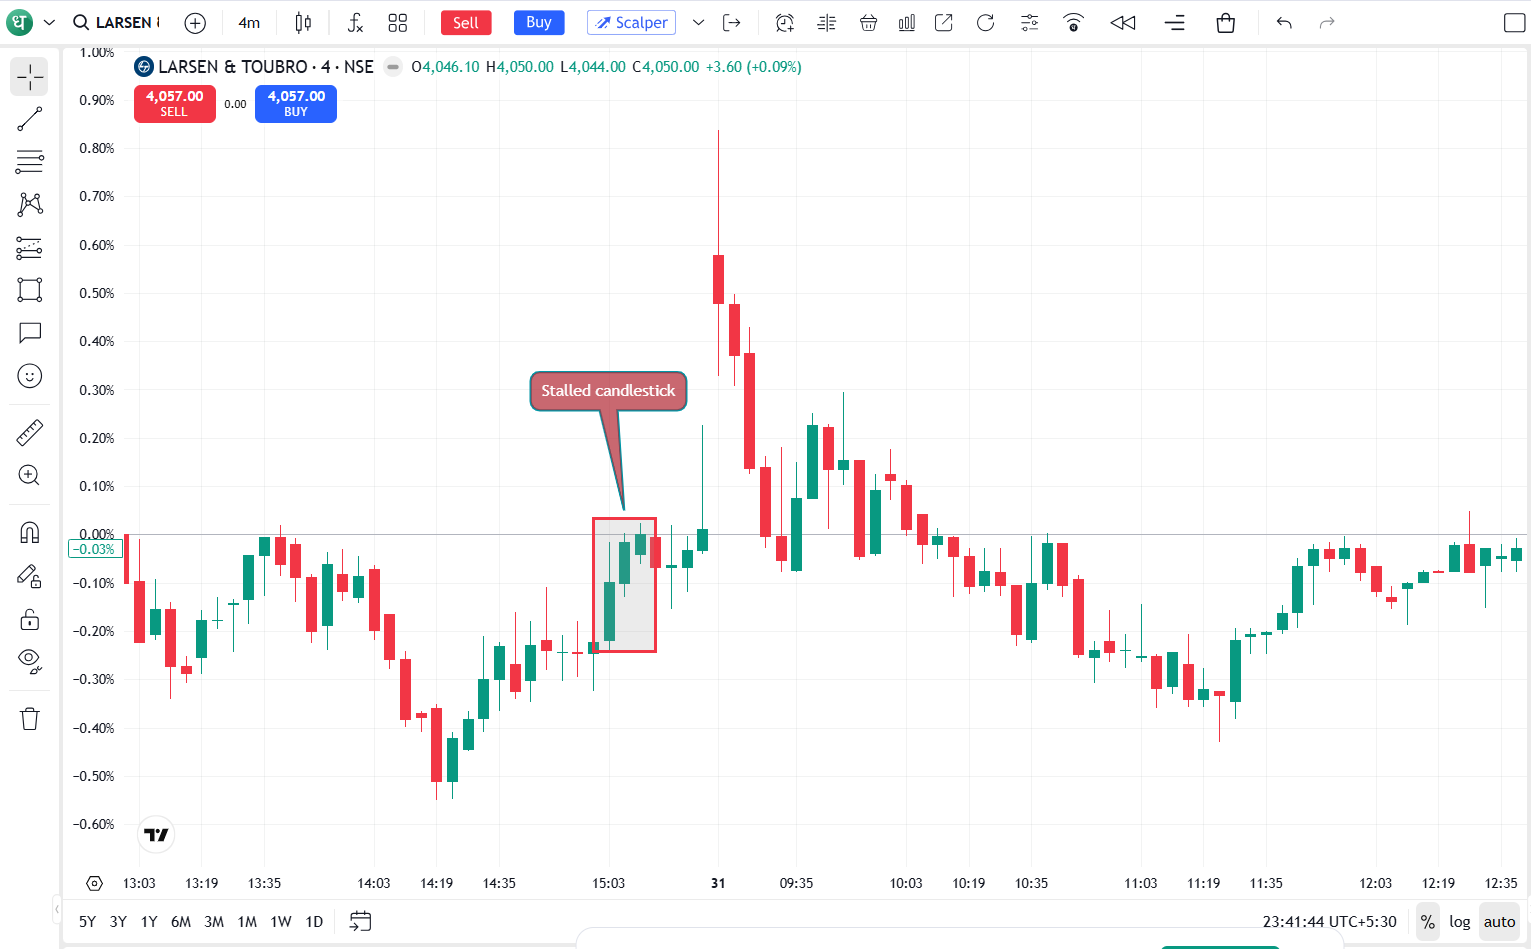
This pause typically means that the buyers are losing momentum and that sellers are slowly entering the market. Traders watch this pattern as an early warning that the current uptrend may be close to a reversal or short term pullback.
Why do traders pay attention to the Stalled Candlestick Pattern?
The advantage of the stalled candlestick pattern is that it indicates a subtle change of sentiment before the reversal of the trend becomes obvious. It is not an immediate exit by sellers, but a slow decline in buying strength.
The stalled candlestick pattern can assist traders when it is used in conjunction with other technical indicators to help identify the pattern:
- Identify signs of weakness in an uptrend.
- Reduce risk by looking at open long positions.
- Wait for the price action confirmation before making bearish trades.
- Don't buy fresh longs right at the end of a strong rally.
- Also, ensure momentum indicators show weakening buying pressure.
The pattern can be observed on different timeframes, but many traders believe that the pattern is more reliable on higher timeframes, considering that on higher timeframes, such as daily and weekly charts, the price movements generally reflect a stronger market participation.
How does the Stalled Candlestick Pattern form?
The stalled candlestick pattern develops slowly as the market sentiment begins to shift from confidence to caution.
This is how the formation usually takes shape:
First candle
The pattern starts with a large bullish candle, showing strong demand. The buyers are in control of the session and are pushing prices up easily, continuing the existing uptrend.
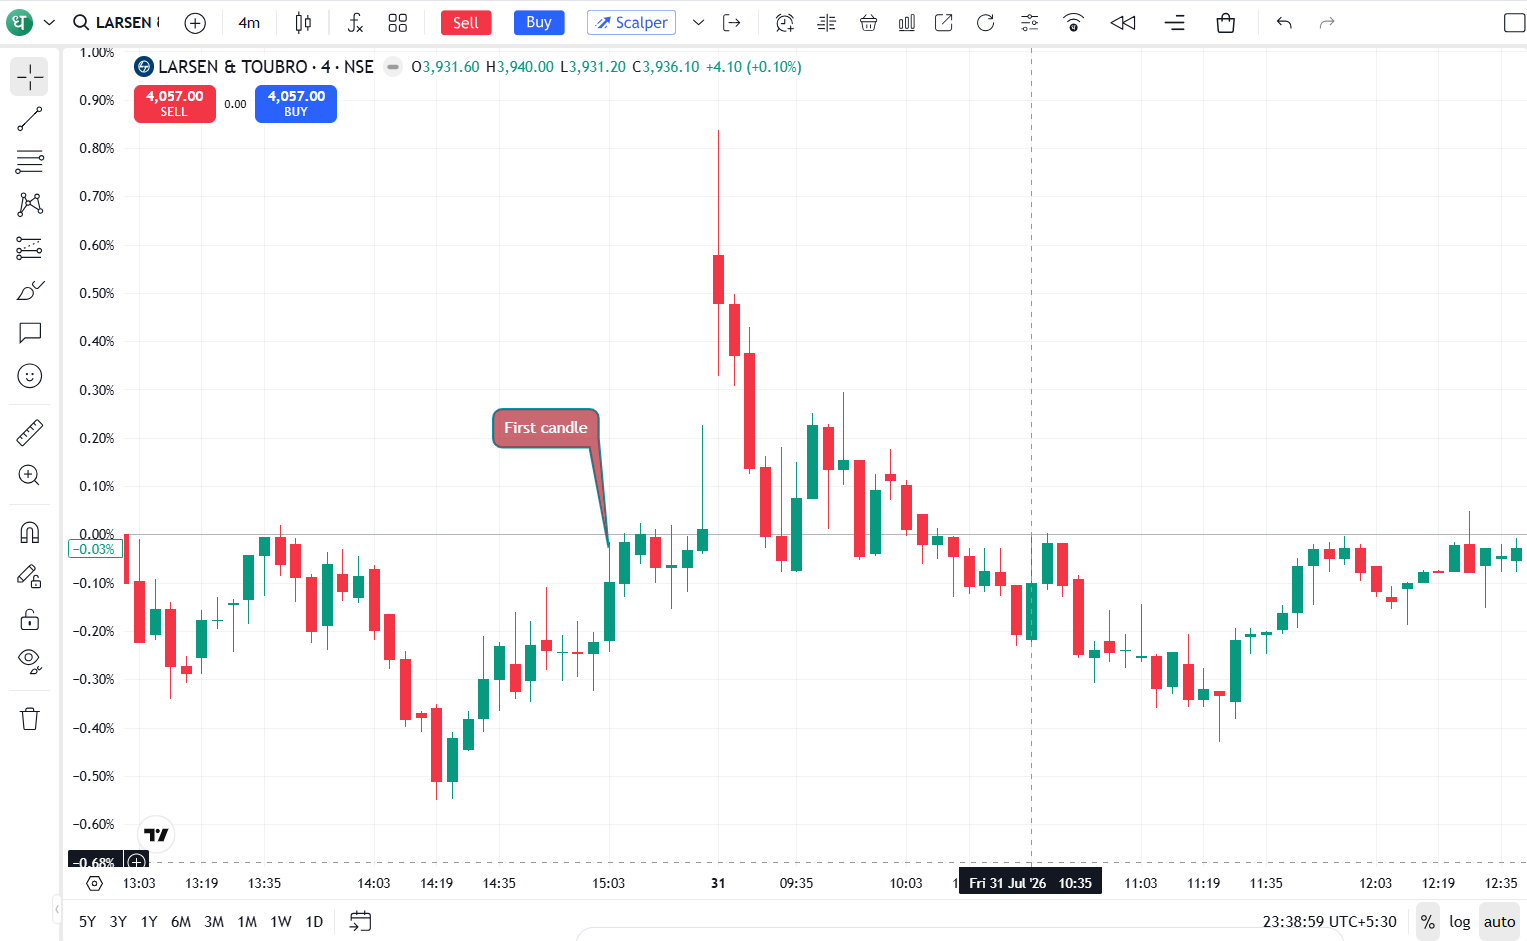
Market sentiment is still positive at this point.
Second candle
The second candle is a strong bullish candle that closes above the first candle. It implies that buyers are still in control, attracting others who expect the rally to continue.
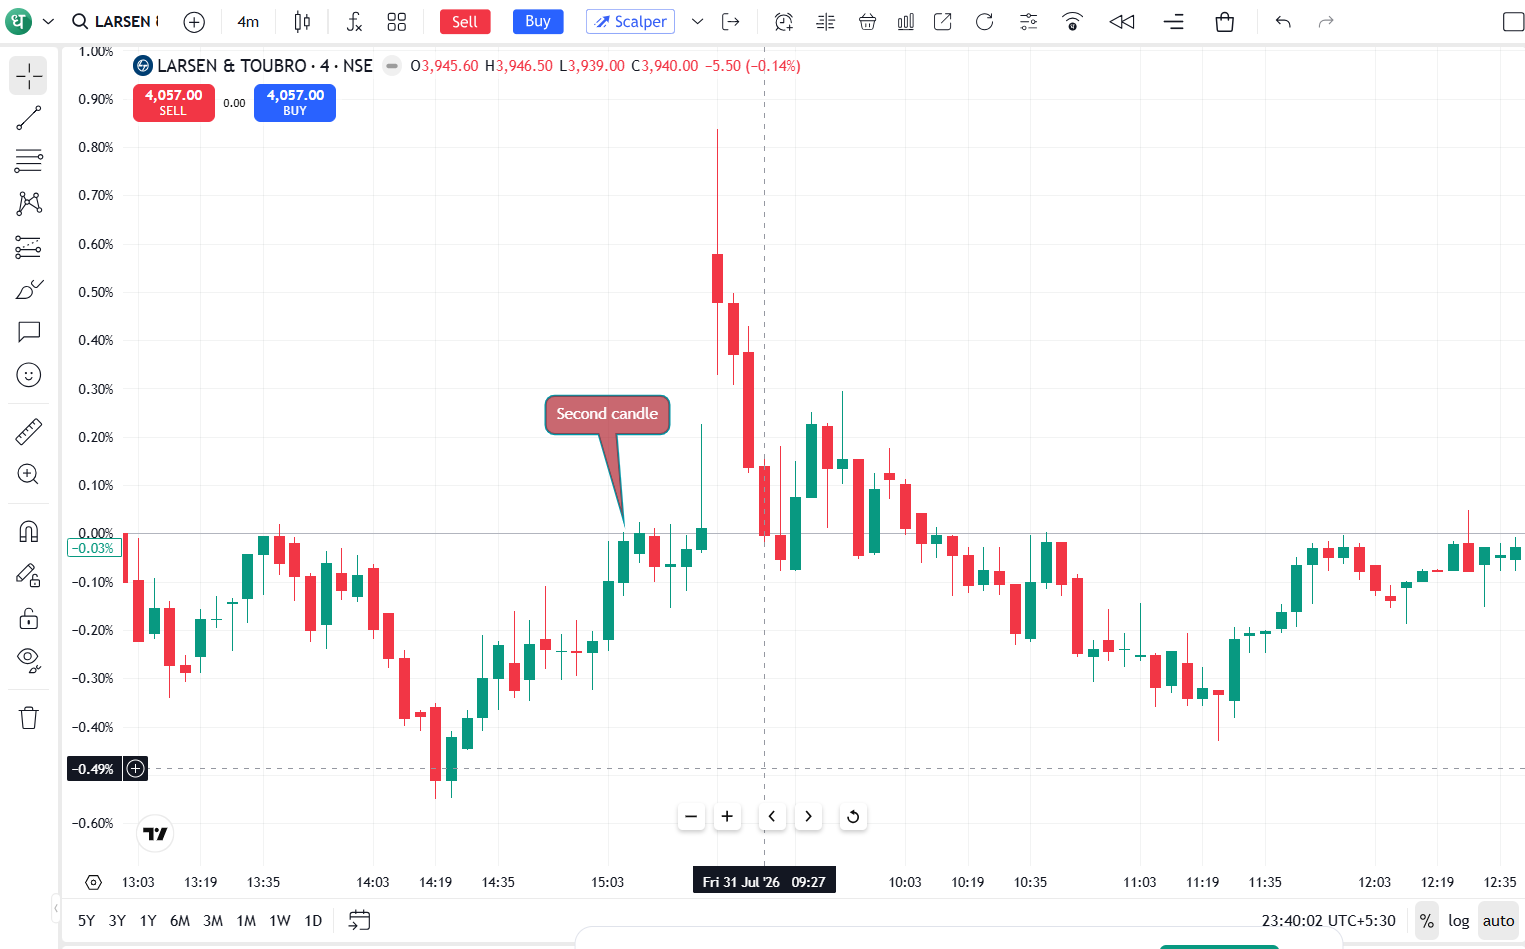
In this phase, bullish traders tend to be quite confident.
Third candle
The third candle gaps up to near the previous day’s close but has a much smaller real body.
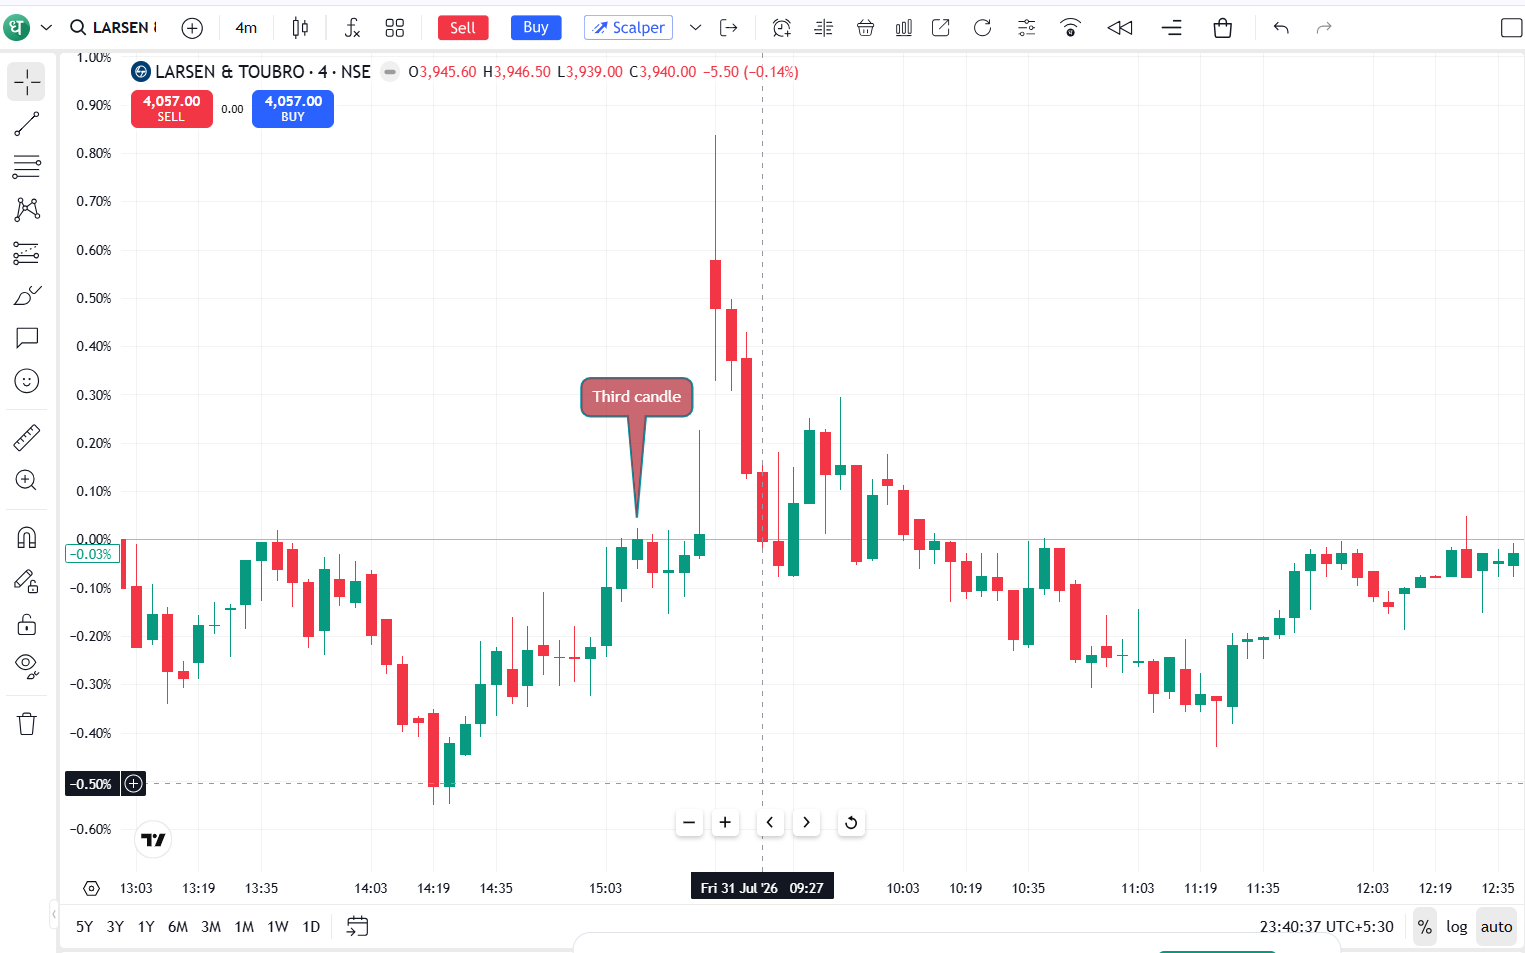
Buyers do succeed in ending the session higher, but they are not able to build the same momentum as before. Sellers begin to absorb buying pressure and that results in limited price progress.
This slowdown is what makes the stalled pattern bearishly important.
Market psychology behind the Stalled Candlestick Pattern
Each candlestick pattern shows the conflict of war between buyers and sellers. The stalled candlestick pattern is particularly useful because it signals a gradual change in market sentiment, rather than a sudden reversal.
logically, this is what is happening in each stage:
- Buyers are very bullish early on and continue to push prices up.
- Traders are piling into the rally, expecting more gains.
- Prices keep on going up and some traders start to take profits.
- Interest in buying is starting to decrease, slowing the upside momentum.
- Sellers will gradually become more active. This will prevent prices from rising so aggressively.
- The small third candle shows that buyers are losing control, but not fully surrendering.
This shift in momentum does not automatically confirm a reversal. Rather, it is a warning sign that the current trend may be losing momentum.
How to trade the Stalled Candlestick Pattern
The stalling candlestick pattern should not be considered a sell signal on its own. Instead, it works best as a sign that the existing uptrend may be losing strength. Confirmation can improve the quality of trading decisions and combining the pattern with technical analysis can help.
Take these steps to trade the pattern more effectively.
Step 1: Confirm the existing uptrend
Make sure the market is in a clear uptrend before thinking about the pattern. In a sideways market, if you see a candlestick pattern that has stalled, it is usually less reliable.
Look for:
- Higher highs and higher lows.
- Consistent bullish momentum.
- Price trading above key moving averages.
Step 2: Identify the complete pattern
Confirm that the three candles meet the criteria for a stalled candlestick pattern.
The first two candles should be strongly bullish, while the third candle should have a smaller real body, indicating slowing buying pressure.
Step 3: Wait for confirmation
Don’t jump into a trade immediately after the third candle closes.
Instead, wait for confirmation like so:
- Bearish candle closing below the third candle.
- Increased selling volume.
- A break of a support level nearby.
- Momentum indicators suggest that the bullish strength is declining.
Confirmation reduces the chance of acting on a false reversal signal.
Step 4: Plan your entry
Some traders will wait for a bearish confirmation candle below the low of the third candle before entering a short position.
Conservative traders may want to wait for further confirmation, such as a break below recent swing support.
Step 5: Place a stop-loss
The important thing is to use risk management, because not every time that there is a stalled candlestick formation is a reversal. Determine the level at which you want to set your stop loss.
Step 6: Set a profit target
Picking the right time to get into a trade is just as important as setting a realistic profit target. Use technical analysis to choose logical exit points that are based on market structure, not simply on an undefined price point. By using this method, you can capture profits and have a good risk-to-reward ratio.
Common mistakes traders make when trading the Stalled Candlestick Pattern
The stalled candlestick pattern can give a useful insight into a weakening bullish momentum, but should not be used in isolation. Many traders just trade the pattern without regard to the bigger picture of the market.
Avoid these common mistakes:
- If you take a trade before a candle confirms bearishness, you may get false signals.
- The pattern is supposed to be in accordance with a well-established uptrend. In sideways markets, it is less reliable.
- It is more significant when a pattern stalls near a major resistance level than when it stalls in the middle of a trend.
- If the uptrend continues, you could end up losing more than you expected without a stop-loss in place.
- Candlestick patterns can be combined with volume, RSI, MACD or moving averages for a more balanced approach.
- Some patterns result only in a temporary pullback before the uptrend resumes.
Avoiding these mistakes can help traders make better decisions and avoid unnecessary trading risks.
Advantages and limitations of the Stalled Candlestick Pattern
Like all technical analysis tools, the stalled candlestick pattern has strengths and weaknesses. By understanding both, traders can make better use of the pattern.
Wrapping up
A stalled candlestick pattern is a useful tool in technical analysis for identifying when an uptrend might be losing momentum. The pattern does indicate increasing caution among buyers, but should not be viewed as a standalone indication to enter a trade.
Your decision quality can improve if you confirm your trading decisions with subsequent price action and supporting technical indicators.
You may also want to analyse the pattern using support and resistance levels, volume and momentum indicators such as RSI or MACD to get a better understanding.
FAQs
1. Is the stalled candlestick pattern bullish or bearish?
The stalled candlestick pattern is generally considered a bearish reversal pattern. It indicates that buying momentum might be fading following an uptrend, but confirmation is necessary before assuming a reversal.
2. How reliable is the stalled candlestick pattern?
Its reliability is subject to market conditions. This pattern generally works better when it develops after a strong uptrend and is confirmed by a bearish candlestick, higher selling volume or confirming technical indicators.
3. Can the stalled candlestick pattern fail?
Yes, as with all technical patterns, it can produce false signals. Sometimes the market will continue higher even after the pattern has appeared.
4. On which timeframe does the stalled candlestick pattern work best?
This pattern can appear on any timeframe, but many traders find it to be more reliable on the higher timeframes, such as daily and weekly charts, as they tend to represent stronger market participation and filter out some of the short-term market noise.
5. Can beginners use the stalled candlestick pattern?
Yes. It is relatively easy for a beginner to learn to recognise the pattern. But it is best to use it in combination with other forms of technical analysis and to practise on historical charts before using it in live trading.







