



VWMA vs VWAP




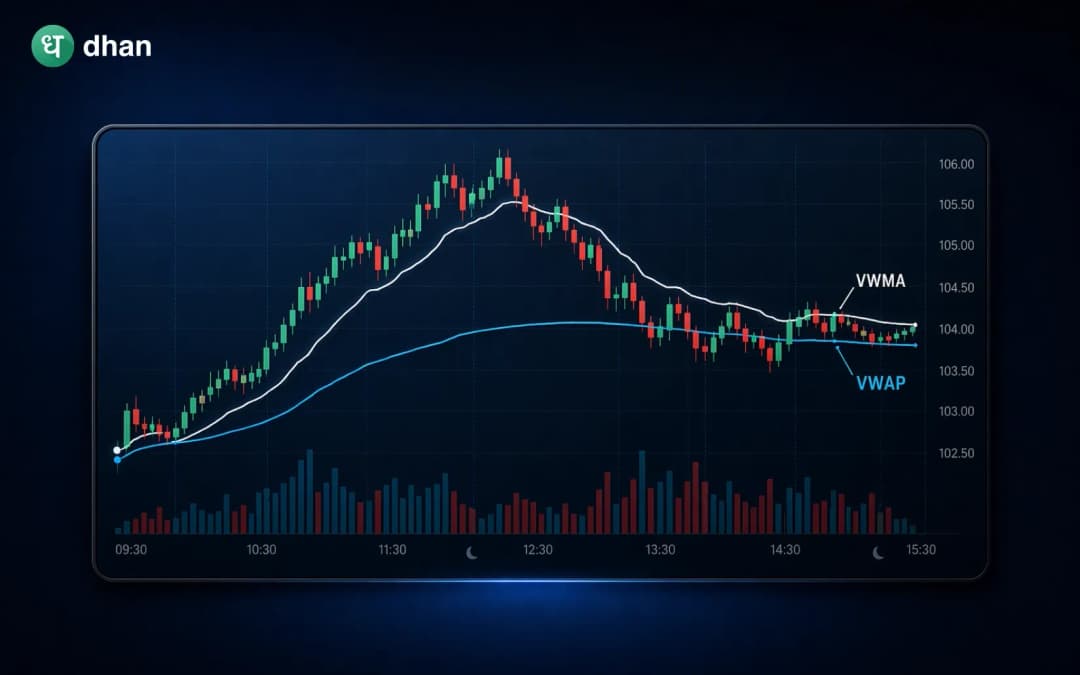




Key takeaways
- VWMA (Volume Weighted Moving Average) and VWAP (Volume Weighted Average Price) are volume-based indicators, but they are used for different purposes.
- VWMA is a moving average that incorporates volume into its calculation over a selected period.
- VWAP calculates the average price weighted by volume over a trading session.
- VWAP resets at the start of the trading day, whereas VWMA continuously updates based on its lookback period.
Volume plays a critical role in technical analysis because it reveals the level of participation behind price movements. A price rally supported by strong volume often carries more significance than a similar move occurring on weak participation.
This is why many traders look beyond traditional moving averages and incorporate volume-based indicators into their analysis.
Volume Weighted Moving Average (VWMA) and the Volume Weighted Average Price (VWAP) are among the widely used indicators. Both the indicators are volume-based, but they are designed for different purposes.
Understanding how these indicators work, what the difference is, and when each one is most useful can help traders make better decisions and avoid applying the wrong tool to a particular trading situation.
What is VWMA?
The Volume Weighted Moving Average (VWMA) is a moving average that assigns greater importance to periods with higher trading volume.
Unlike a Simple Moving Average (SMA), which gives equal weight to every price point, the VWMA places more emphasis on price movements that occur with significant volume.
If a stock rises sharply with high volume, that move may have greater importance than a move with small volume. This is reflected by the VWMA, which weights prices by the trading activity. This means the indicator is generally more sensitive to volume in terms of market trends.
What is VWAP?
The Volume Weighted Average Price (VWAP) calculates the average trading price of an asset throughout a trading session, which is weighted by volume.
VWAP is commonly used by institutional traders, intraday traders, and algorithmic trading systems. The indicator begins calculating from the opening bell and continues throughout the trading day. At the start of the next trading session, the calculation resets and starts again.
Because of this daily reset feature, VWAP is primarily considered an intraday indicator. It helps traders determine whether the current price is trading above or below the average transaction price of the day.
How VWMA works
VWMA calculates the average price over a selected time period and gives more weight to candles with higher volume.
For example, a 20-period VWMA considers the previous 20 price periods and adjusts the calculation based on volume.
If a stock experiences strong buying activity during certain sessions, those periods influence the VWMA more heavily than periods with low participation.
This characteristic allows VWMA to respond differently from traditional moving averages. Many traders use VWMA to confirm trend strength and identify areas of support and resistance.
How VWAP works
VWAP continuously monitors the average traded price throughout the day. Calculations are updated based on its volume. As the trading session progresses, VWAP reflects the average price at which the asset has traded.
Interpretation of VWAP is as follows:
- Price above VWAP as bullish
- Price below VWAP as bearish
Many institutions use VWAP as a benchmark for evaluating trade execution quality. For example, a fund manager purchasing shares below VWAP may view the execution as favourable.
Key differences between VWMA and VWAP
Although both indicators incorporate volume, several important distinctions exist. These differences are captured in the table below.
- Purpose: VWMA is primarily used for trend analysis, while VWAP is commonly used for intraday price benchmarking and assessing market direction.
- Trading Style: VWMA is preferred by swing traders and position traders who focus on medium- to long-term trends. VWAP is widely used by day traders and institutional participants for intraday trading decisions.
- Indicator Behavior: VWMA functions like a moving average that gives greater importance to periods with higher trading volume. In contrast, VWAP acts as a dynamic intraday reference level that helps identify potential support and resistance zones.
- Timeframe: VWMA is calculated using a rolling lookback period and continuously updates over time. VWAP resets at the beginning of each trading session and reflects only the current day's trading activity.
- Best Use Case: VWMA is useful for identifying trend direction and confirming price movements, whereas VWAP is effective for evaluating intraday price performance and trade execution quality.
- Market Focus: VWMA is suitable for analyzing broader market trends across multiple timeframes, while VWAP is specifically designed for intraday market analysis.
VWMA vs VWAP in trend analysis
When identifying broader trends, VWMA generally has an advantage.
Because VWMA considers a longer historical period, it can help traders understand medium-term and long-term market direction.
For example:
- Price above rising VWMA is considered a bullish trend
- A price below the falling VWMA is considered a bearish trend
VWAP, on the other hand, focuses only on current-session activity. Although it is useful for intraday trend analysis, it provides less information about long-term market structure.
VWMA vs VWAP in intraday trading
VWAP is preferred by intraday traders. Traders observe how the price behaves with respect to VWAP during the session.
For example:
- Price above VWAP may indicate buying strength.
- Price repeatedly rejected below VWAP may indicate selling pressure.
Since VWAP reflects the average transaction price of the day, it usually acts as a dynamic support or resistance level. VWMA can still be used intraday, but VWAP is generally more relevant for short-term decision-making.
Combining VWMA and VWAP
Some traders use VWMA and VWAP in combination. For example, VWAP can identify intraday trend direction, while VWMA confirms the broader market trend supporting the VWAP.
Suppose a stock trades above both VWAP and VWMA. This may strengthen the bullish outlook for the market. Similarly, trading below both indicators may support a bearish view.
Using multiple indicators can help traders build greater confidence in their analysis.
Advantages of VWMA
The advantages of VWMA are as follows:
- It incorporates volume into trend analysis, providing a more nuanced view than traditional moving averages.
- It helps identify trends supported by strong market participation rather than simply tracking price movement.
- It can be used across different timeframes, making it suitable for swing traders and longer-term market analysis.
- The indicator usually reacts more meaningfully to high-volume price movements, helping traders identify stronger trends.
Advantages of VWAP
The advantages of VWAP are as follows:
- VWAP provides a real-time benchmark for intraday price performance.
- It is widely followed by institutional traders and can act as an important intraday reference level.
- It helps traders evaluate whether they are buying or selling at favourable prices relative to the session average.
- It can serve as dynamic support and resistance throughout the trading day.
Limitations of VWMA and VWAP
Traders should understand the limitations of VWAP and VWMA indicators while using them.
- VWMA may still lag because it is based on historical data and reacts after price movements occur.
- VWAP resets each day, hence loses its relevance after the trading session ends.
- Both indicators do not forecast a price movement, but will analyse the market conditions.
- When used along with price action, volume analysis and risk management techniques, they work best.
Conclusion
VWMA and VWAP are volume-based indicators designed for accomplishing different purposes. VWMA combines volume with moving averages to gain a better insight into trends. VWAP tells us the average price at which a stock was traded throughout the day.
Swing traders and investors use VWMA as it provides insights into broader market trends. While VWAP is a powerful benchmark for trend analysis, trade execution, and market sentiment.
FAQs
What is the main difference between VWMA and VWAP?
The main difference is that VWMA is a moving average calculated over a selected period, while VWAP measures the volume-weighted average price during a single trading session and resets each day.
Do professional traders use VWAP?
Yes, many institutional and professional traders use VWAP as a benchmark to evaluate the quality of their trade executions and monitor intraday market direction.
Can VWMA be used for intraday trading?
Yes, VWMA can be used on intraday charts. However, many day traders prefer VWAP because it reflects the current session's trading activity.
Why does VWAP reset every day?
VWAP is designed to monitor the average traded price within a single trading session. Resetting each day ensures that the calculation reflects only the current session's activity.
Does VWMA react faster than a simple moving average?
In some cases, yes. Since VWMA gives more weight to periods with higher trading volume, significant price moves accompanied by strong volume can influence the indicator more than a traditional SMA.







