



Downside Tasuki Gap








Key takeaways
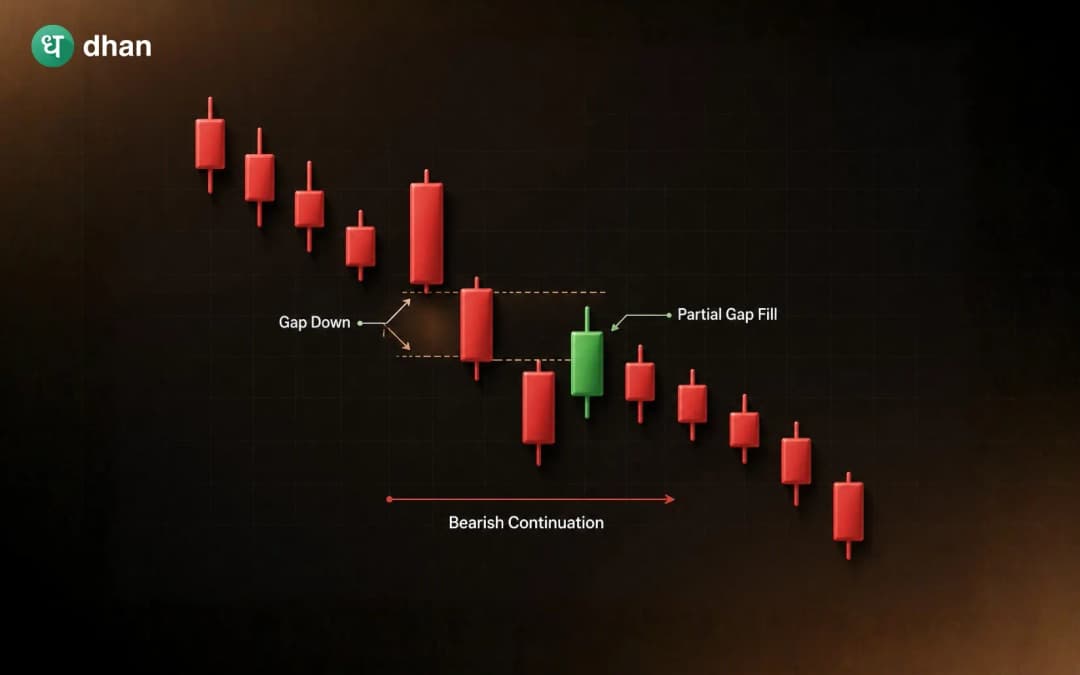
- The bearish continuation candlestick pattern, downside tasuki, usually appears during an existing downtrend, suggesting the sellers are in control of the market.
- The pattern is formed using three candles, where the third candle does not completely fill the gap, showing stronger seller sentiment.
- The pattern works better when there is a clear downtrend and may not be useful in a sideways market.
- It is best used along with trading volume and other technical indicators instead of relying on the pattern alone. Also, traders must consider proper risk management before taking a trade.
- Waiting for confirmation before entering a trade can help traders avoid acting on a false signal.
Stock prices keep moving as buyers and sellers respond to changing market conditions. Traders study these price movements to understand the direction of the market and identify possible trading opportunities. One of the most common ways to understand the price movements is by analysing candlestick patterns, which can provide useful clues about whether a trend is likely to continue or change.
Among various useful candlestick patterns, the downside tasuki gap is one such widely known candlestick pattern. The bearish continuation pattern usually appears during an existing downtrend. The pattern suggests that the downward trend may continue despite a brief recovery. It increases the possibility that the downward trend may continue. However, like any other technical pattern, it should be used along with other indicators and market analysis instead of relying on it alone.
This article explains what the downside tasuki gap pattern is, how it is formed, its important characteristics, how traders can identify and use it, the common mistakes to avoid, along with its advantages and limitations.
What is the Downside Tasuki Gap?
A bearish continuation candlestick pattern, the downside tasuki gap usually appears during an existing downtrend. It suggests that the ongoing downward price movement may continue instead of reversing.
The pattern develops after strong selling in the market. Although buyers attempt to push prices higher for a short time, they are unable to change the overall direction of the trend. This suggests that sellers are still active and the downward movement may continue.
Like any other candlestick pattern, the downside tasuki gap should be used along with trading volume, technical indicators and the overall market trend before making a trading decision.
How is the Downside Tasuki Gap formed?
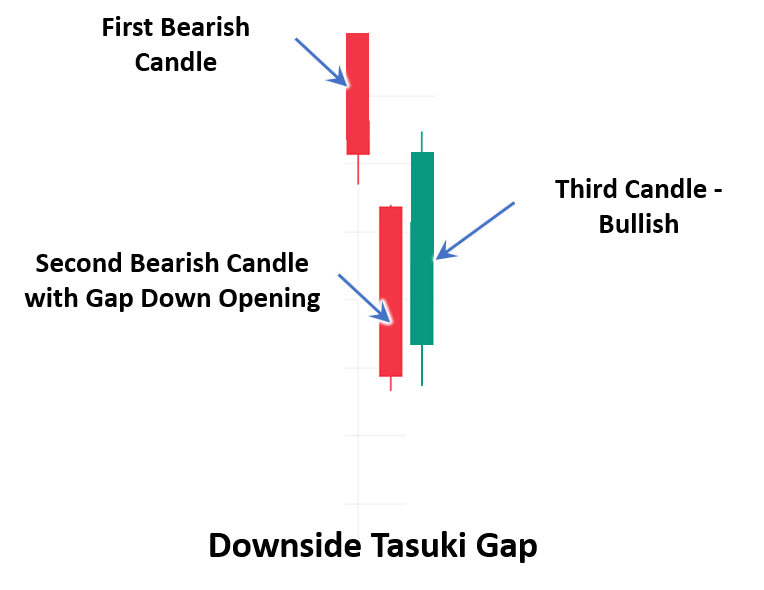
The pattern is formed using three consecutive candlesticks during an existing downtrend.
- The first candle is a long bearish candle suggesting that sellers are in control and prices are moving lower.
- The second candle, which is also bearish, opens below the previous candle. It creates a downward gap, indicating that selling pressure is still strong and traders continue to sell at lower price levels.
- The third forms a bullish pattern showing an uptrend as buyers try to gain market control.
However, buyers are unable to fill the earlier decline, showing that the selling pressure has not weakened, and although buyers have tried to push prices higher, they have not been able to overcome the selling pressure.
As such, the existing downtrend often continues, making the downside tasuki gap a bearish continuation pattern.
Important characteristics of the Downside Tasuki Gap
The pattern has a few features that make it easier to identify on a price chart.
Appears during a downtrend
The pattern is meaningful only when prices are already moving lower. If it appears during a sideways or upward market, it may not give a reliable signal.
Three-candle pattern
The pattern develops over three consecutive trading sessions. The first two candles reflect strong selling, while the final candle shows buyers trying to recover part of the earlier decline.
A downward gap is present
The second bearish candle opens below the first candle, creating a gap. This gap is one of the main characteristics of the pattern.
The gap remains unfilled
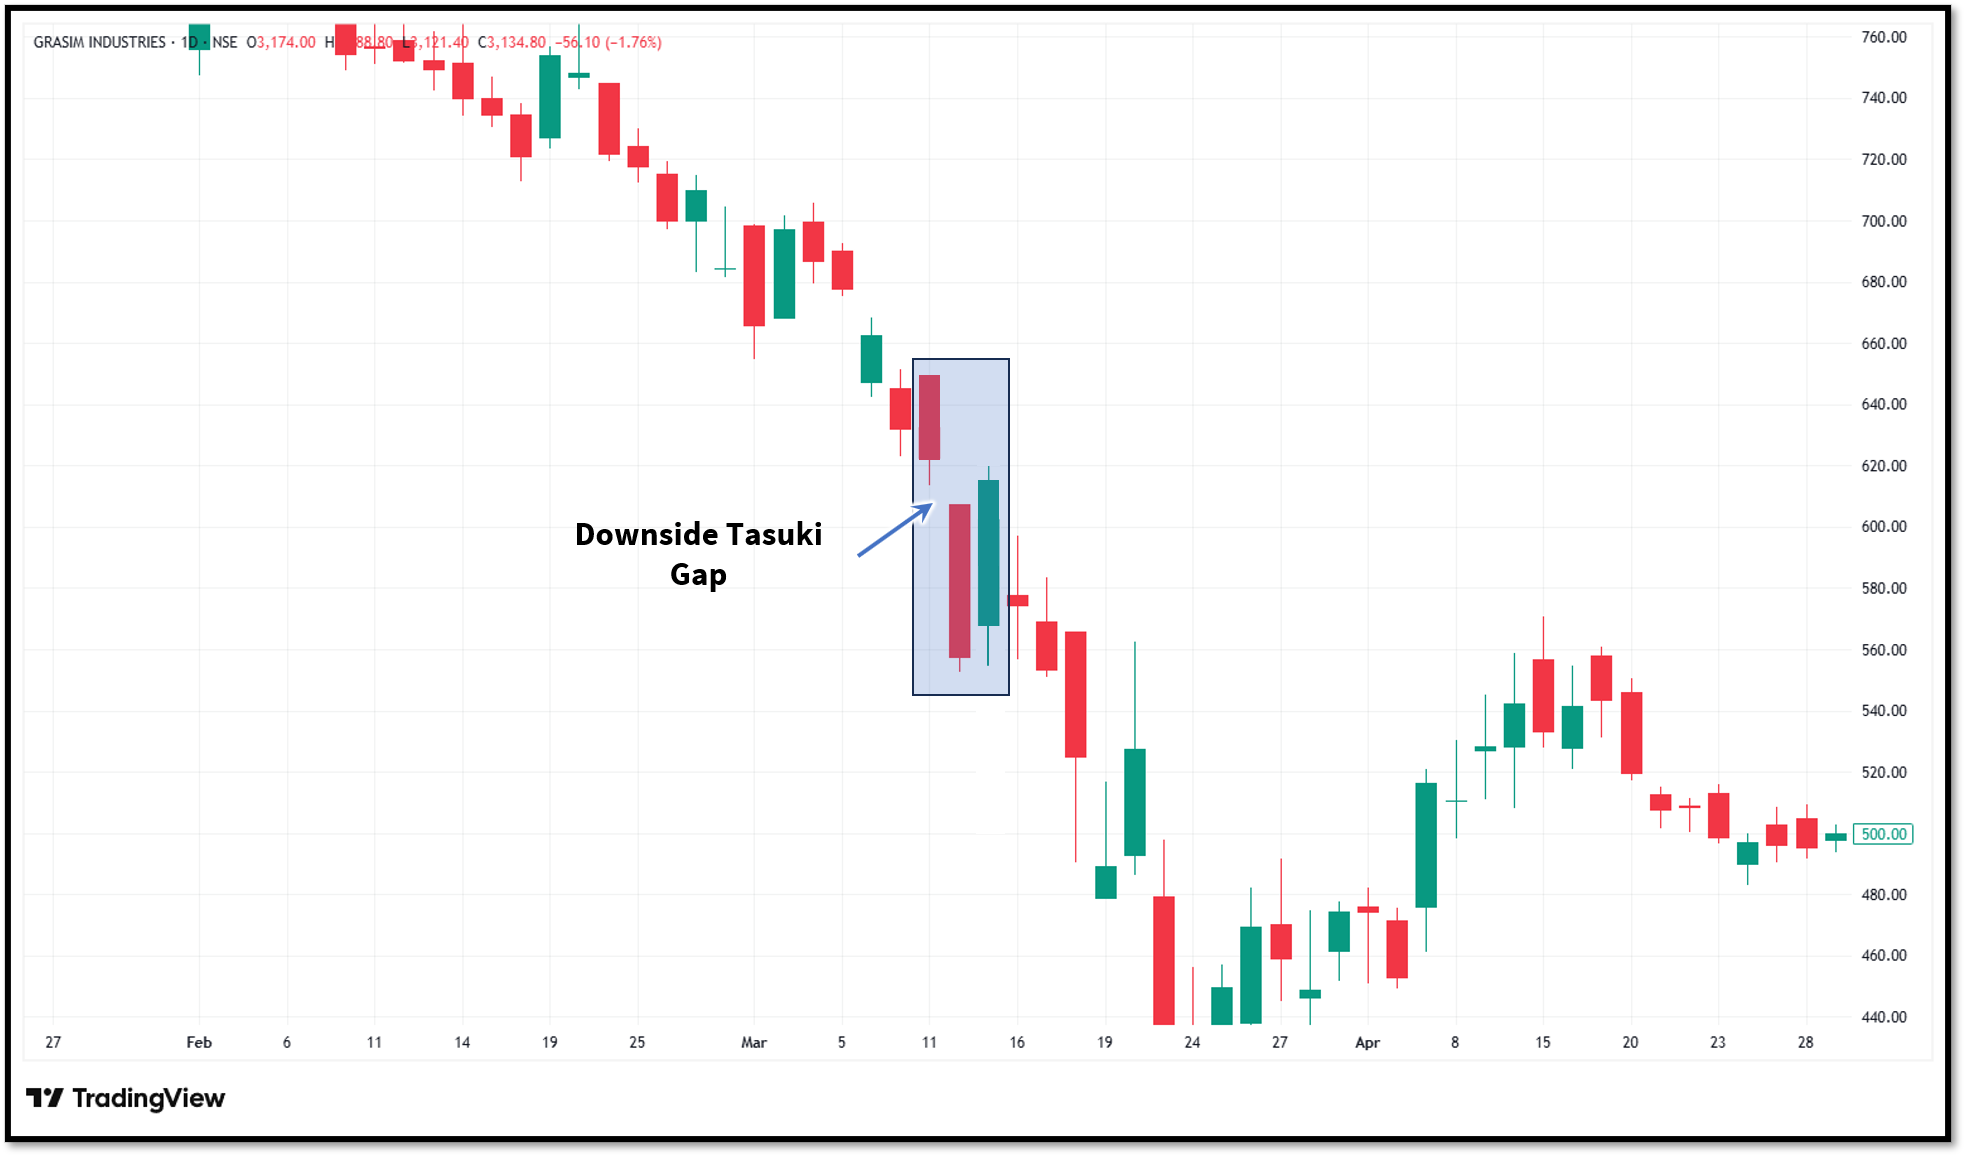
Although the third candle moves higher, it does not fill the gap created earlier, suggesting that buyers have not been able to change the direction of the trend.
Shows continued selling pressure
Since the gap remains open, the pattern indicates that sellers are still active and the existing downtrend may continue.
How to identify and use the Downside Tasuki Gap
The pattern appears during an existing downtrend and suggests that sellers may continue to dominate the market. Before using the pattern, traders should know what to look for on the price chart. To identify the pattern:
Check the existing trend
This candlestick pattern should appear after prices have already been falling. If the market is moving sideways or upward, the pattern may not give a useful signal.
Don't ignore trading volume
Volume can give an extra clue about the pattern. If selling activity is higher during the first two bearish candles, it may support the continuation of the downtrend.
Use other indicators
Most traders do not depend on one candlestick pattern alone. They also look at indicators such as moving averages or RSI to understand whether the downtrend is still continuing.
Wait for additional confirmation
Traders must avoid entering a trade immediately after spotting the pattern. Watching the next few candles can help traders see whether the price is continuing to move lower.
Use as part of a broader strategy
Do not rely solely on the pattern. Instead, traders should combine it with other analysis methods and risk strategies for better decisions.
Common mistakes traders should avoid
While the downside tasuki gap can be a useful pattern, it is important that traders identify and wait for confirmation. Some common mistakes include:
Using the pattern in the wrong market
The downside tasuki gap is a continuation pattern, and if it appears during a sideways market or after an uptrend, it may not give a reliable signal.
Ignoring confirmation
Some traders enter a trade as soon as they spot the pattern. Waiting for additional price confirmation can help reduce the chances of acting on a false signal.
Overlooking trading volume
Volume is an important parameter. It can provide additional confidence in the pattern. Ignoring it may result in weaker trade setups.
Depending only on one pattern
No candlestick pattern is accurate all the time. It is always better to use the downside tasuki gap along with technical indicators and overall market analysis.
Not managing risk
Every trade carries some level of risk. Using stop-loss orders and deciding the risk before entering a trade can help protect against unexpected price movements.
Advantages of the Downside Tasuki Gap
Here are benefits of using this pattern.
- The pattern has a three-candle structure that makes it easier for beginners and seasoned traders to spot.
- It enables traders to understand if an existing downtrend is likely to continue and sellers may continue to control the market.
- Traders often look at this pattern together with other indicators like moving averages or RSI for effective decision-making.
- The downside tasuki gap candlestick pattern can be used while analysing different stocks, commodities, forex and other assets.
- Traders can use the chart as an additional reference while planning an entry and exit during a trade.
Limitations of the Downside Tasuki Gap
Here are some limitations to consider.
- Like every candlestick pattern, the pattern can sometimes give a false signal. Even after the pattern is formed, prices may move in the opposite direction.
- The pattern is highly reliable and useful when used during a clear downtrend. If prices are moving sideways or there is no clear trend, it may not be useful.
- Looking at the pattern alone is not enough. Traders should consider confirming the pattern with trading volume, support and resistance levels or indicators such as moving averages and RSI before taking a trade.
- Major news or unexpected global events can quickly change market direction, and the pattern may not perform as expected.
- Even if the pattern appears clearly, there is no guarantee that the price will continue moving lower. Traders should still plan their stop-loss and limit possible losses.
Wrapping up
The downside tasuki gap is a useful candlestick pattern for traders who want to understand whether an existing downtrend is likely to continue. While the pattern can provide helpful insights, it should not be the only factor behind a trading decision. Looking at the overall trend, trading volume and other technical indicators can help traders understand the market better. Like every candlestick pattern, it works best when it is used as part of a complete trading approach.
FAQs
Is the downside tasuki gap a bullish or bearish pattern?
It is a bearish continuation pattern which usually appears during a downtrend. It suggests that the existing downward price movement may continue.
How many candles form the downside tasuki gap?
The pattern is made up of three candles. After two sessions of falling prices, the third candle shows a short recovery. However, the overall downward trend usually remains unchanged.
Can traders use a downside tasuki gap on its own?
Traders should not use the pattern in isolation. Using it along with technical indicators, trading volume and the overall market trend allows them to make better decisions.
In which market can the downside tasuki gap be used?
The pattern can be used in markets that follow candlestick charts, such as stocks, commodities, forex and cryptocurrencies.
Is the downside tasuki gap suitable for beginners?
Yes, the three-candle structure makes it relatively easy to identify. However, beginners should practise identifying the pattern and learn to use it with other forms of technical analysis instead of relying on it alone.







