



Continuation Candlestick Patterns







Key takeaways
- Continuation candlestick patterns indicate that the prevailing market trend is likely to resume after a brief period of consolidation or profit booking.
- These patterns are most reliable when they develop within a well-established uptrend or downtrend and are confirmed by volume and other technical indicators.
- Traders should not rush into a trade just based on continuation patterns, but wait for a confirmation and then combine that with proper risk management.
Financial markets rarely move in one direction without interruption. Even during strong bullish or bearish trends, prices often pause as traders book profits, new participants enter the market, or buyers and sellers temporarily reach equilibrium. These pauses are a natural part of market behaviour and do not necessarily signal that the trend is about to reverse.
Continuation candlestick patterns become useful in such situations. These patterns do not indicate a change in the trend, but they suggest it may continue. They help traders distinguish between a pullback and a potential trend reversal.
Continuation candlestick patterns are widely used across different markets like stocks, commodities, forex, and indices, as they provide valuable information regarding market momentum. But these patterns should not be interpreted as a standalone signal; they should always be read in the context of the larger trend and with the support of other technical tools.
What are Continuation Candle Patterns?
Continuation candlestick patterns are chart formations that suggest the current market trend is likely to continue after a short pause or correction. Unlike reversal patterns, which indicate that buyers or sellers may be taking control from the opposite side, continuation patterns show that the dominant market participants still retain their overall strength.
Even in strong trends, temporary pullbacks occur as traders try to book profits or wait for fresh information before taking new positions. These pullback causes to form continuation patterns. Once this consolidation phase ends, the original trend usually resumes, creating potential trading opportunities.
Continuation candlestick patterns can be classified into two categories:
- Bullish continuation patterns, which indicate that an existing uptrend may continue.
- Bearish continuation patterns, which suggest that a downtrend is likely to resume after a temporary pause.
Common Continuation Candle Patterns
Some of the most common continuation candlestick patterns are discussed below:
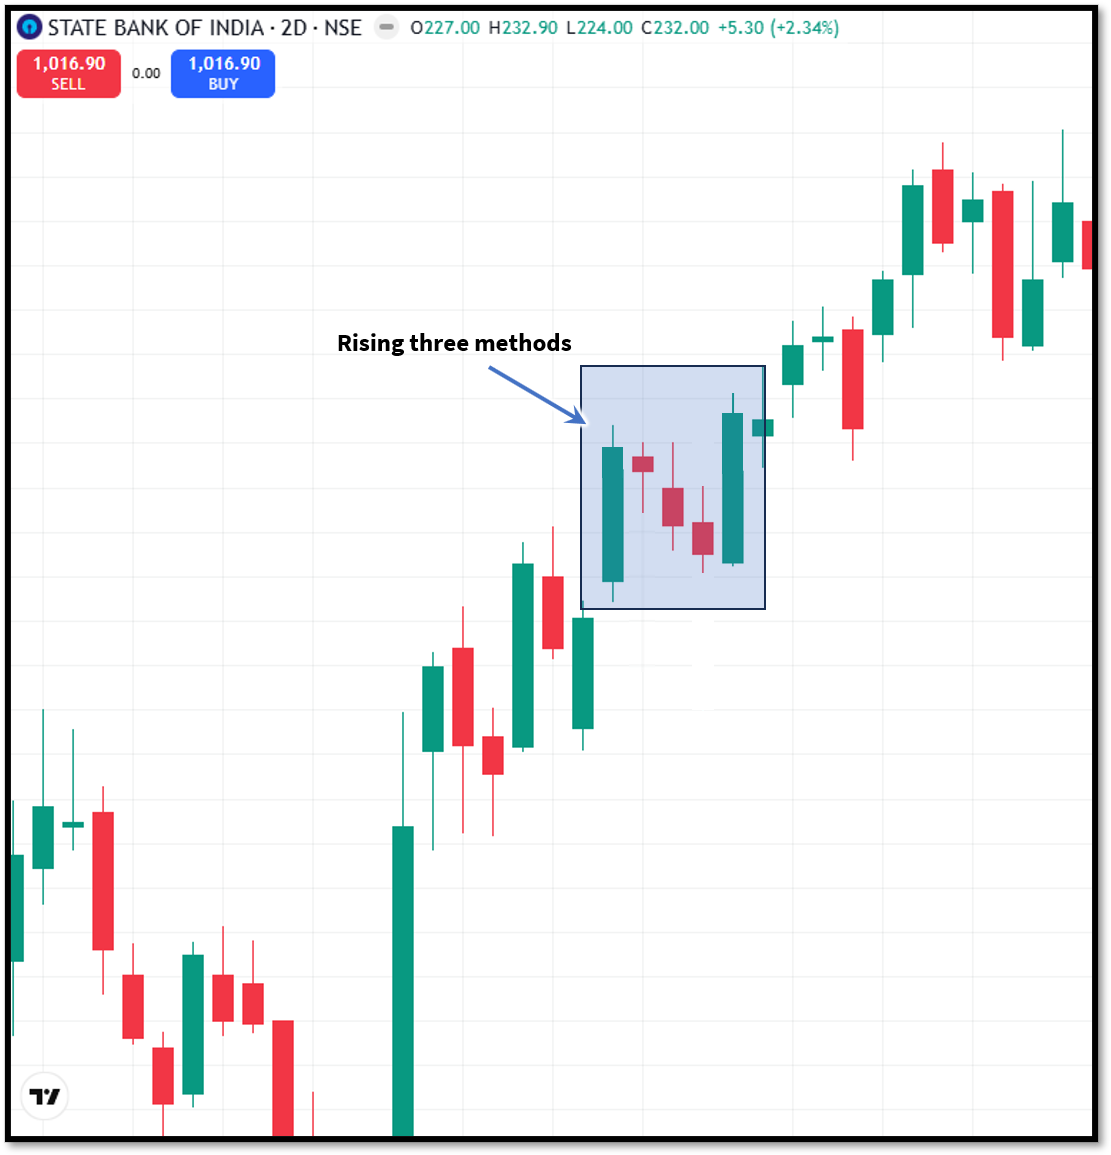
Rising three methods
The Rising Three Methods is one of the most recognised bullish continuation candlestick patterns. The pattern consists of five candles:
- A strong bullish candle
- 3 small red candles that remain within the range of the first candle
- A final strong bullish candle that closes above the high of the first candle
The first candle reflects strong buying pressure. The next three smaller candles represent temporary profit booking rather than a complete shift in market sentiment. The final bullish candle confirms that buyers have regained control and that the uptrend may continue.
This pattern is considered more reliable when it forms during a strong uptrend and is supported by increasing trading volume on the breakout.
Falling three methods
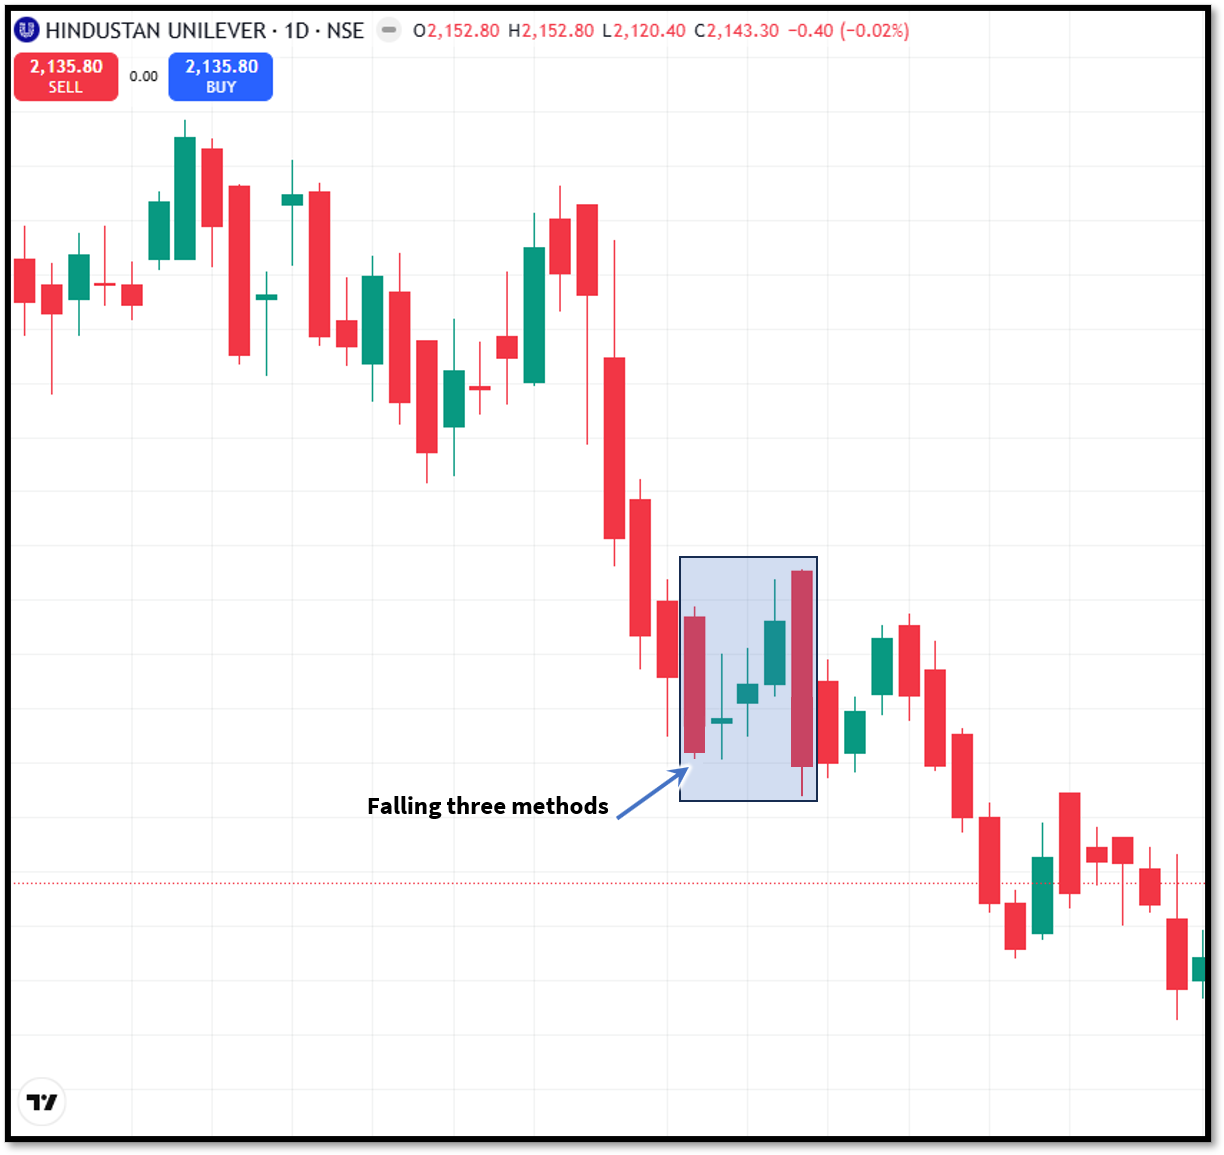
The Falling Three Methods is the bearish counterpart of the Rising Three Methods. This pattern also consists of five candles:
- A long bearish candle.
- 3 small bullish candles that remain within the range of the first candle.
- A final bearish candle that closes below the first candle's low.
The small bullish candles suggest a temporary pause in selling rather than a genuine trend reversal. When the final bearish candle appears, it indicates that sellers have resumed control, increasing the probability that the downtrend will continue.
Traders usually look for confirmation through increased selling volume before entering a bearish trade.
Mat Hold pattern
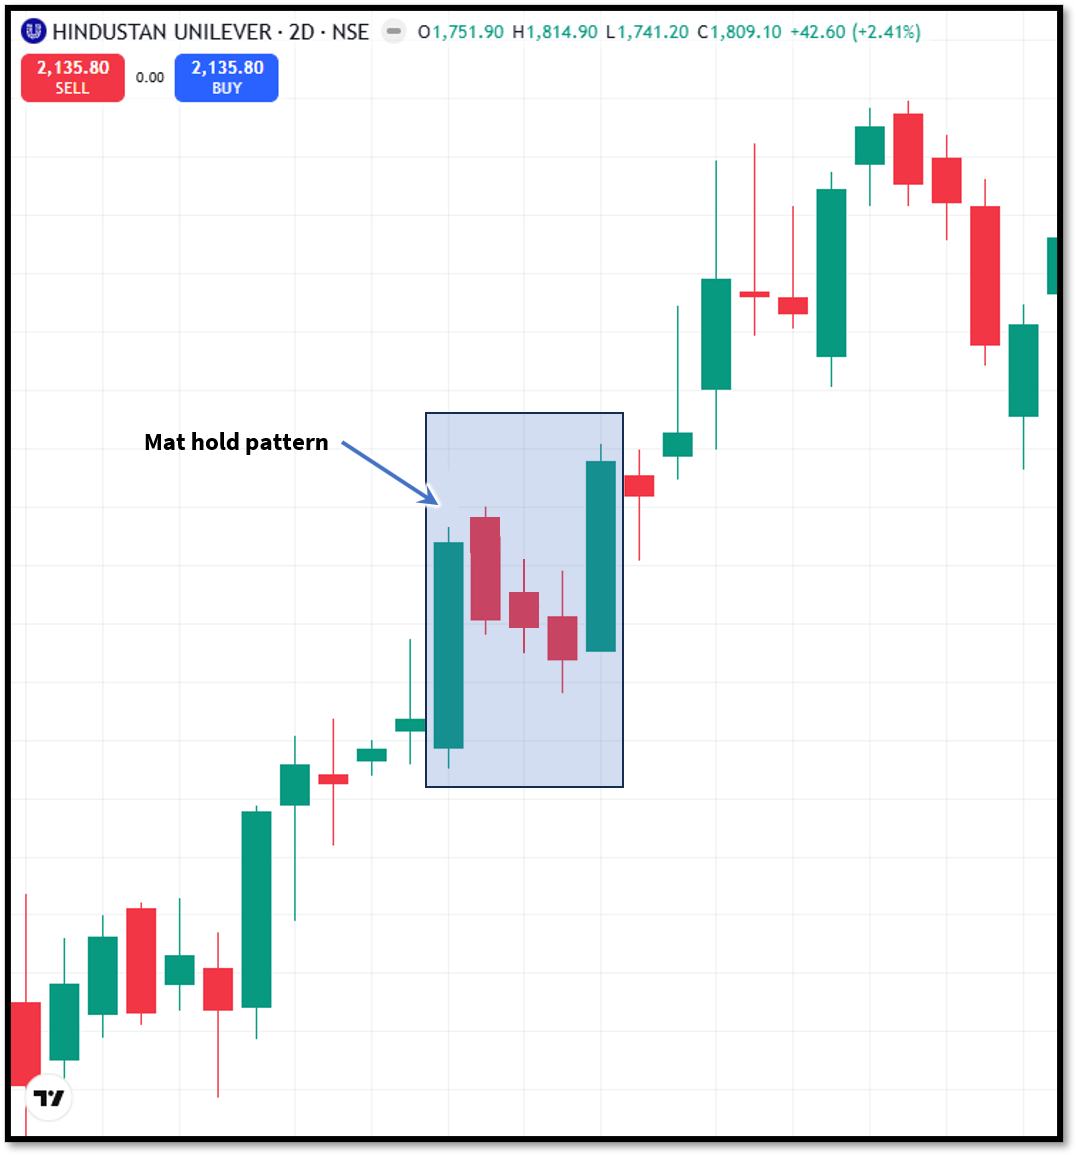
The Mat Hold is a relatively rare but powerful bullish continuation pattern.
It begins with a strong bullish candle, followed by a small gap upward. The next few candles move lower but remain above the starting point of the first bullish candle. The pattern concludes with another strong bullish candle that resumes the prevailing uptrend.
The temporary decline represents short-term profit booking rather than aggressive selling. Once buyers return, the market continues moving higher.
Upside Tasuki Gap
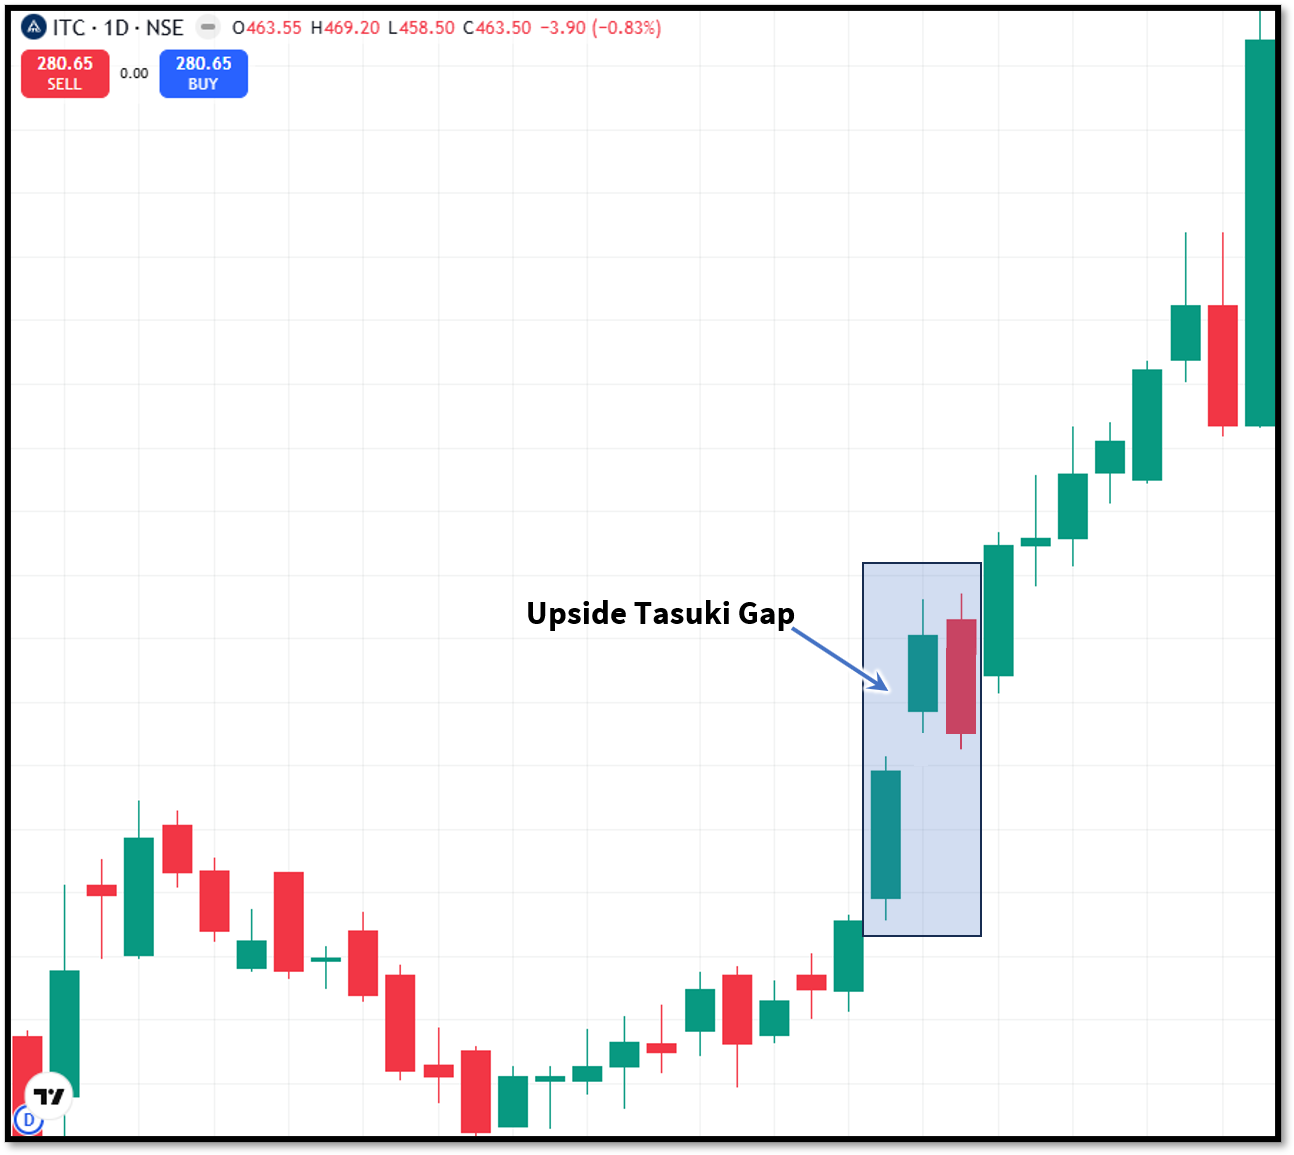
The Upside Tasuki Gap is another bullish continuation pattern that appears during an established uptrend. The pattern begins with two consecutive bullish candles separated by an upward price gap. The third candle is bearish and partially fills the gap but does not close it completely.
This partial retracement suggests that sellers attempted to push prices lower but failed to eliminate the buying momentum. As a result, the existing uptrend is expected to continue.
Although gaps occur more frequently in equity markets than in forex, the pattern remains an important continuation signal where price gaps are common.
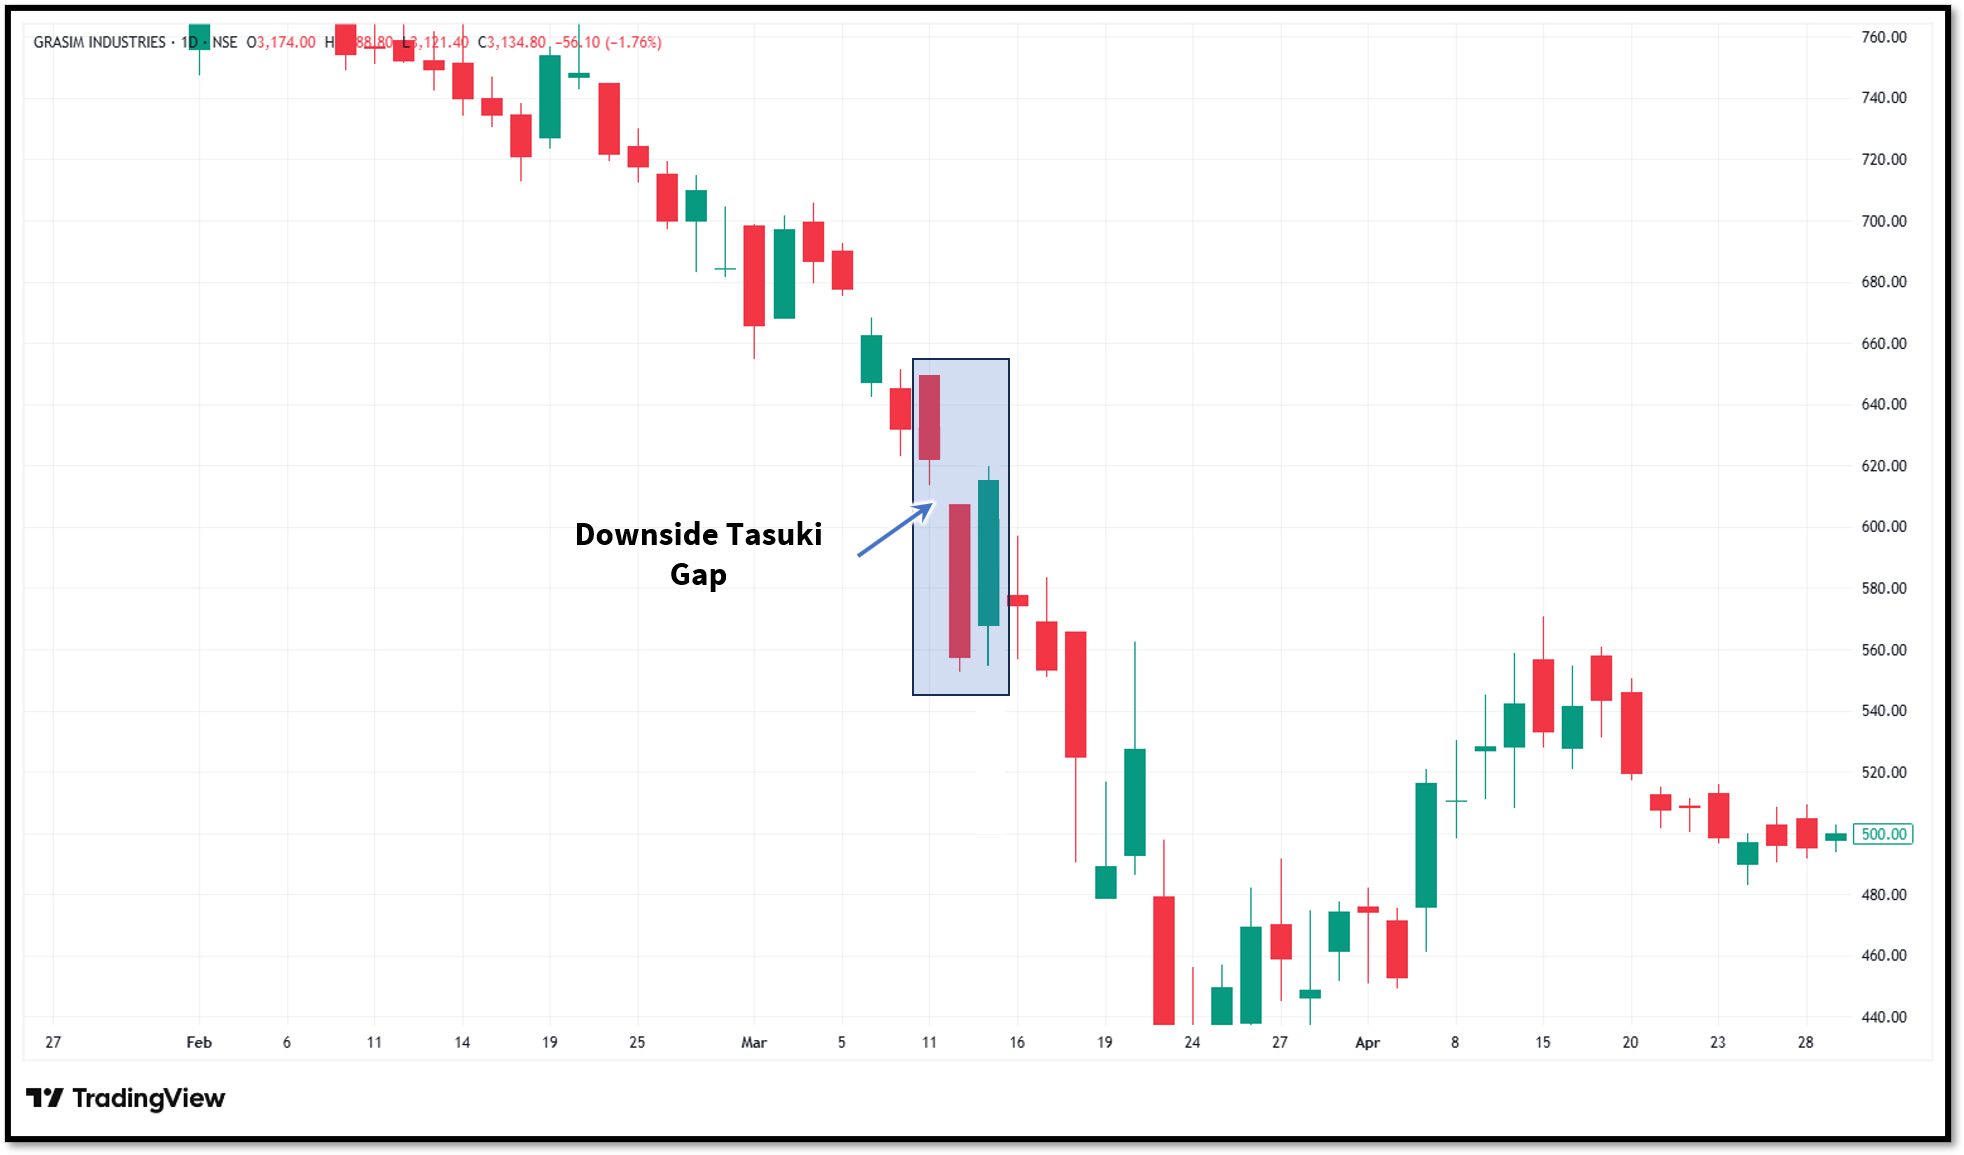
Downside Tasuki Gap
The Downside Tasuki Gap is the bearish version of the Upside Tasuki Gap. It starts with two bearish candles separated by a downward gap. The third candle is bullish and partially fills the gap without completely closing it.
This suggests that the buyers have entered the market for a brief period but were not powerful enough to reverse the ongoing downtrend. The selling pressure continues to dominate and raises the odds that prices will continue to move lower.
Like its bullish counterpart, this pattern is more commonly observed in markets where overnight price gaps frequently occur.
Indicators that work well with Continuation Candlestick Patterns
Although continuation patterns provide useful signals, combining them with technical indicators can improve trade confirmation.
Moving averages
Moving averages help traders identify the overall trend direction. A bullish continuation pattern forming above a rising moving average, or a bearish continuation pattern forming below a falling moving average, supports the existing trend.
Relative Strength Index (RSI)
RSI is a market momentum indicator. If the RSI stays strong during a continuation pattern and doesn't get into extreme overbought or oversold territory, it could signal that the current trend still has legs.
MACD
The Moving Average Convergence Divergence (MACD) helps evaluate momentum shifts.
A bullish MACD crossover during a bullish continuation pattern or a bearish crossover during a bearish continuation pattern can provide additional confidence before entering a trade.
Trading volume
A continuation pattern followed by higher trading volume during the breakout generally indicates a stronger signal, making the continuation signal more reliable.
Continuation Candlestick Patterns vs Chart Patterns
Although both continuation candlestick patterns and chart patterns are used in technical analysis, they differ in several ways:
To wrap up
Continuation chart patterns are the formations that form during a strong uptrend or downtrend and signal that the trend may continue its journey in the previous direction. They indicate that buyers or sellers may simply be taking a brief pause before continuing the prevailing trend.
Although these patterns do not guarantee future price movements, they can provide insights into the market's behaviour and traders' psychology. Also, the reliability of these patterns can be increased when used along with other indicators and price action.
FAQs
What are continuation candlestick patterns?
Continuation candlestick patterns are price formations that signal the existing market trend is likely to continue after a temporary pause or consolidation rather than reverse.
Which are the most common continuation candlestick patterns?
Some of the most widely recognised continuation candlestick patterns include Rising Three Methods, Falling Three Methods, Mat Hold, Upside Tasuki Gap, and Downside Tasuki Gap.
Can beginners trade continuation candlestick patterns?
Yes. Beginners can learn to identify continuation patterns by first understanding market trends and practising on historical charts before using them in live trading.
Which indicators work best with continuation candlestick patterns?
Moving averages, RSI, MACD, trading volume, and support and resistance levels to improve confirmation before entering a trade.
Should continuation candlestick patterns be used alone?
No. For better trading decisions, continuation candlestick patterns should be combined with trend analysis, technical indicators, support and resistance levels, and a well-defined risk management strategy.







