



Hammer vs Hanging Man








Key takeaways
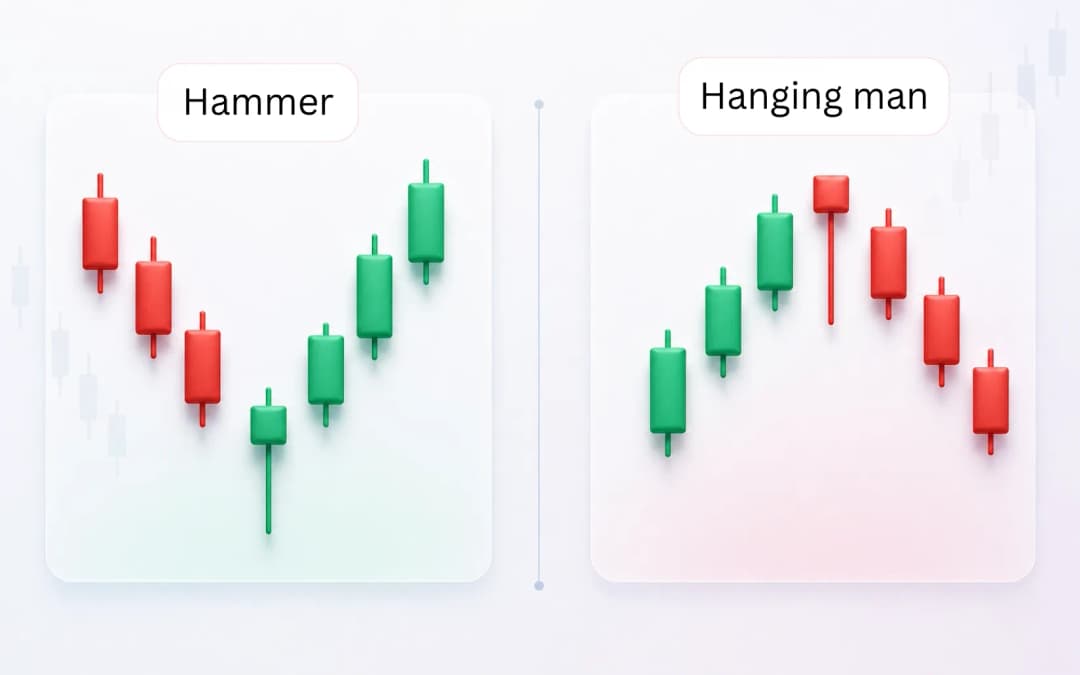
- The hammer and hanging man are visually identical single-candlestick patterns that signal potential price reversals.
- The primary difference between the two patterns is the market context; a hammer appears after a downtrend, while a hanging man appears after an uptrend.
- Both patterns feature a small real body near the top of the candle and a long lower shadow that is at least twice the length of the body.
- Trading these patterns requires confirmation from the subsequent candle to reduce the risk of false signals.
- Combining these signals with indicators like volume, RSI, and support/resistance levels significantly improves their reliability.
In technical analysis, candlestick charts represent the ongoing battle between buyers and sellers through candlesticks. Every session tells a story through the candle’s open, high, low, and close prices. Among the most recognisable characters in this story are single-candlestick patterns, which provide early warnings about shifts in market sentiment without requiring days of data to form. However, identifying these signals correctly requires more than just looking at the shape of a single candle; it requires an understanding of where that candle appears in the broader price trend.
Traders usually encounter two specific patterns that look exactly the same, but their meaning is totally different: the hammer and the hanging man. Because they look similar, beginners get confused between the two and misinterpret them. Many times this leads to mistimed entries or exits and incurring losses.
A candle that looks like a sign of strength in one scenario can be a glaring warning of weakness in another. This article provides a comprehensive guide to distinguishing these two patterns, understanding the market psychology behind them, and implementing structured trading strategies to use them effectively in live markets.
Understanding the visual structure of these patterns
Before diving into the differences, it is essential to understand the "anatomy" that both the hammer and the hanging man share. Both patterns are defined by a specific physical structure that stands out on a chart. They consist of a small real body located at the upper end of the price range. This small body indicates that despite the volatility experienced during the session, the opening and closing prices ended up relatively close to each other.
The most important feature of any hammer or hanging man pattern is the long lower shadow, also known as a wick. For a valid pattern, its lower shadow should be two to three times the size of the real body. The long wick represents that the prices are pushed significantly lower but buyers pushed them higher again near the open.
Additionally, these patterns have little to no upper shadow, suggesting that the closing price was near or at the session's high. While the colour of the body (green or red) can provide slight hints about momentum, the physical shape and the preceding trend are far more critical for identification.
What is the Hammer Pattern?
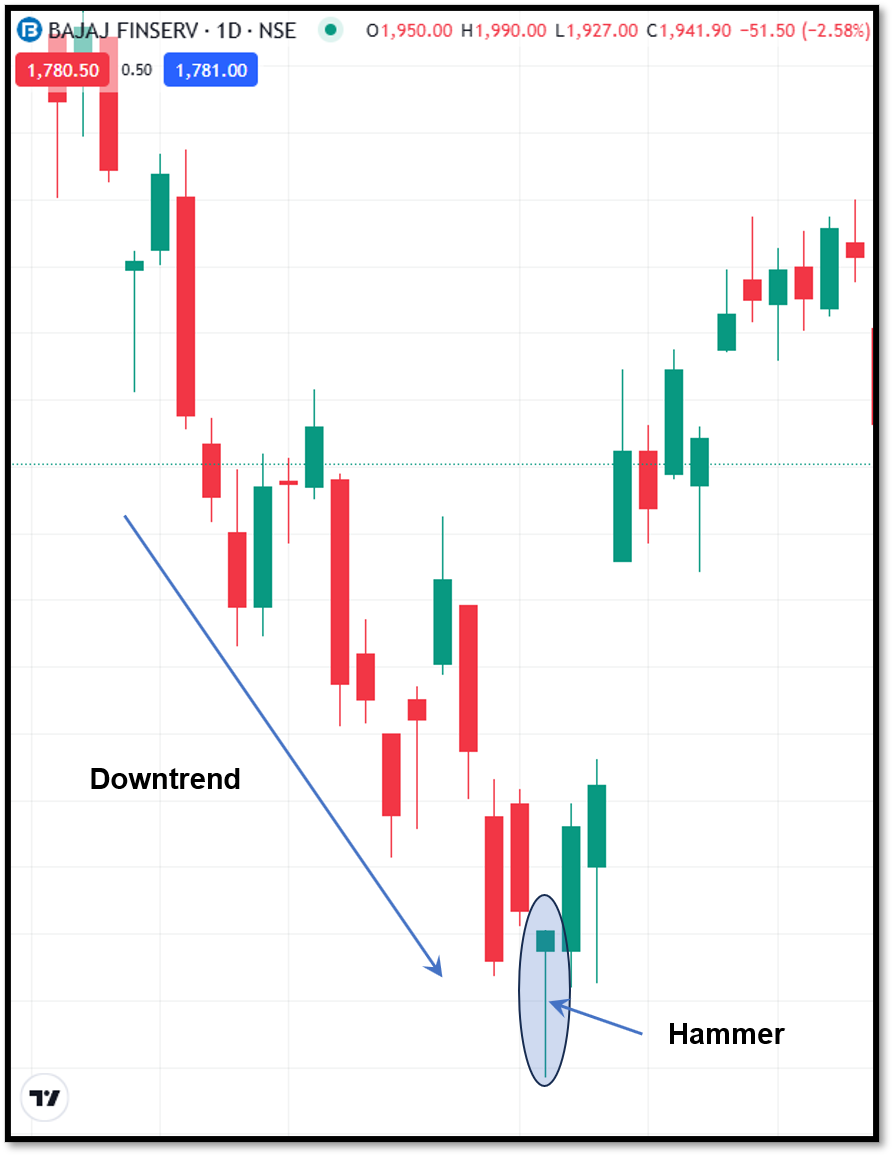
The hammer is a bullish reversal pattern that occurs at the bottom of a clear downtrend. It serves as a signal that the selling pressure, which has been driving prices lower, is finally beginning to exhaust itself. When a hammer forms, it suggests that even though sellers were able to push the price to new lows during the session, buyers stepped in with enough conviction to drive the price back up toward the opening level.
A hammer pattern that forms near a significant support level or after a long decline carries far more significance than a hammer pattern that forms in a ranging or choppy market. When prices are rejected here, it often signals the start of a new up move when it isn’t rejected.
What is the Hanging Man Pattern?
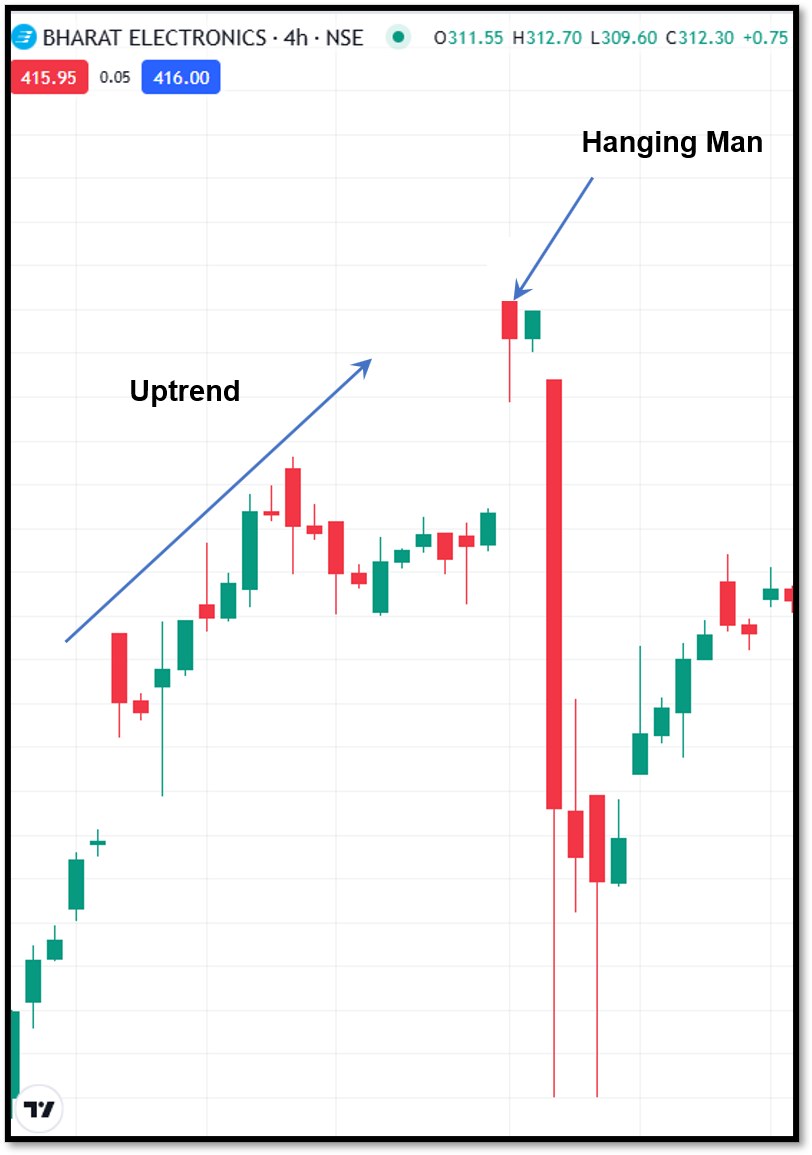
A bearish counterpart to the hammer is the hanging man pattern. Despite having the same physical appearance, it forms at the peak of an uptrend or near major resistance levels. It is a warning signal for bulls that selling pressure is starting to creep into a market that previously seemed unstoppable.
The appearance of a hanging man suggests that for the first time in the current trend, sellers were able to push prices significantly lower during the session. Although buyers managed to recover the price by the close, the long lower shadow proves that the "floor" is no longer as solid as it once was. It hints that the prevailing bullish momentum is weakening and that a reversal or a period of profit-booking might be imminent.
Why market context is the ultimate decider
The single most important rule in candlestick analysis is that context is king. A "hammer-shaped" candle has no inherent meaning until you look at the candles that came before it. If you see this shape after the market has been falling for several days, it is a hammer a potential sign of a floor being established. If you see the exact same shape after the market has been rallying for several days, it is a hanging man a sign that the ceiling might be nearby.
Professional traders also look for confluence of signals. For instance, a hammer is much more reliable if it forms near a historical support line or a major moving average. Also, the hanging man can be more reliable when technical oscillators such as the Relative Strength Index (RSI) line are in an overbought condition. These patterns, if used in isolation, are more likely to generate false signals.
The psychology of the tug-of-war
To trade these patterns effectively, you must visualise the emotions of the market participants. In a hammer scenario, the market is filled with pessimism. Sellers are in control, but as the price hits a new low, it reaches a point where buyers see value. The aggressive recovery creates the long wick, leaving sellers who sold at the bottom in a losing position and emboldening buyers who are ready to take over.
In a hanging man scenario, the mood is generally optimistic. However, the sudden, deep drop during the session the one that creates the long lower shadow shocks the market. It signals that there is enough "supply" or selling interest to overwhelm the buyers, even if only temporarily. While the price closes near the top, the mere fact that such a drop occurred suggests that the bulls are losing their absolute grip on the trend.
Hammer vs Hanging Man: Key differences
Although the appearance of hammer and hanging man is nearly identical, their interpretation changes depending on market context.
How to trade these patterns with confirmation
Prudent traders never enter a position based solely on the appearance of a single hammer or hanging man. Because these are "reversal" signals, they require confirmation from the very next candle to prove that a trend change is actually happening. Confirmation acts as a filter to keep you out of trades where the previous trend is simply taking a brief pause before continuing in its original direction.
For a hammer, confirmation occurs when the next candle closes above the high of the hammer candle. This confirms that the buying pressure seen in the wick is sustaining. For a hanging man, confirmation occurs when the following candle closes below the body of the hanging man. This proves that the selling pressure hinted at by the long wick is now becoming the dominant force in the market.
Strategic use of technical indicators for better accuracy
Although the candlestick patterns are powerful, they should be used as part of a larger toolkit. Volume is one of the most important secondary indicators to watch. A hammer or hanging man accompanied by high trading volume is much more significant than one on low volume. High volume indicates that a large number of market participants are active at those price levels, adding "weight" to the signal.
Momentum oscillators such as the RSI or MACD can also be quite informative. When the RSI is below 30 (oversold), the chances of a bullish reversal are higher if a hammer forms. If the RSI is above 70 (overbought) and a hanging man shows up, the bearish reversal may be coming.
To Summarize
The hammer and hanging man patterns are essential tools for any trader. They can be used for identifying market turning points, which can be great opportunities. Although both patterns are identical in appearance, the market context matters the most while analysing them. A hammer forms after a prolonged downtrend, while a hanging man pattern forms after a strong rally. Both patterns signal weakness in momentum.
Knowing the difference between the hammer and the hanging man will help you better understand the intricacies of market reversals. These patterns must be traded, waiting for confirmation, looking for confluence with other indicators, and strictly following risk management rules.
FAQs
Does the colour of the hammer or hanging man matter?
While both green and red candles are valid, a green hammer is slightly more bullish because it shows the close was higher than the open. Conversely, a red hanging man is slightly more bearish because it shows sellers managed to pull the price below the opening level by the end of the session.
Which timeframe is best for identifying these patterns?
These patterns work on all timeframes, but they are generally considered more reliable on higher timeframes like the daily or weekly charts. Lower timeframes often contain market noise that can lead to false signals.
Can a hammer appear in an uptrend?
Technically, if the same shape appears in an uptrend, it is called a hanging man. If it appears in the middle of a trend without a prior significant move, it may just be a variation of a "Doji" or a sign of temporary indecision rather than a reversal signal.
What is the difference between a hammer and an inverted hammer?
A hammer has a long lower shadow, while an inverted hammer has a long upper shadow. Both are bullish reversal patterns when they occur after a downtrend, but they represent different psychological shifts in the market.
How long should I wait for confirmation?
Usually, you should wait for the very next candle to close. If the next candle does not provide the necessary breakout or breakdown, the pattern's reliability diminishes, and it is often better to stay on the sidelines.







