Single Candlestick Patterns








Key takeaways
- Single candlestick patterns help traders identify potential trend reversals, continuations, and shifts in market sentiment using a single price candle.
- The reliability of candlestick patterns improves when they are combined with trend analysis, support and resistance levels, and volume confirmation.
- Traders should not act on just one candlestick and should seek confirmation from subsequent price action or technical indicators.
- Effective risk management (stop-loss placement and position sizing) is crucial when trading candlestick patterns.
Every trading session is a reflection of the war between buyers and sellers. Candlestick charts enable traders to visualise this war in a simple but powerful way.
Candlestick patterns are one of the many technical analysis tools available that are widely used to identify potential market reversals, continuations and trading opportunities. Single candlestick patterns are especially important as they can provide early signals about market sentiment with just one candle.
If you are a beginner learning technical analysis or an active trader looking to improve market timing, knowledge of single candlestick patterns can help you make more informed trading decisions.
What are Single Candlestick Patterns?
A single candlestick pattern is a price formation that is depicted by a single candle on a candlestick chart. These patterns provide indications as to the comparative strength of buyers vs sellers over a given trading period.
Each candlestick consists of:
- Open price
- High price
- Low price
- Close price
The body and shadow (wicks) of the candle provide important insight into market sentiment.
Compared to multi-candlestick patterns, which require two or more candles to confirm, single candlestick patterns can provide quick indications of possible trend reversals or continuations.
Understanding candlestick components
Before learning the patterns, it is important to know the structure of a candlestick.
Real body
The body represents the difference between the opening and closing prices.
- Green candle: Closing price is higher than the opening price.
- Red candle: Closing price is lower than the opening price.
Upper shadow
The upper wick shows the highest price reached during the session.
Lower shadow
The lower wick shows the lowest price reached during the session.
The size of the body and shadows help traders interpret market behaviour and identify patterns.
Why are Single Candlestick Patterns important?
Single candlestick patterns help the traders:
- Spot possible reversals
- Spot buying/selling pressure
- Get the market sentiment
- Optimise entry and exit timing
- Enhance technical indicators & chart patterns
But these patterns should not be used in isolation. It is often recommended to confirm by volume, support and resistance levels or other indicators.
Types of Single Candlestick Patterns
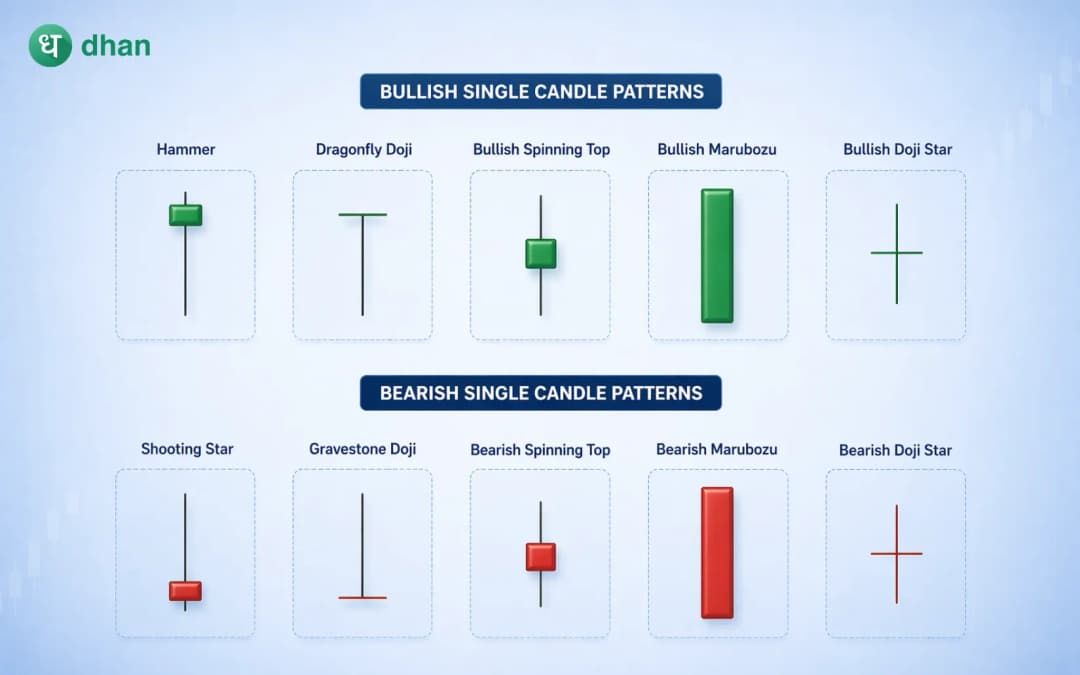
In general, single candlestick patterns can be divided into bullish and bearish signals.
- Bullish Patterns: These are patterns that suggest the price might move upwards.
- Bearish Patterns: Patterns that indicate a possible decline in price.
Let’s take a look at the most popular single candlestick patterns.
1. Hammer pattern
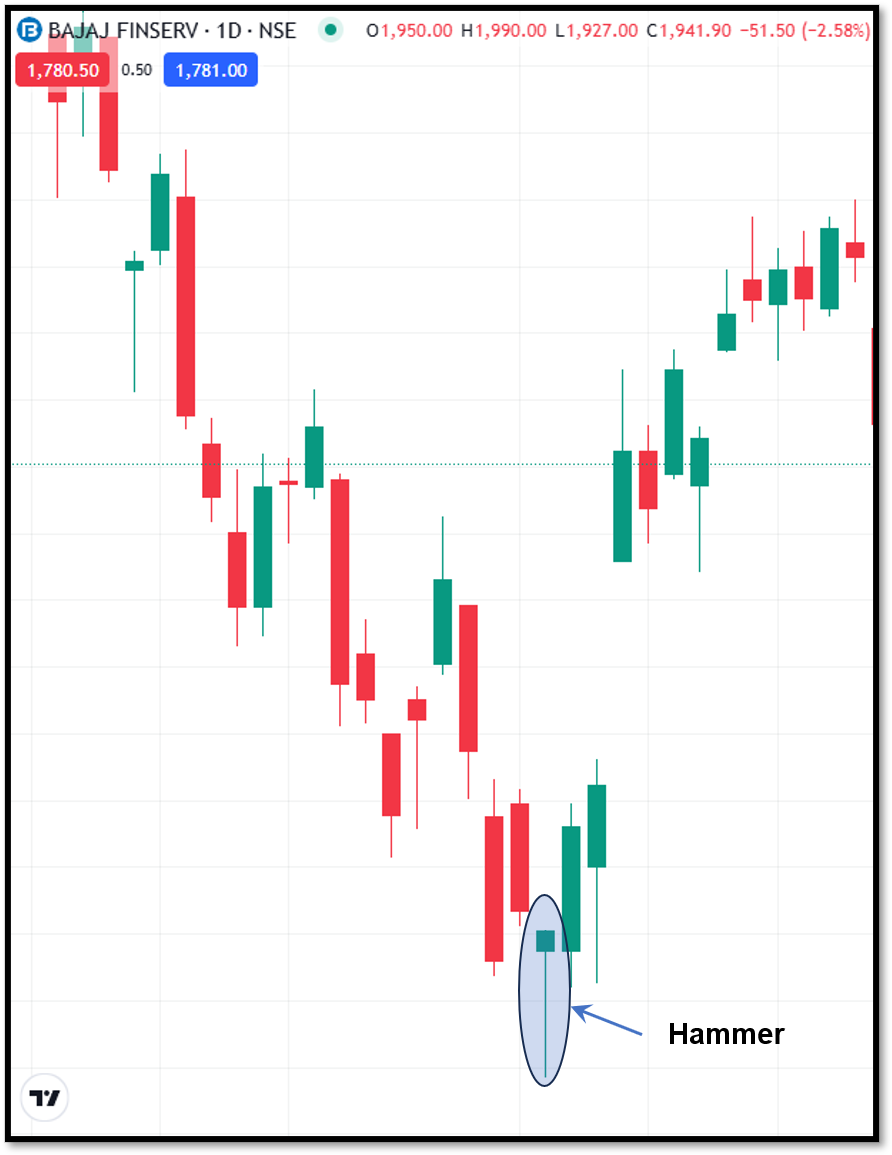
The Hammer is one of the most popular bullish reversal candlestick patterns. It normally appears following a downtrend and suggests that the pressure to sell may be easing.
A Hammer candlestick has:
- A small real body near the top of the candle
- Long lower shadow
- Upper shadow is little or none
- Downtrend after Formation
The long lower wick shows that sellers pushed prices much lower during the trading session. But buyers were back in control, driving prices higher by the close. This change in momentum could indicate a potential bullish reversal.
2. Inverted hammer pattern
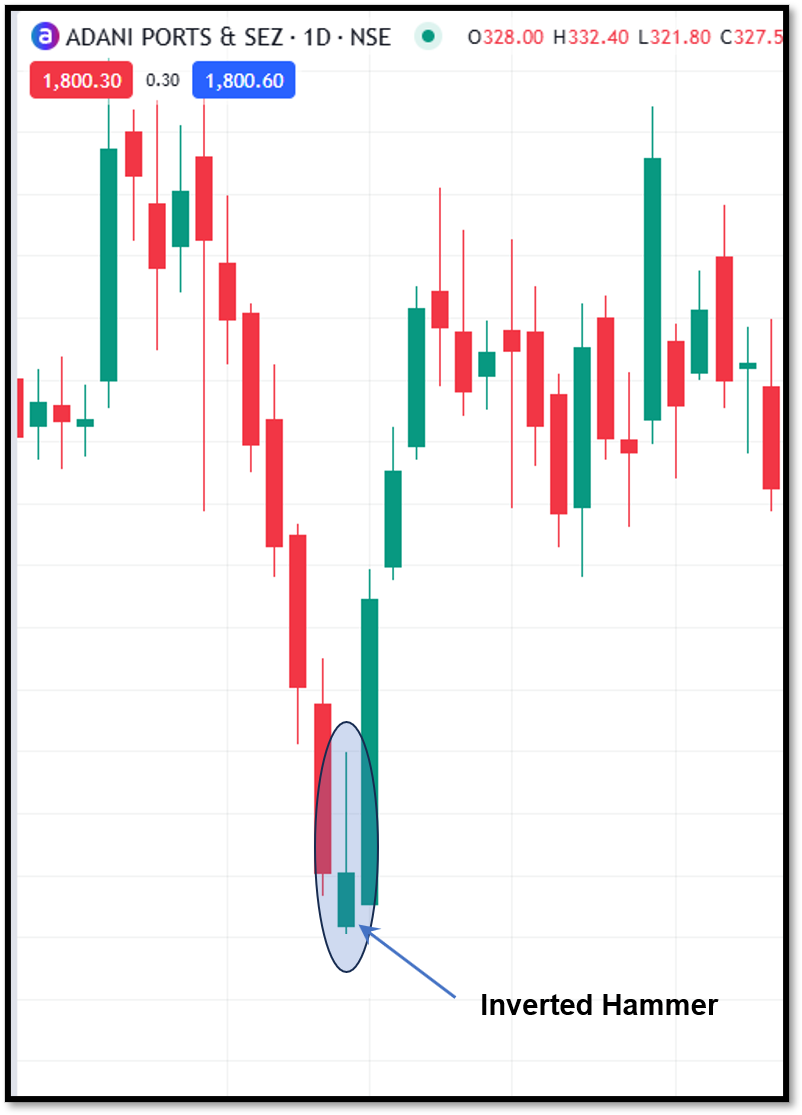
Another bullish reversal pattern is the Inverted Hammer, which usually forms after a downtrend. This means that the sellers are starting to face the buyers who are currently in control.
How to Identify an Inverted Hammer:
- A small body at the bottom of the candle
- Long upper shadow
- Lower shadow small or absent
- Formation after a downtrend
The long upper wick shows that the buyers tried to push prices higher during the session. Sellers managed to push the price back ahead of the close, but the buying action suggests bullish momentum may be building.
3. Hanging man pattern
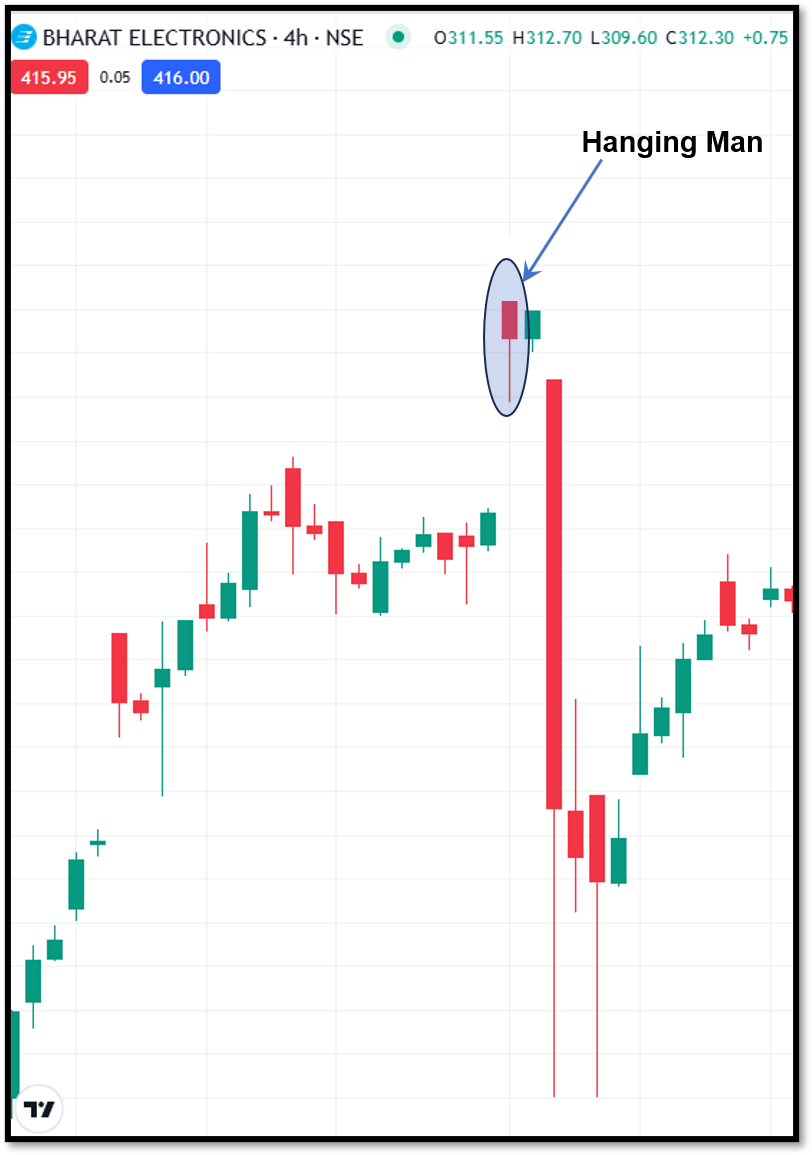
The Hanging Man is like a Hammer but has a different meaning because it forms after an uptrend. It is usually seen as a bearish reversal signal.
The pattern is characterised by:
- Small real body at the top of the candle
- Long lower shadow
- Minimal or no upper shadow
- Formation following an uptrend
The long lower wick means sellers managed to drive prices down significantly during the period. Buyers did recover some losses before the close, but the selling pressure could be a sign of weakening bullish momentum.
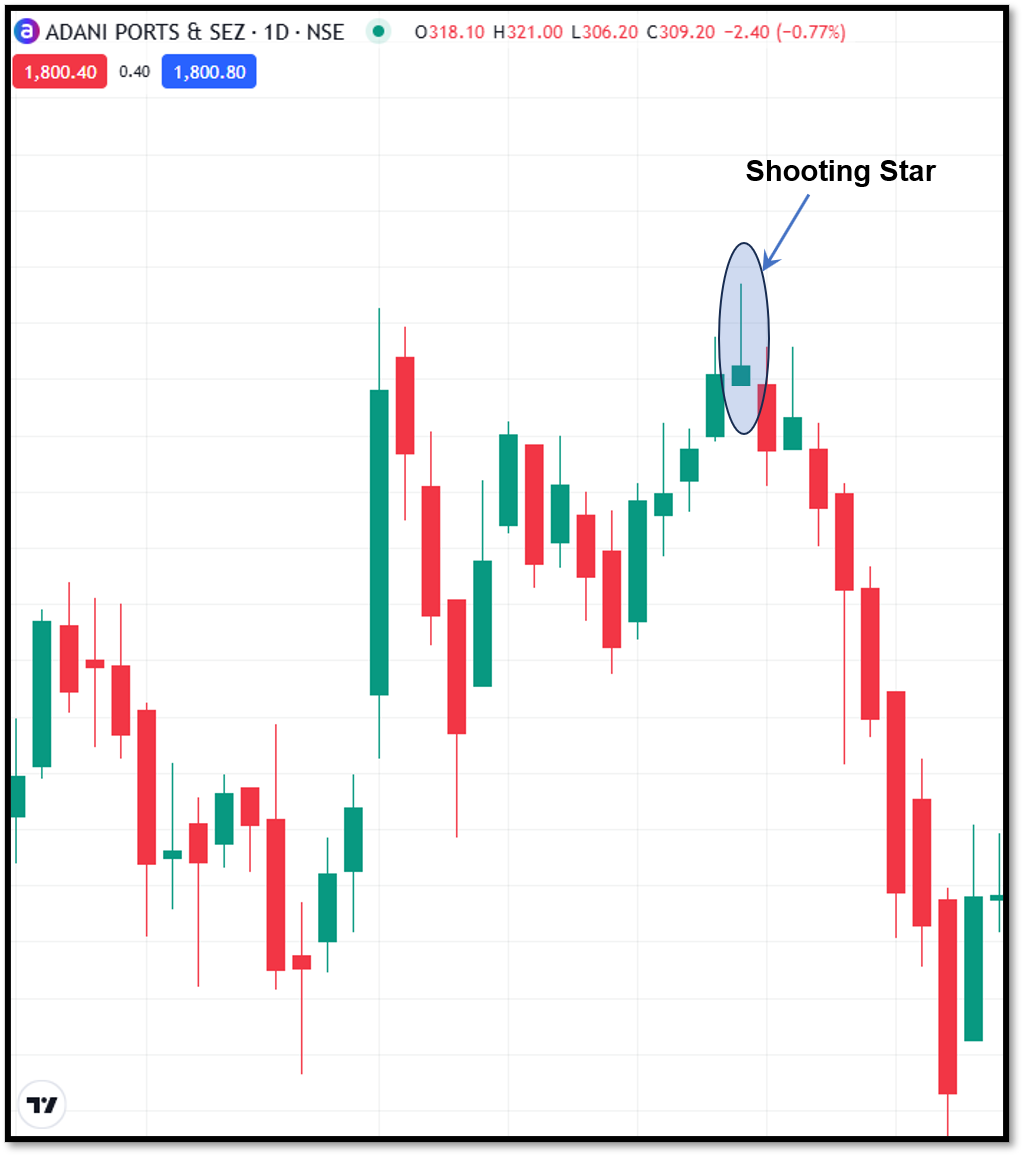
4. Shooting star pattern
The Shooting Star is a popular reversal pattern that occurs after an uptrend. It is a signal that buyers may be losing control of the market.
A Shooting Star is identified by:
- A small true body at the bottom of the candle
- Upper shadow long
- Small or no lower shadow
- Formation after uptrends
The long upper wick shows that buyers were able to push prices up substantially during the session. But sellers came into the market and forced prices back down before the close.
Such rejection to go higher often shows that selling pressure is mounting and can mark the beginning of a decline.
5. Doji pattern
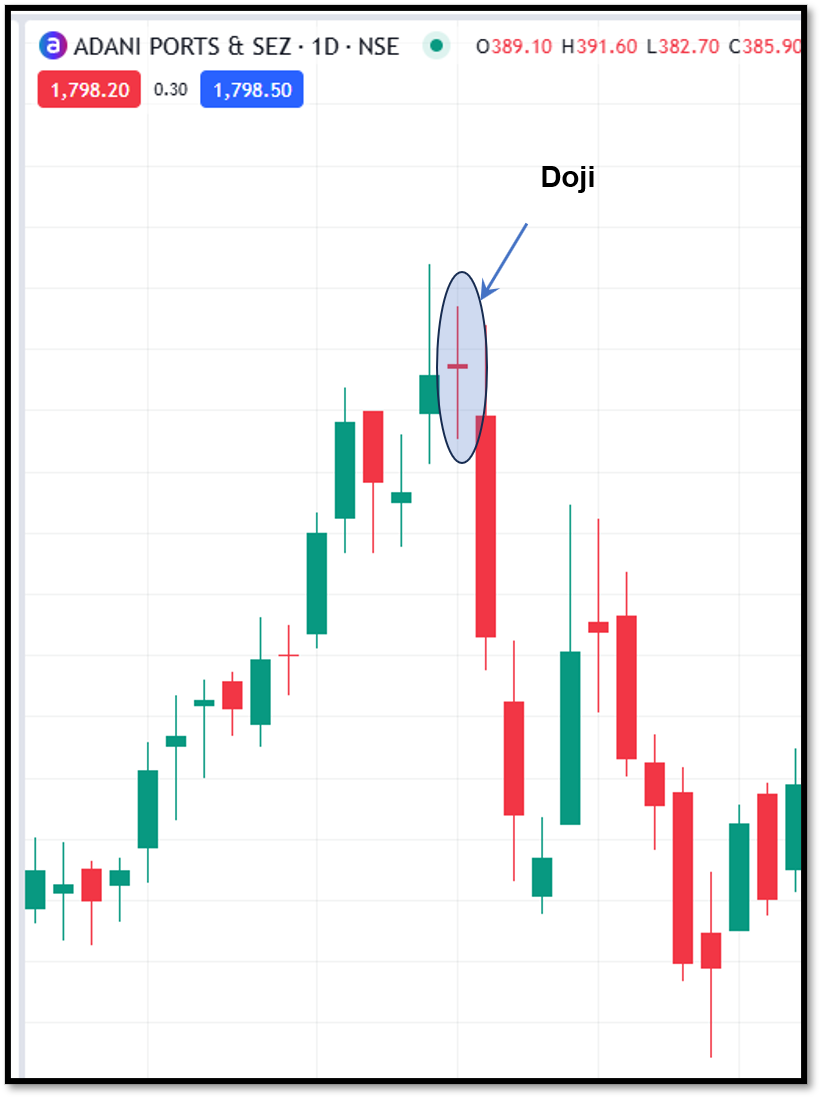
The Doji represents a pause in the momentum of the market. In the session, buyers and sellers both try to take control, but neither side manages to get on top.
A Doji typically features:
- Opening and closing prices that are almost equal
- A very small or non-existent body
- Upper and lower shadows of varying lengths
The pattern indicates that neither buyers nor sellers gained control in the trading session. This leads to uncertainty in the market.
A Doji can also be a sign that the current trend is losing momentum and a reversal may be coming, especially if it occurs after a sustained uptrend or downtrend.
Some common types of Doji include:
- Standard Doji
- Long-Legged Doji
- Dragonfly Doji
- Gravestone Doji
Each variant gives you a different look into the market sentiment and potential future price movements.
6. Marubozu pattern
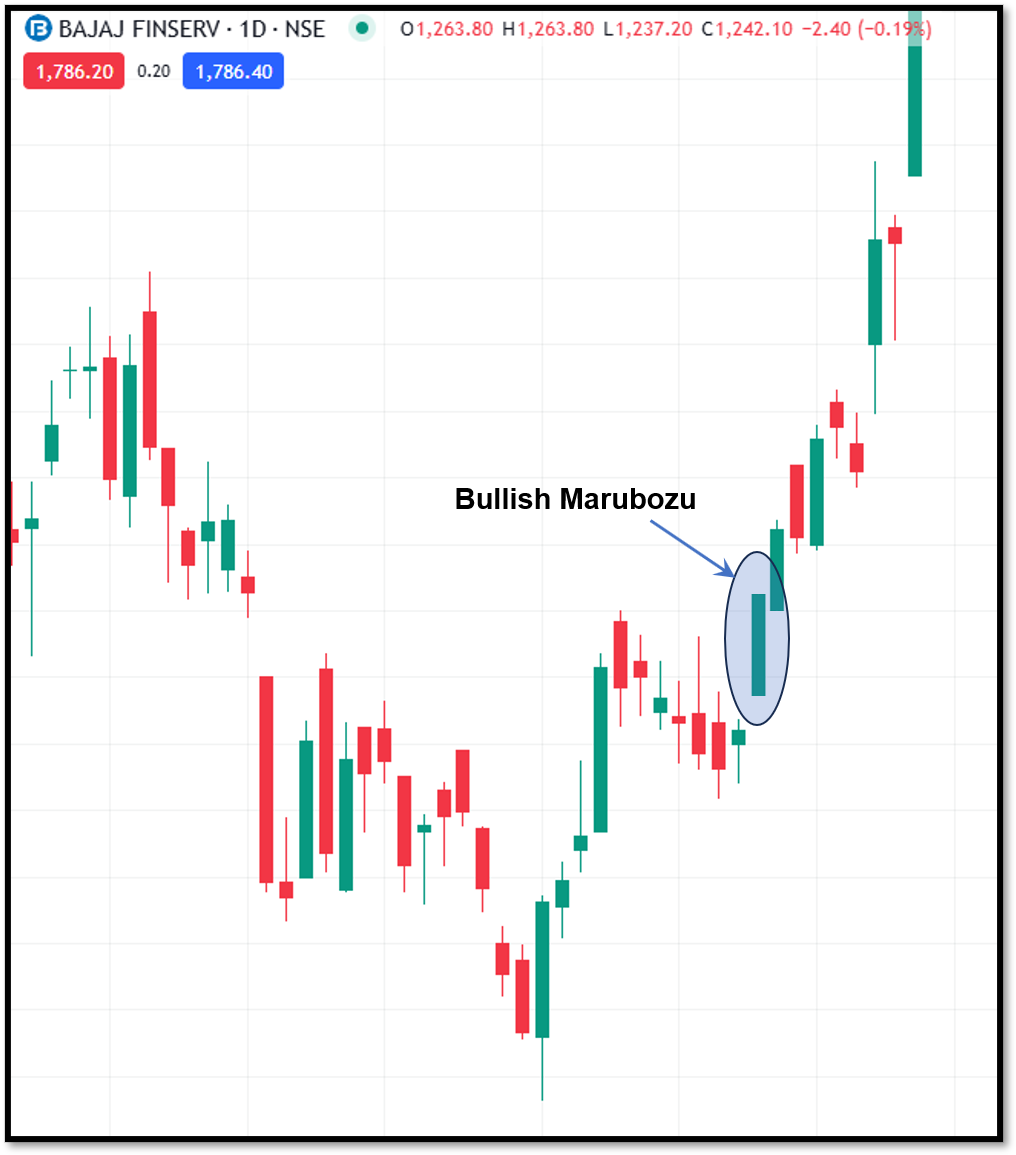
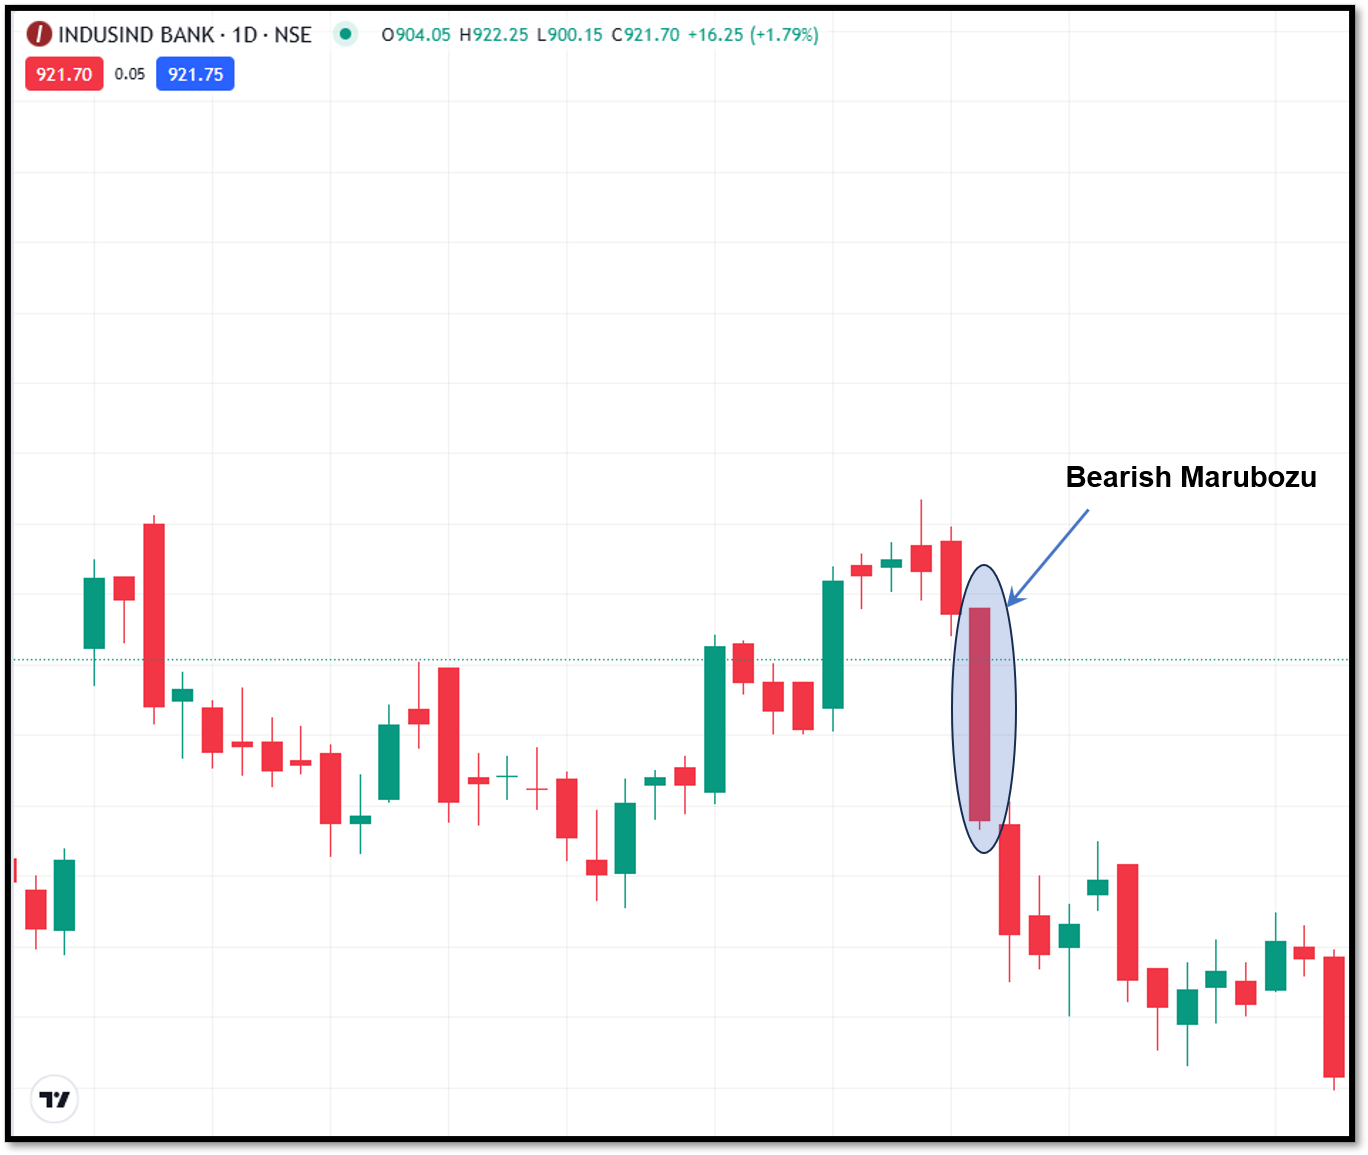
The Marubozu is a strong candlestick pattern that shows strong market sentiment. This is different from many other candlestick patterns and clearly shows the dominance of either the buyers or the sellers in the trading session.
A Marubozu candle is characterised by:
- A large real body
- No upper shadow
- No lower shadow
There are two primary types of Marubozu patterns.
A Bullish Marubozu is a strong green candle that shows buyers were in control from open to close. That’s a sign of strong buying interest and confidence in the market.
A bearish Marubozu is a strong red candle, indicating that sellers dominated the trading session. This indicates a strong selling pressure and bearish sentiment.
The Marubozu is often a sign of strong momentum and trend continuation. This can help traders identify high-conviction moves in the market when backed by volume and broader market conditions.
How to trade Single Candlestick Patterns effectively
Single candlestick patterns can provide useful clues about potential market direction, but if used in isolation, they can generate false signals.
Traders look at these patterns in the context of the larger market before deciding what to do.
1. Identify the trend first
A candlestick pattern carries more significance when viewed in the context of the prevailing trend. For example, a Hammer that appears after a long downtrend is more meaningful than a Hammer that appears in a sideways market.
Before acting on any pattern, determine whether the market is:
- In an uptrend
- In a downtrend
- Moving within a range
Trend analysis helps traders to figure out if a pattern is signalling a reversal, continuation or just short-term market noise.
2. Pay attention to key price levels
Candlestick patterns are often more reliable when they occur near important support and resistance levels.
Combining support and resistance levels with price action can result in better quality trading setups and reduce unnecessary trades taken.
3. Look for volume confirmation
Big volume usually equates to big conviction behind a price move. A candlestick pattern with above-average volume generally has more significance than one with low volume.
Volume confirmation helps traders to differentiate between meaningful signals and short-term price movements.
4. Combine candlestick patterns with technical indicators
Professional traders don’t just use candlestick patterns to trade. Instead, they combine it with technical indicators to make their analysis more reliable.
Some commonly used indicators include:
- Relative Strength Index (RSI) for detecting overbought and oversold levels
- Moving averages to identify trend direction
- MACD to identify momentum shifts
5. Wait for confirmation before entering a trade
One of the biggest mistakes traders make is jumping into a position immediately after spotting a candlestick pattern.
- The price action of the next candle
- Break of support or resistance
- Higher trading volume
- Technical indicators conformity
Confirmation lowers the chance of acting on the false signals so prevalent in volatile markets.
6. Set clear stop-loss and target levels
Finding the right pattern is as important as risk management. Even the most popular candlestick patterns can fail due to unexpected market events.
Define before you enter a trade:
- Stop-loss level according to the pattern structure
- A realistic goal of profit
- Position sizing appropriate based on trading capital
Mistakes to avoid when using candlestick patterns
Don’t make these common candlestick pattern mistakes:
Trading without confirmation
A trade based on a single candle can give false signals. Always seek confirmation from the next candle, volume or other indicators.
Ignoring market context
A candlestick pattern is more reliable when analysed alongside the overall trend and key support or resistance levels.
Overtrading
Not every candlestick pattern presents a trading opportunity. Focus on high-probability setups instead of trading every signal.
Neglecting risk management
Even strong patterns can fail. Always use stop-loss orders and maintain a favourable risk-reward ratio.
Relying only on candlestick patterns
Candlestick patterns work best when combined with technical indicators, volume analysis, and trend confirmation.
To wrap up
Single candlestick patterns are one of the most popular tools in technical analysis. Hammer, Inverted Hammer, Hanging Man, Shooting Star, Doji and Marubozu are some of the candlestick patterns that help traders understand market sentiment and possible price direction.
Candlestick patterns are most effective when used in conjunction with trend analysis, support and resistance levels, volume confirmation, and proper risk management.
By learning to recognise these formations and using advanced charting tools available on platforms, traders can enhance their ability to identify opportunities and make more informed trading decisions.
FAQs
1. What are single candlestick patterns?
Single candlestick patterns are technical chart patterns consisting of one candle, which assist traders in recognising potential trend reversals or continuations.
2. Which single candlestick pattern is considered bullish?
Inverted Hammer and Hammer are generally seen as bullish reversal patterns if they occur following a downtrend.
3. Is a Doji always a reversal signal?
No. A Doji represents market indecision. Usually requires confirmation from subsequent price action.
4. Can single candlestick patterns be used for intraday trading?
Yes. These patterns are used by traders for various time frames like intraday, swing trading and positional trading.
5. Are candlestick patterns reliable?
Combining candlestick patterns with technical indicators, support and resistance analysis and proper risk management can be very effective.