



In Neck Line Candlestick Pattern







Key takeaways
- In Neck Line is a two candlestick bearish continuation pattern, which forms in a well-established downtrend.
- It signifies that buyers tried to bounce back after a sharp fall but failed to generate enough momentum to reverse the trend.
- The pattern shows ongoing selling pressure, indicating that the current downtrend may continue.
- Traders should wait for confirmation from the next candle or other technical indicators before entering a trade.
- The pattern is more reliable when it appears after a prolonged downtrend, near support and resistance levels, and other technical indicators.
‘Should I buy this bounce, or is the downtrend still in place?’
Traders face such dilemmas whenever there is a price recovery after a sharp decrease. A single bullish session creates hopes of improvement; however, experienced traders know that not all bounces indicate the beginning of an uptrend. Oftentimes, sellers just pause before continuing the decline.
The In Neck Line candlestick pattern helps identify such market circumstances. It highlights that buyers try to drive prices up but are unable to fight against the strong selling pressure, which leads to a higher chance of continuing the bearish trend.
This guide explains the In Neck Line candlestick pattern in detail, what it means, how to identify it on a chart, and how to trade with it effectively.
What is the In Neck Line Candlestick Pattern?
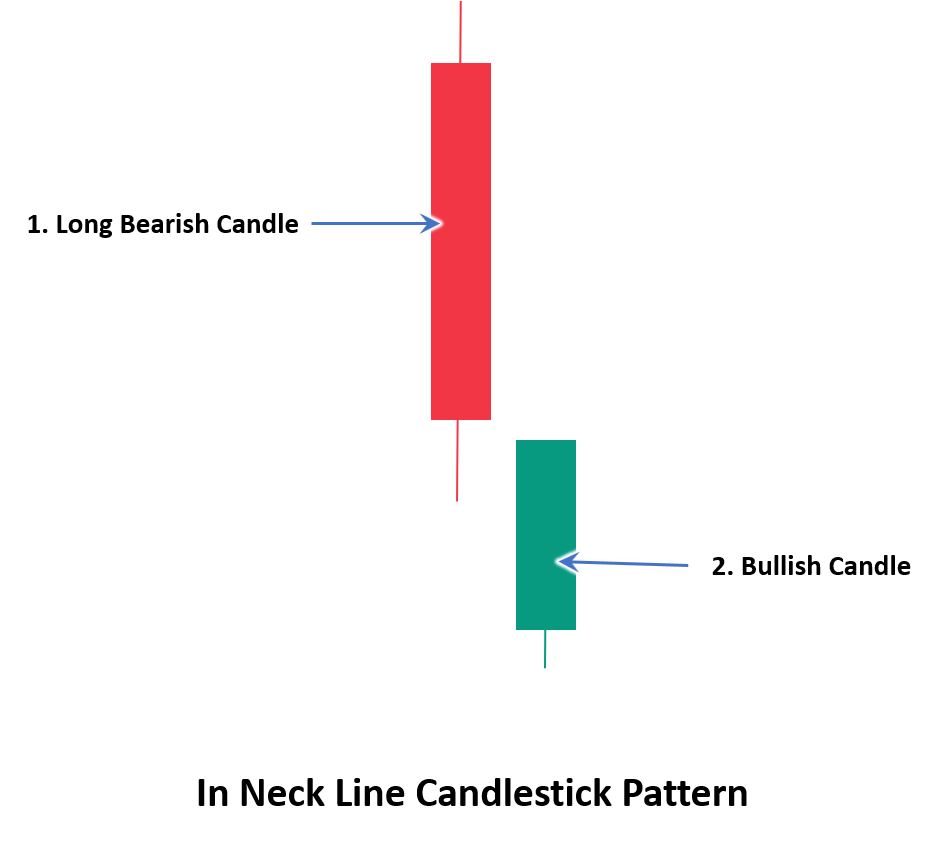
The In Neck Line is a two-candlestick bearish continuation pattern that occurs during an established downtrend. It indicates that bulls try to drive prices upwards after a strong bearish session, but they cannot get enough momentum to reverse the trend.
The pattern consists of a long bearish candle followed by a small bullish candle which closes above the previous candle’s low. This weak bounce suggests strong bearish sentiment in the market, thus increasing the chances of continuation of the downtrend.
Structure of the IIn Neck Line Candlestick Pattern
It consists of two candles, each playing its specific role:
First candle: The first candle is a long bearish candle indicating strong selling pressure. It confirms that the bears have good control over the market and the downtrend continues.
Second candle: The second candle opens below the low of the previous candle. The buyers tried to reverse, but the candle closes above the previous low, indicating that buying power is still weak.
What does the IIn Neck Line Candlestick Pattern indicate?
The In Neck Line candlestick pattern shows weak buying interest during a strong downtrend. Following a steep drop, buyers step in to raise prices marginally; however, they cannot sustain sufficient momentum to confront the sellers.
It indicates to traders that the current rebound is probably a short-term increase rather than the start of a new upward trend. With sellers continuing to control the market, the formation shows that prices could continue to fall.
How to identify the In Neck Line Candlestick Pattern
Before treating any formation as an In Neck Line candlestick pattern, verify all of the following features:
A clear prior downtrend
The first step is to identify a clear downtrend. The pattern has no significance if it appears in a sideways market.
Long bearish first candle
The first candle must be a long bearish candle. This confirms that there is high selling pressure and sellers are in control.
Limited bullish recovery
The second candle opens below the low of the previous day’s candle and closes higher than it, which indicates that buying pressure remains weak.
Close near the previous low
The second candle must close near the low of the first candle, not inside it. This makes it different from bullish reversal patterns.
Confirming candle
The pattern is confirmed only if the next candle closes below the low of the In Neck Line pattern.
How to trade the In Neck Line Candlestick Pattern
Once you have identified a valid In Neck Line pattern, the next step is executing the trade. Here are a few strategies:
Wait for confirmation
Do not trade immediately after the pattern forms. Wait for the next candle to close lower or break below the recent low. Entering too early without confirmation can catch you in a false signal.
Enter the trade
Determine a suitable entry point once the pattern completes. Experienced traders wait for a pullback first before entering a trade, whereas aggressive traders enter immediately once the confirming candle has closed.
Set stop-loss
Risk management remains important. Most often, traders set their stop-loss order above the high of the second candle because going over this level would make the pattern invalid.
Target setting
Set profit targets using previous trend measurements or key support and resistance levels to secure profits while upholding risk management principles.
Combine it with technical indicators
Many traders use technical indicators to confirm a potential continuation. Some popular indicators include the Relative Strength Index, MACD, and Moving Averages. If multiple technical indicators point in the same direction, traders feel more confident in their trading strategy.
Advantages of the In Neck Line Candlestick Pattern
Some advantages of the In Neck Line candlestick pattern are:
Easy to spot: It does not require any difficult calculations or advanced technical knowledge, as two candles with almost similar closing prices can be easily identified on a candlestick chart.
Supports trend following trades: The pattern allows traders to identify opportunities to trade in line with the prevailing downtrend rather than trying to predict a reversal.
Shows weak buying pressure: It shows that buyers tried to push prices upward but were unsuccessful, indicating that sellers continue to dominate the market.
Provides an early continuation signal: It warns traders about the continued downtrend before the next major price decline starts.
Improves trade planning: The pattern provides distinct points for entry, stop-loss, and target levels, making trade planning and risk management a simple process.
Limitations of the In Neck Line Candlestick Pattern
Some limitations of the In Neck Line candlestick pattern are:
Less reliable in volatile markets: The pattern is not reliable in sideways or highly volatile markets where price movements are usually caused by short-term fluctuations rather than actual trend changes.
Always needs confirmation: The pattern does not confirm a trend reversal on its own, so it always needs confirmation.
Risk of false signals: Getting into a trade immediately after the formation of the pattern without waiting for a confirmation signal may put traders at risk of false breaks.
Easy to confuse with similar patterns: The In Neck Line pattern looks very similar to other patterns like On Neck Line, which causes incorrect analysis of the market.
No price target: Although the neckline indicates a possible continuation of the price drop, it fails to give a clear indication of how far the decline is likely to go.
Trading tips for the In Neck Line Candlestick Pattern
Here are some important tips traders should consider before entering a trade:
Don't trade in weak downtrends
This pattern works best if it occurs in a well-established downtrend. In a sideways or consolidating market, the continuation signal loses its reliability.
Evaluate the strength of the initial bearish move
A stronger first bearish candle generally enhances the significance of the pattern. It indicates that sellers are in a strong position, making it challenging for buyers to reverse the trend.
Don't ignore nearby support levels
The pattern holds more significance when it appears near a strong resistance level or during an extended downward move. This reduces the chances of a successful bearish continuation.
Wait for sellers to regain control
Most traders wait for the next candle to close below the pattern before getting into a position. The additional confirmation indicates that selling pressure continues, and this helps to avoid false signals
Set realistic expectations
While the In Neck Line pattern implies the downtrend may continue, it gives no signal on the extent of the drop. To trade and lock profits effectively, traders should always put reasonable profit targets as per market structure.
Wrapping up
The In Neck Line candlestick pattern is a simple and effective bearish continuation pattern indicating that the market is unable to hold any buying recovery during a downtrend. Although it may assist traders in spotting possible continuation opportunities, confirmation from price action, volume analysis, or other technical indicators is necessary. Using this pattern with a well-organised trading strategy can help traders make better trading decisions.
FAQs
Why is it called the In Neck Line pattern?
The name of this pattern comes from the fact that the second candle closes just inside the first candle’s low, rather than closing exactly at the low. This slight variation sets it apart from the On Neck Line pattern.
Does the In Neck Line pattern change into a reversal signal?
Yes. If subsequent candles show strong bullish momentum and break above key areas of resistance, what seemed like a bearish continuation signal actually turns into a bullish reversal. That is why traders seek additional confirmation before entering a trade.
Does the size of the second candle matter?
Yes. The second bullish candle should show only a moderate level of recovery. If it closes within the first bearish candle or completely covers it, then the pattern is no longer considered an In Neck Line and may signal a potential bullish reversal.
Does the In Neck Line pattern work better in highly liquid markets?
Yes. Markets with strong trading activity provide good opportunities to identify reliable chart patterns, because price movements are influenced by robust market participation and are less vulnerable to sudden price fluctuations.
Can traders use In Neck Line pattern with moving averages?
Yes. Traders use moving averages to identify the overall trend. If the pattern occurs while prices are below the moving average, it adds extra support to the bearish continuation signal.







