



Keltner Channels vs Bollinger Bands








Key takeaways
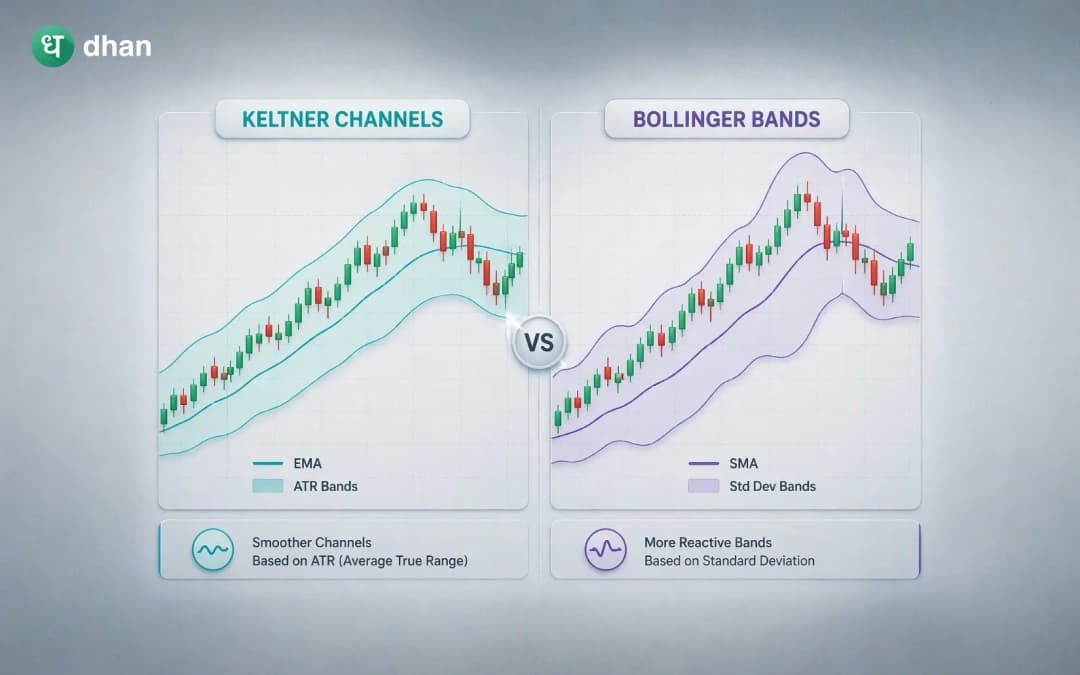
- Keltner Channels and Bollinger Bands are volatility-based indicators that help traders identify market conditions and volatility.
- Bollinger Bands use standard deviation to measure volatility, making them more responsive to sudden price fluctuations.
- Keltner Channels use Average True Range (ATR), which generally creates smoother and more stable channel boundaries.
- Bollinger Bands are often preferred for identifying volatility expansions and contractions.
- Keltner Channels are commonly used by traders who want clearer trend identification and fewer false signals.
Volatility is one of the most important concepts in trading. It influences price movement, risk levels, trade opportunities, and market behaviour. While many traders focus on predicting direction, experienced market participants also pay close attention to how aggressively prices are moving.
To measure and visualise volatility, traders often rely on technical indicators that place dynamic bands around price action. Two of the most popular tools for this purpose are Keltner Channels and Bollinger Bands.
At first glance, these indicators look remarkably similar. Both consist of a middle line surrounded by upper and lower bands that expand and contract based on market activity. Because of this visual similarity, many beginner traders assume they provide identical information.
The two indicators are built using different calculations and usually generate different trading signals. Understanding these differences can help traders choose the tool that best aligns with their trading approach.
What are Bollinger Bands?
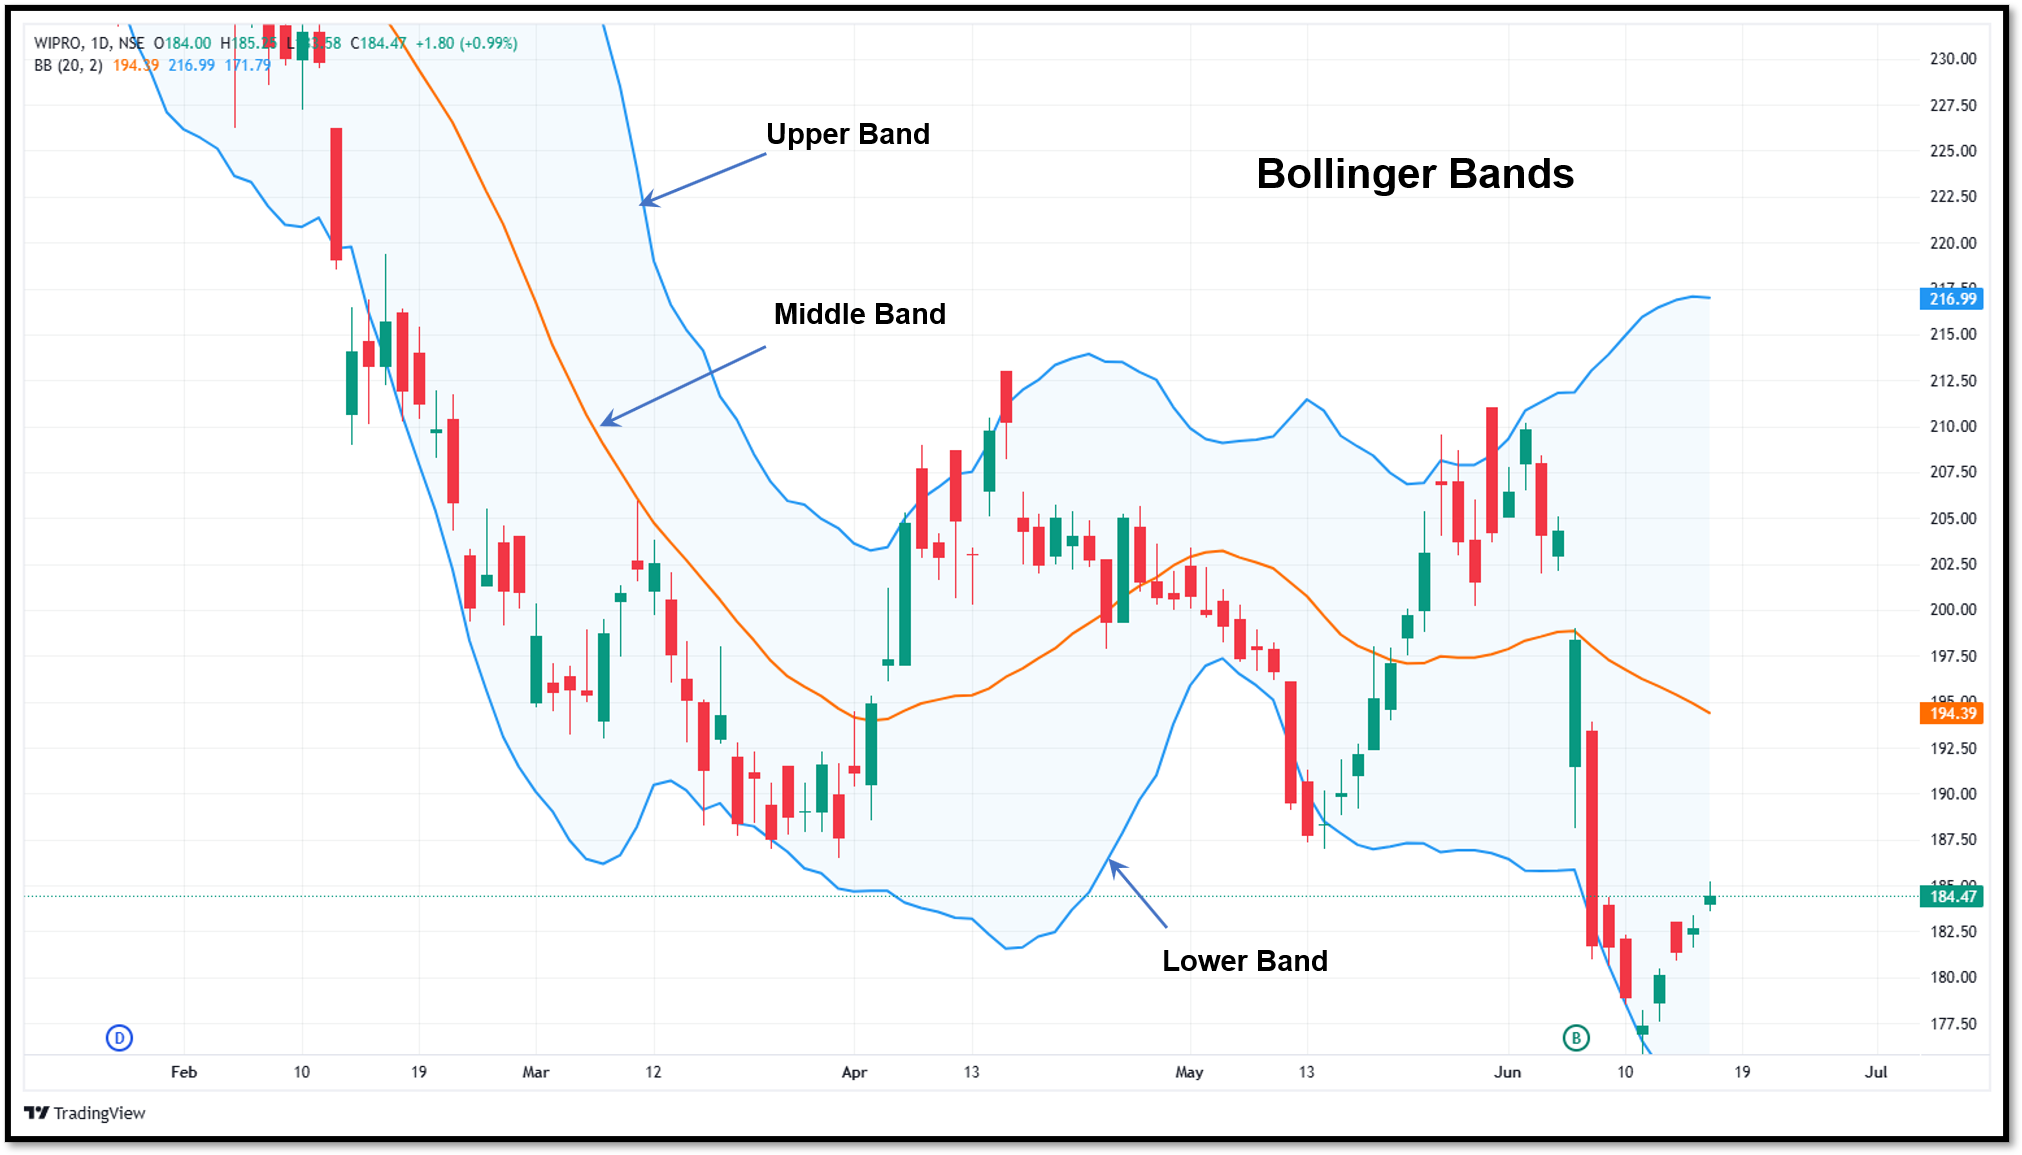
Bollinger Bands were developed by technical analyst John Bollinger.
The indicator consists of three lines:
- A middle moving average, typically a 20-period simple moving average
- An upper band
- A lower band
The distance between the bands is determined by standard deviation, a statistical measure that reflects how far prices move away from their average. When volatility increases, the bands widen. When volatility decreases, the bands contract.
This ability to adapt to changing market conditions makes Bollinger Bands useful for identifying periods of expansion and contraction in price activity.
What are Keltner Channels?
Keltner Channels are another volatility-based indicator that surrounds price with upper and lower channel lines.
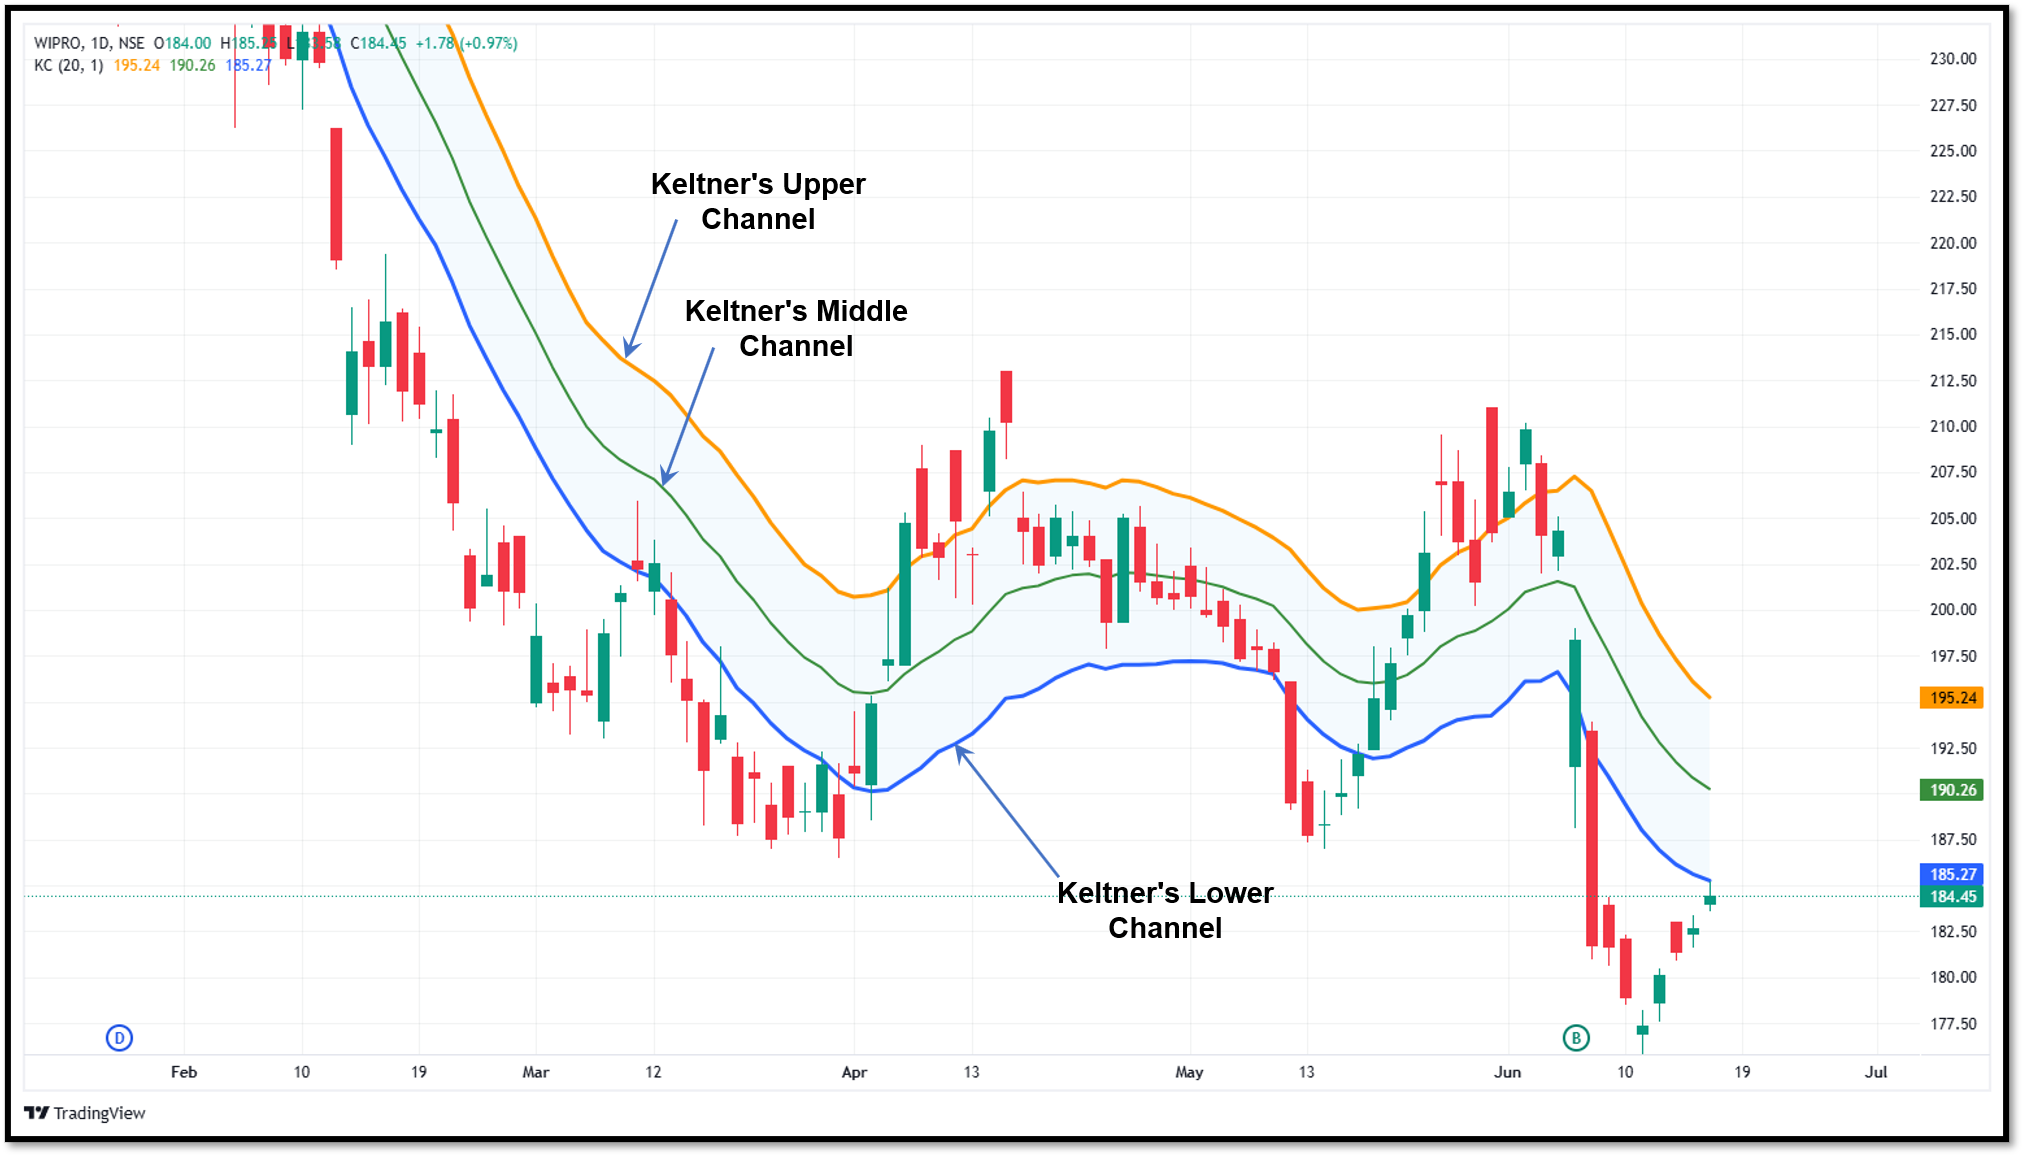
The structure also includes three components:
- A middle exponential moving average (EMA)
- An upper channel
- A lower channel
But, instead of using standard deviation, Keltner Channels use Average True Range (ATR) to calculate channel width. ATR measures market volatility by examining the average range between high and low prices over a specific period.
AS ATR tends to smooth volatility fluctuations, Keltner Channels usually appear more stable and less reactive than Bollinger Bands.
Difference between Keltner Channels and Bollinger Bands
Keltner channels and Bollinger bands are both volatility indicators. But they have the following key difference.
- Keltner Channels use Average True Range (ATR) to determine channel width, while Bollinger Bands use standard deviations.
- The middle line of keltner Channels is generally a 20-period EMA, while the Bollinger Bands use a 20-period SMA.
- The kelterner channels are Less sensitive and produce smoother channels. Bollinger Bands are more sensitive and react quickly to volatility changes.
- Due to lower sensitivity, Keltner channels expand and contract slowly or gradually, while Bollinger Bands show rapid changes in the bandwidth.
- The Keltner Channels are best suited for trend-following and momentum trading. Bollinger Bands are primarily used for volatility and mean-reversion trading.
- Keltner channels perform well in trending markets. Bollinger Bands are effective in a sideways market.
- The Keltner Channels generate fewer signals than the Bollinger Bands due to smoother calculations.
- The Keltner Channels are better at filtering noise in the short-term market. The Bollinger Bands usually react to temporary price spikes.
- The key strength of Keltner Channels is that it provides a cleaner view of trend direction. The Bollinger Bands highlight the changes in market volatility effectively.
- Limitations of the indicators include keltner channels react slowly to sudden market moves, while the Bollinger Bands can react excessively to short-term price spikes, leading to false signals.
How each indicator reacts to volatility
Understanding volatility behaviour is the easiest way to see the difference between these indicators. Imagine a stock suddenly experiences a sharp earnings-related price movement.
Bollinger Bands will expand aggressively because the standard deviation calculation reacts quickly to unusual price activity.
Keltner Channels will also widen, but the adjustment is usually more gradual because ATR smooths the volatility measurement.
Hence, Bollinger Bands usually appear more dynamic, while Keltner Channels generally appear more stable.
Using Keltner Channels in trading
You can use the Keltner Channels in the following ways.
Trend identification
The Keltner Channels help traders to identify the overall trend of the market. If the price is consistently trading near the top channel, it may be indicating a strong uptrend. If the price remains near the lower channel, it may suggest strong selling pressure.
Dynamic support and resistance
Traders use the channel boundaries as dynamic support and resistance zones. They monitor how prices react around the channels during trending conditions.
Pullback trading
The Trend-following traders look for pullbacks toward the middle EMA. If the broader trend remains intact, these pullbacks may provide potential entry opportunities.
Using Bollinger Bands in trading
Bollinger Bands are commonly used for several purposes.
Identifying overextended prices
Traders use Bollinger bands to identify the overextended trends. If the price moves outside the upper band, it may suggest that the market is overextended upside. Similarly, touches near the lower band may portend a temporary downside extension.
Spotting volatility squeezes
This is a common strategy that traders usually look for. When the market moves sideways without any significant move, the Bollinger Bands start to squeeze. Periods of low volatility are usually followed by higher volatility, making squeezes useful for traders anticipating future breakouts.
Monitoring volatility expansion
Rapid band expansion usually signals increasing market activity. Traders monitor these periods to grab the opportunities by identifying emerging trends or breakouts.
Which indicator is better?
Both indicators are used in different market conditions.
In range-bound conditions, Bollinger Bands usually become more useful. Since the bands respond directly to changing volatility, they can highlight price extremes within established trading ranges.
When looking for potential mean-reversion opportunities, traders pay attention to when the price reaches the upper and lower bands. Also, the dynamic nature of Bollinger Bands can help identify situations where prices have moved unusually far from their recent average.
In trending markets, Keltner Channels often have an advantage. Their smoother structure can make trends easier to identify. Because the channels do not react as aggressively to short-term volatility spikes, traders may experience fewer misleading signals.
Trend-following traders frequently prefer Keltner Channels because they provide a cleaner view of momentum and directional movement. That does not mean Bollinger Bands are ineffective in trends.
However, their higher sensitivity can sometimes make price action appear more erratic.
To wrap up
The Keltner Channel and Bollinger Bands are volatility-based indicators, but they are used in different market conditions. The calculation methods are also different. The Keltner channels use ATR for defining the outer bands, while the Bollinger bands use standard deviation. Because of this, the Keltner channels are relatively less sensitive to sudden price moves, while the Bollinger Bands react quickly to price moves.
The Keltner Channels are more effective in trending markets, while the Bollinger Bands are more effective in range-bound markets. Understanding the difference between these indicators can help you make a better choice.
FAQs
Are Keltner Channels and Bollinger Bands the same?
No, they are not the same. Bollinger Bands use standard deviation to calculate band width, while Keltner Channels use Average True Range (ATR).
Can traders use both indicators together?
Yes. Many traders combine them, particularly when using squeeze-based strategies that compare Bollinger Bands with Keltner Channels.
Which indicator is better in a trending market?
Traders usually prefer the Keltners Channel for trending markets. Their smoother structure can make directional movement easier to identify.
Do Keltner Channels repaint or change past signals?
No. Like most technical indicators, Keltner Channels update as new price data becomes available, but they do not repaint historical values after a candle has closed.
Which indicator is more suitable for intraday trading?
Both can be used for intraday trading. The Bollinger Bands are usually favoured by short-term traders seeking volatility-based opportunities.







