



Mat Hold Candlestick Pattern




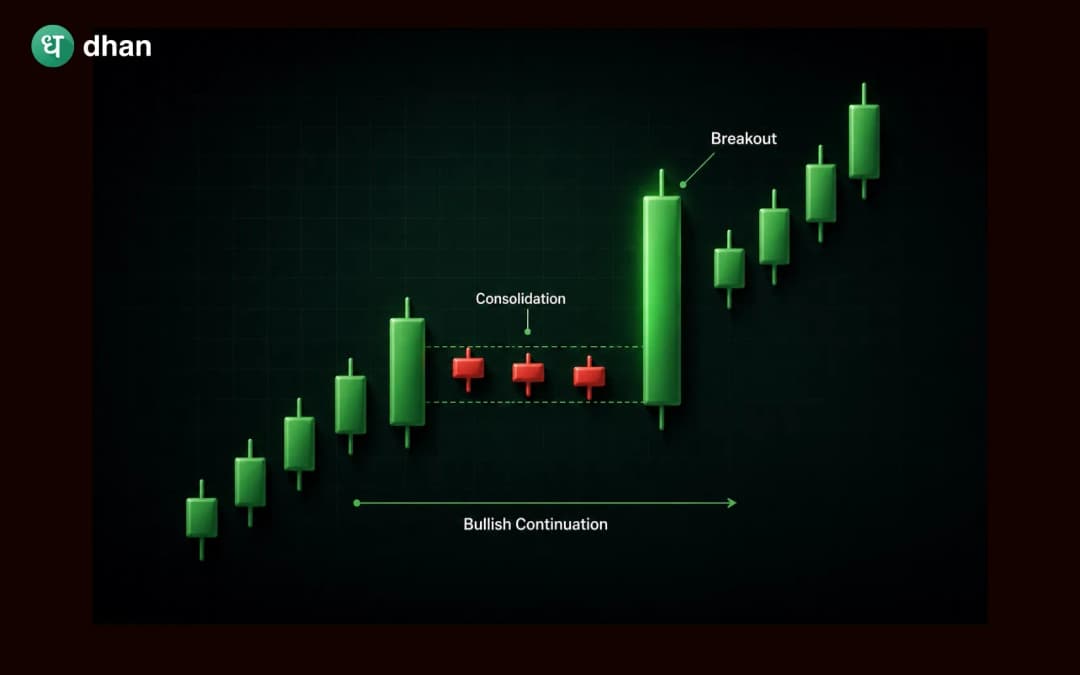




Key takeaways
- The mat hold is a five-candlestick continuation pattern that signals the likely continuation of an existing trend. It can appear in both bullish and bearish markets.
- The pattern represents a temporary pause in momentum rather than a trend reversal.
- A valid mat holds pattern forms only within an established trend. The fifth candlestick confirms whether the trend is ready to continue.
- Combining the pattern with volume, support and resistance levels, and technical indicators can improve trade confirmation.
Strong trends are typically one-directional without interruption. Prices tend to pause during a rally or a decline as traders take profits or rethink the market. These short-term pullbacks can sometimes be mistaken for a trend reversal, causing traders to exit positions prematurely.
The mat hold candlestick pattern is used to recognise a pullback that is likely to be temporary rather than the start of a reversal. This five candle continuation pattern suggests that the current trend may resume once the correction is over.
In this article, you will learn how the mat hold pattern is formed, how to identify bullish and bearish setups, how to trade it well, and what indicators are there to help you confirm the signal.
What is the Mat Hold Candlestick Pattern?
The mat hold candlestick pattern is a continuation pattern, consisting of five candlesticks, that signals this temporary pause.
The pattern in an uptrend shows that despite a small correction, buyers are still in control. In a downtrend, it shows that the sellers are still in control of the market after a short rally.
The mat hold pattern is not very frequent but is liked for its clear entry, stop-loss and confirmation levels. Traders should confirm the pattern with volume, support and resistance or technical indicators for better accuracy and not rely on the pattern alone.
Why is it called the Mat Hold Pattern?
The term “Mat Hold” refers to a short pause in a strong trend before it resumes. It is like a staircase: the first candle is a strong move, the next three candles are a controlled pullback, and the fifth candle is a resumption of the trend.
During the correction, prices move a little against the trend, but buyers or sellers are still in control. This turns the mat hold into a continuation pattern, not a reversal pattern.
Bullish Mat Hold Pattern
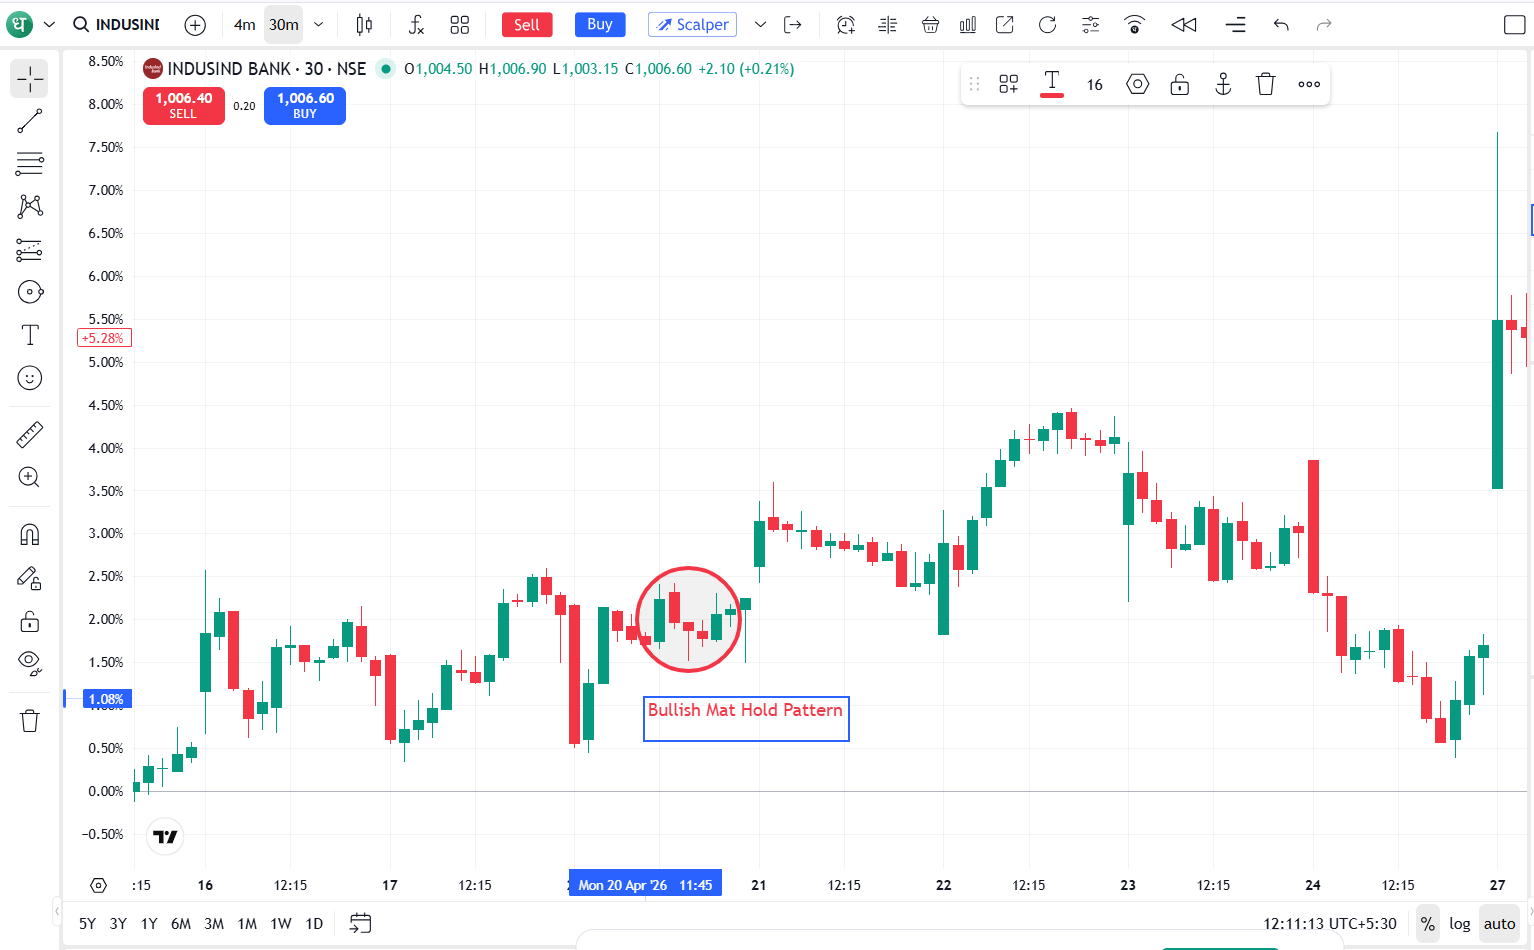
A bullish mat hold pattern forms during an established uptrend and indicates that the trend is likely to continue after a brief pullback. The pattern consists of five candlesticks.
First candle
A big bullish candle indicates strong buying momentum and confirms that the buyers are in control.
Second candle
The second candle is a small bearish candle which gaps up from the first candle. This is not a reversal but a temporary profit booking.
Third and fourth candles
A small bearish candle gapped higher from the first candle, showing temporary profit booking and not a reversal.
Note: If these candles drop below the low of the first candle, the pattern is invalid.
Fifth candle
A big bullish candle closes above the first candle's high, confirming the continuation of the uptrend. Higher trading volume during this breakout gives more strength to the signal.
Bearish Mat Hold Pattern
A big bullish candle closes above the high of the first candle, confirming the uptrend is continuing. This breakout is confirmed by the increased trading volume.
First candle
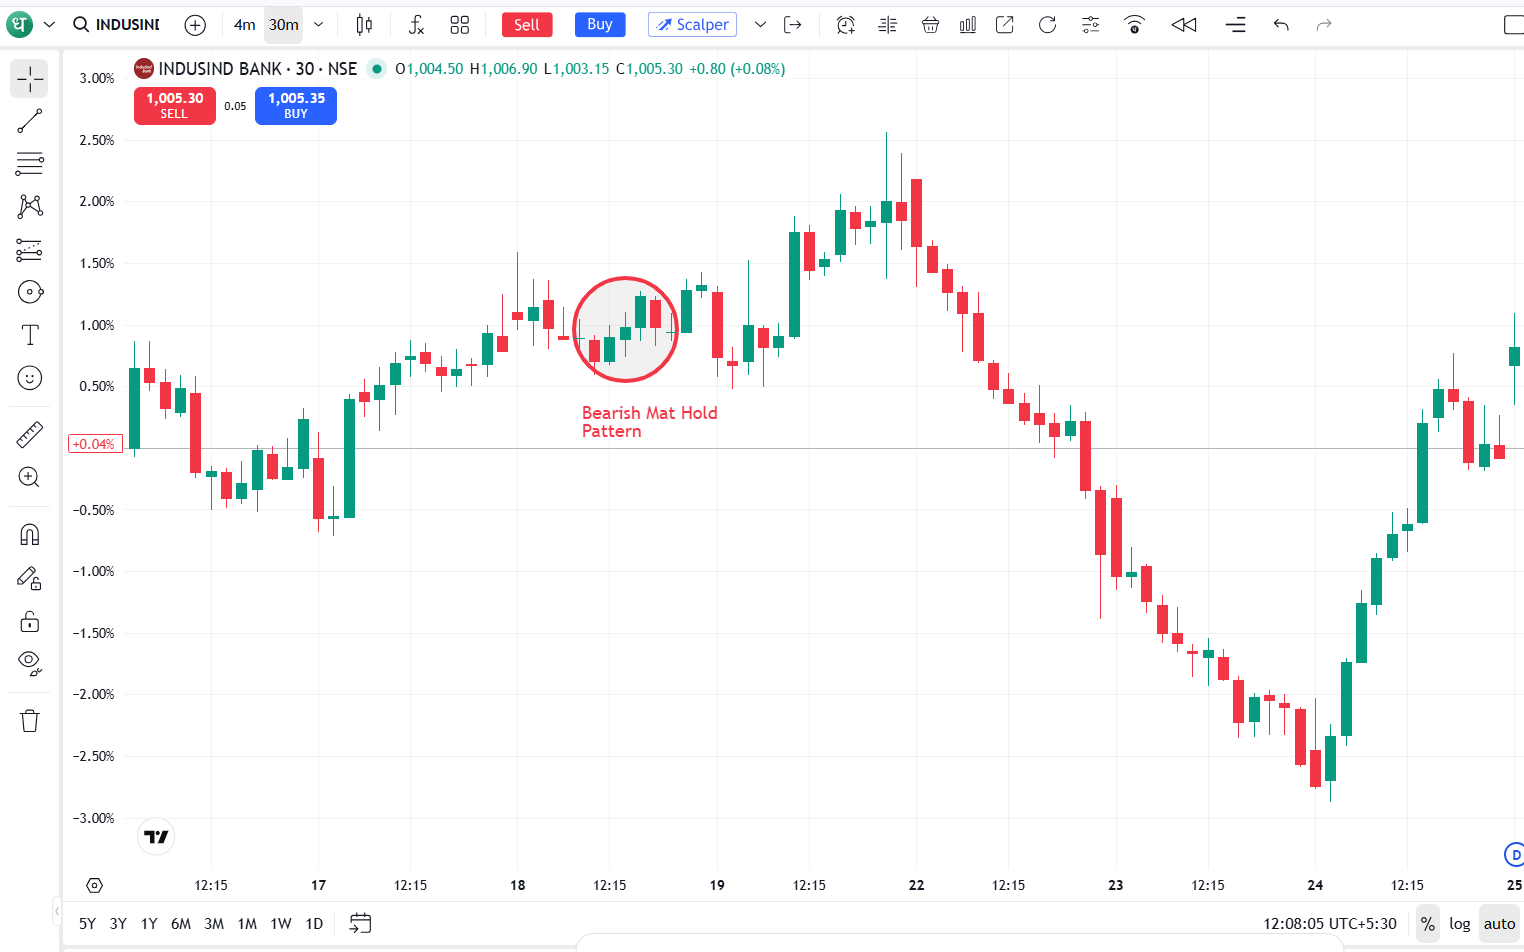
The big bearish candle shows strong selling pressure and confirms the prevailing downtrend.
Second candle
A big bearish candle indicates strong selling pressure, confirming the downtrend.
Third and fourth candles
These tiny candles bounce a bit more but stay within the range of the first bearish candle, showing that buyers are not gaining momentum.
Note: If these candles close above the high of the first candle, the pattern is invalid.
Fifth candle
A big bearish candle closes below the first candle low confirming that the downtrend is continuing. The higher volume on the breakdown adds confidence to the signal.
How to identify the Mat Hold Pattern?
Since the mat hold pattern is not very common, it is recommended that traders check for the presence of all the characteristics of this pattern before trading on it.
Use the following checklist when identifying the pattern:
- The market should already be in a clear up or down trend.
- The first candle should be big and strongly move in the direction of the existing trend.
- The second candle should be a small candle and gap in the direction of the trend.
- The third and fourth candles should represent a modest pullback, remaining within the range of the first candle.
- The correction should not break the high or low of the first candle, depending on the direction of the trend.
- The fifth candle should be large and just outside the high (bullish) or low (bearish) of the first candle.
- The fifth candle should ideally have high volume to confirm the breakout.
If these conditions are not met, the formation may be a different candlestick pattern or just a period of market consolidation.
Bullish vs bearish Mat Hold Pattern
Both variations are valid trend continuation signals, but they appear in different market conditions and imply opposite trading opportunities.
Understanding these differences helps traders identify the correct market context before making a trading decision.
How to trade the Mat Hold Pattern?
The mat hold pattern should not be traded as soon as the first few candles are spotted. Waiting for confirmation decreases the likelihood of entering a false breakout.
Step 1: Confirm the existing trend
Before we analyse the pattern, make sure the market is already trending.
For a bullish mat hold, look for:
- Higher highs & higher lows
- Price is above key moving averages
- A strong upward momentum
For a bearish mat hold, look for:
- Lower highs, lower lows
- Trading under key moving averages
- Ongoing selling pressure
The mat hold pattern is designed for trending markets and is not as reliable in sideways markets.
Step 2: Wait for the complete five-candle formation
This is a mistake many traders make, entering before the fifth candle is formed. Let all five candles finish before determining if the pattern is valid.
You run the risk of trading a pattern that fails if you enter too early.
Step 3: Look for confirmation
The fifth candle should confirm the resumption of the original trend.
Other confirmations could be:
- Increased trading volume
- Breakout above resistance or below support levels
- Positive confirmation from momentum indicators
- Strong closing price near the candle high or low
The more confirming factors, the more powerful the trading setup.
Step 4: Plan your entry
Some traders will wait until the fifth candle closes above the high of the first candle to enter for a Bullish Mat Hold.
For a Bearish Mat Hold, traders may look to enter after the fifth candle closes below the first candle low.
Waiting for the candle to close can reduce the risk of reacting to short-term price swings.
Step 5: Place a stop-loss
Even with high-probability patterns, there is still a need for risk management.
Many traders will place a stop-loss below the lowest point of the three corrective candles for a bullish set-up.
For a bearish setup, the stop-loss is generally above the highest point of the correction.
This allows for normal market fluctuations, but limits potential losses if the pattern fails.
Step 6: Set your profit target
Profit targets can be based on a variety of strategies, such as:
- Last swing highs or lows
- Risk reward ratios of 1 to 2 or 1 to 3
- Fibonacci extension levels
- Trailing stop-loss tactics
Traders tend to let winning trades run rather than cut a trade too soon and protect profits with disciplined risk management.
Volume analysis during the Mat Hold Pattern
Volume is also a good tool to confirm trades in the mat hold pattern as it will show the extent of participation in the market for each price move.
The volume behaviour of an ideal bullish mat hold is often as follows:
- The first bullish candle has high volume, indicating strong buying interest.
- Lower volume during the middle corrective candles, meaning that the pullback is not convincing.
- The fifth bullish candle has a higher volume, confirming that the buying momentum is renewed.
The bearish version follows a similar, but inverted, pattern:
- High volume on the first bearish candle
- Volume drops on the bounce as expected.
- Volume increases on the last bearish candle as sellers regain control.
If the breakout occurs on weak volume, traders may consider waiting for additional confirmation before entering the trade, as low participation can increase the likelihood of a false breakout.
Advantages and limitations of the Mat Hold Pattern
The mat hold pattern has both strengths and limitations that traders should understand before making trading decisions.
Wrapping up
The mat hold candlestick pattern illustrates that strong trends do not always go straight. Temporary pullbacks are a fact of market behaviour, and this pattern allows traders to identify when a pause is more likely to lead to trend continuation rather than reversal.
But no candlestick pattern is guaranteed future price movement. The mat hold works best when it occurs in a mature trend confirmed by rising volume, support or resistance levels and technical indicators such as the RSI or moving averages.
FAQs
1. Is the mat holding candlestick patterns bullish or bearish?
The mat hold can be used for a bullish or bearish trade. A bullish mat hold occurs during an uptrend and indicates that prices will probably continue higher. A bearish mat hold is formed during a downtrend and indicates that selling pressure may continue.
2. How reliable is the mat hold candlestick pattern?
In a strong trend, a mat hold is typically seen as a dependable pattern for continuation, especially when supported by increased trading volume, support and resistance levels or technical indicators. But like all chart patterns, it can produce false signals.
3. Can the mat hold pattern be used for intraday trading?
Yes. This pattern can be observed on intra-day, daily and weekly charts. But higher timeframes are usually more powerful and more reliable, because they filter out short-term noise in the market.
4. What is the difference between the Mat Hold and Rising Three Methods patterns?
Both are five-candlestick continuation patterns, but the mat hold will generally have a gap after the first candle and has more momentum. The Rising Three Methods pattern is more common and usually forms without a gap.
5. Can beginners trade using the mat hold pattern?
Yes, the mat hold pattern can be used by beginners; however, it should not be used in isolation. If you combine it with trend analysis, volume and proper risk management, waiting for the fifth candle to confirm the pattern can help improve trading decisions.







