



OBV Indicator (On-Balance Volume)




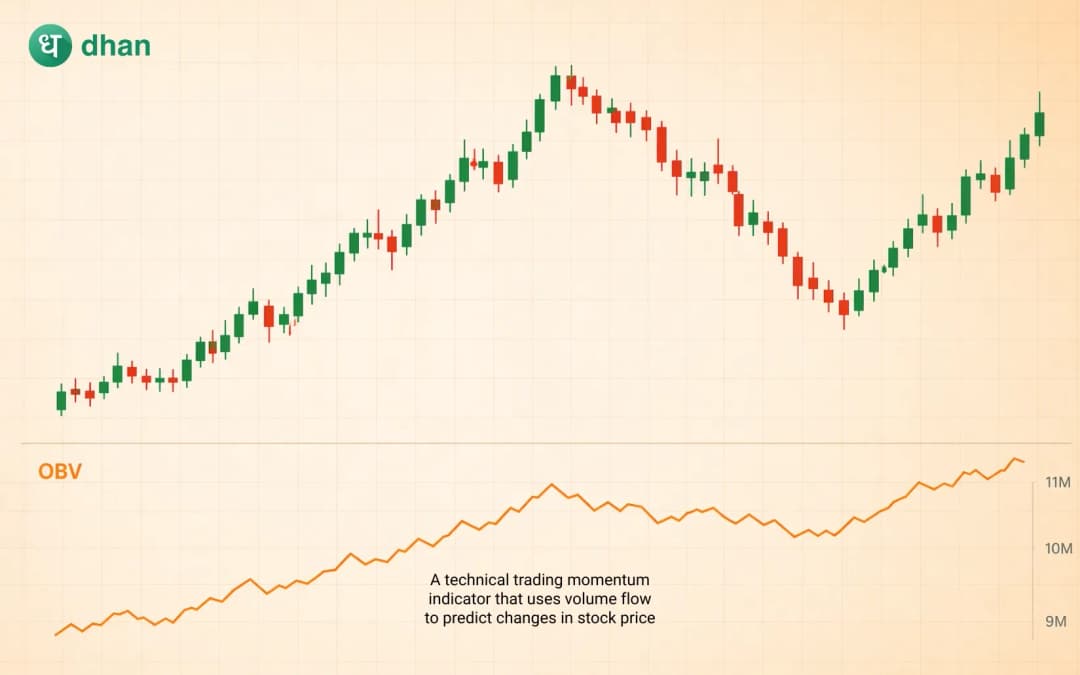




Key takeaways
- The On-Balance Volume (OBV) indicator is a volume-based technical analysis tool that helps traders assess buying and selling pressure.
- OBV adds volume on up days and subtracts volume on down days to build a cumulative volume line.
- Traders commonly use OBV to confirm trends, spot divergences, and identify potential breakout strength.
- The indicator is simple to understand but works best when combined with price action and other technical tools.
- OBV is more useful for identifying momentum shifts than generating standalone trade signals.
Price tells you what the market is doing, and volume tells you how strongly the market believes in that move.
A stock can rise sharply, but if very little volume supports that move, experienced traders may not trust the rally. Whereas a steady price move backed by strong participation usually carries more credibility.
This is where volume-based indicators become useful, and one of the most widely followed among them is the On-Balance Volume (OBV) indicator.
Unlike indicators that rely purely on price calculations, OBV focuses on the relationship between price movement and trading volume. The idea is straightforward: if volume starts flowing into an asset before price makes a major move, the indicator may offer an early clue about shifting market sentiment.
OBV can help traders confirm trends, detect hidden weakness, and assess whether a breakout has genuine conviction behind it. This article takes a deep dive into the OBV indicator and its working principle.
What is the OBV indicator?
The On-Balance Volume indicator, commonly called OBV, is a cumulative volume-based momentum indicator. It is designed to measure selling and buying pressure by tracking the flow of volume in relation to price movement. It was developed by market technician Joseph Granville, who introduced the concept in his 1963 book Granville's New Key to Stock Market Profits, with the idea that volume usually moves before price.
The OBV is based on a simple assumption: If an asset closes higher than the previous session, that day’s volume is treated as buying pressure and added to the running total.
If the asset closes lower, that day’s volume is treated as selling pressure and subtracted from the total. If the price closes unchanged, OBV remains the same. Over time, this creates a continuous line that reflects cumulative volume flow.
Rather than focusing on the absolute OBV number, traders pay attention to the direction and behaviour of the line.
How the OBV indicator is calculated
The calculations of OBV are very simple and straightforward.
- If today’s closing price is higher than the previous day's close:
OBV = Previous OBV + Today’s Volume
- If today’s closing price is lower than the previous day's close:
OBV = Previous OBV - Today’s Volume
- If today’s closing price is unchanged:
OBV = Previous OBV
Let's understand this with an example.
Suppose a stock closes at ₹500 today with a volume of 10 lakh shares. Tomorrow, if the price closes higher, then those 10 lakh shares are added to OBV. If the closing price is lower, then those 10 lakh shares are subtracted.
As this process continues over multiple sessions, the indicator forms a trend line. This trendline tells you more than the actual numbers.
Why traders use the OBV indicator
Volume is considered the fuel behind price movement. Price can move temporarily without strong participation, but cannot sustain it for a long time. Sustainable moves require conviction from market participants.
With OBV, traders can assess the conviction in the market for the trend. The indicator becomes useful because it attempts to answer an important question:
Is volume supporting the current price trend, or is something not lining up?
This can help traders:
- Confirm trend strength
- Detect potential reversals
- Spot hidden accumulation
- Identify distribution
- Validate breakout attempts
How to read the OBV indicator
While reading the OBV indicator, you should not focus on the numbers, but you must watch their behaviour over time.
Rising OBV
When the OBV line is moving upward, it generally suggests buying pressure is increasing. It represents that volume is flowing more strongly into upward price sessions. If the price is rising along with OBV, then it supports bullish momentum.
Falling OBV
A declining OBV line suggests increasing selling pressure. This means that there is more volume with downward closes. If the price and OBV are both falling, it is bearish.
Flat OBV
If OBV moves sideways, it may suggest limited conviction. The market may be consolidating without strong accumulation or distribution.
Trend confirmation using OBV
Traders use OBV as a trend confirmation tool. For example, if a stock is making higher highs and higher lows and OBV is also rising steadily, that suggests volume is supporting the uptrend.
Also, if the price is rising, but OBV remains weak or starts decreasing. That disconnect may suggest the rally lacks strong participation. It does not signal a reversal, but it can be a warning sign.
OBV divergence
Divergence is where OBV often becomes especially interesting. A divergence happens when the price and the indicator move in different directions.
Bullish divergence
A bullish divergence occurs when the price is falling, but OBV is rising. This may suggest that selling pressure is fading even though the price still looks weak.
Bearish divergence
A bearish divergence happens when the price increases, but OBV fails to confirm and starts making lower highs. This may suggest that buying momentum is weakening.
Advantages of the OBV indicator
The OBV indicator offers the following advantages:
- The indicator is easy to understand and built with very basic concepts. This is why the OBV is considered beginner-friendly.
- The OBV focuses on the volume, which provides additional insights into the market.
- It can be applied across stocks, indices, commodities, forex (where volume proxies are used), and crypto markets.
Limitations of the OBV indicator
Besides the advantages, the OBV indicator has its limitations as well.
- Because it is cumulative, sharp volume spikes can significantly distort the indicator temporarily.
- OBV ignores the magnitude of price movement. A small price increase and a major rally are treated similarly if both close higher.
- False divergence signals can occur as well. Not every divergence leads to a reversal.
- In choppy or sideways markets, OBV may become less reliable. That is why traders rarely use it in isolation.
To sum up
The OBV indicator measures the buying and selling pressure for each session. It adds volume to the previous day's OBV if the price goes up and subtracts volume if the price falls. It helps to identify the conviction behind the movement.
OBV does not predict the future, but it can help traders determine if trends are supported and if momentum is quietly changing under the surface.
FAQs on OBV indicator
What does the OBV indicator tell traders?
The OBV indicator helps traders determine whether volume is supporting the current price trend. A rising OBV generally indicates stronger buying pressure, while a falling OBV may indicate increasing selling pressure.
Is OBV a leading or lagging indicator?
OBV is often considered a potentially leading indicator because changes in volume can sometimes appear before noticeable price movement.
Can beginners use the OBV indicator?
Yes, OBV is relatively beginner-friendly. Once traders understand how volume is added or subtracted based on price movement, the OBV is easy to interpret.
Does OBV work in intraday trading?
Yes, OBV can be used in intraday trading, but shorter timeframes may produce more noise and less reliable signals. For effective decision-making, many traders combine it with support-resistance levels and price action for better interpretation.
Which indicators work well with OBV?
OBV is commonly used alongside RSI, MACD, moving averages, trendlines, support-resistance analysis, and candlestick patterns.







