



Unique Three River Bottom Candlestick Pattern








Key takeaways
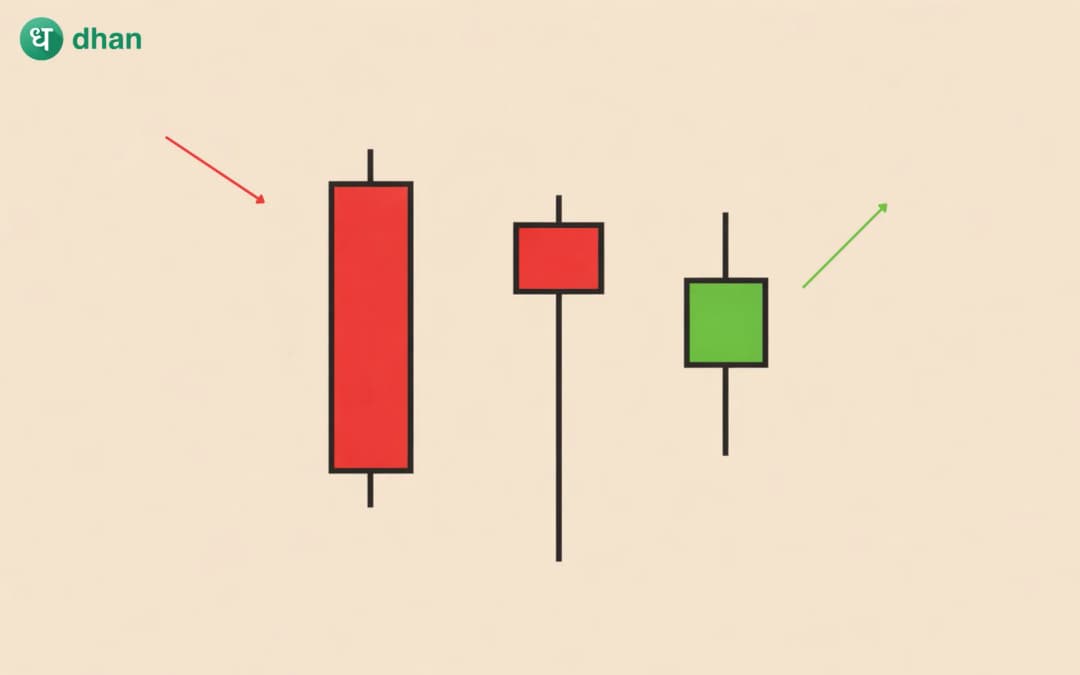
- The unique three river bottom is a rare three-candle pattern that usually appears after a downtrend and is traditionally interpreted as a potential bullish reversal.
- Its structure includes a long bearish first candle, a smaller bearish second candle with a long lower shadow and a lower low, followed by a small bullish third candle.
- The pattern reflects a possible weakening of selling pressure, but its rarity and mixed historical performance mean traders should seek confirmation rather than treat it as an automatic buy signal.
Candlestick patterns are useful as they turn price movement into a visual story. A long bearish candle can show that there was strong selling pressure, while a long lower shadow can show that buyers entered after prices moved lower. These elements may give clues as to a possible change in market behaviour when they combine over a number of sessions.
The unique three river bottom candlestick pattern is one such formation. It is a three-candle pattern that generally appears after a decline and is traditionally classified as a bullish reversal pattern. Its name comes from its Japanese candlestick terminology, and it is known for its very specific formation requirements.
Unlike more familiar formations such as the hammer, bullish engulfing or morning star, the unique three river bottom is rarely seen on a chart. That rarity is part of what makes it interesting, but it also means traders should be careful about drawing strong conclusions from a single occurrence.
What is the unique three river bottom pattern?
The unique three river bottom consists of three candles appearing after a downtrend.
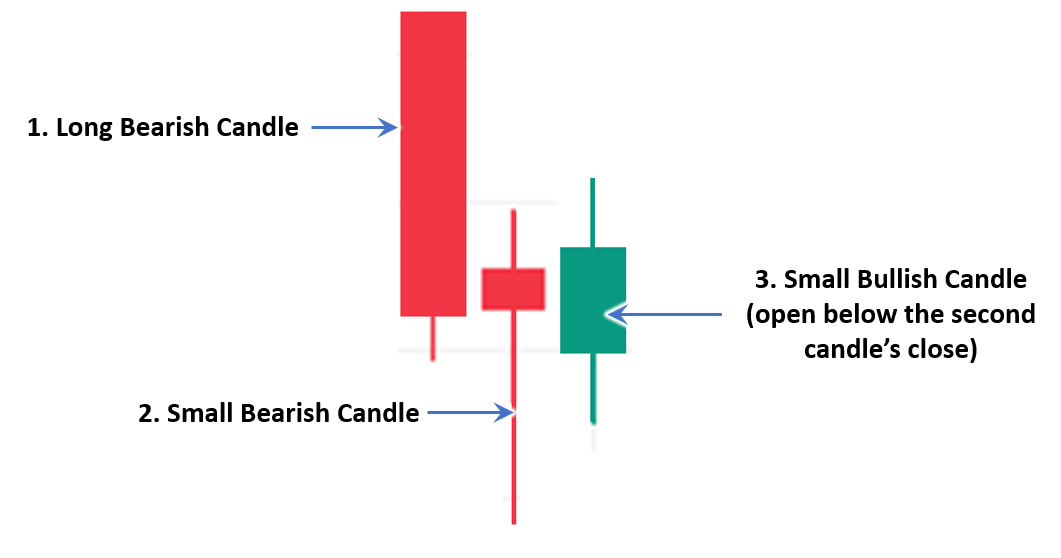
The first candle is a long bearish candle. It confirms that sellers have been in control and that the existing downward trend remains intact.
The second candle is also bearish but is smaller. Its real body sits within the real body of the first candle, while its lower shadow extends below the first candle's low. This long lower shadow is an important feature because it shows that prices moved to a fresh low but recovered significantly before the session ended.
The third candle is a small bullish candle. It opens lower than the second candle's close but does not make a lower low than the second candle. It then closes higher, although traditionally it remains below the second candle's close.
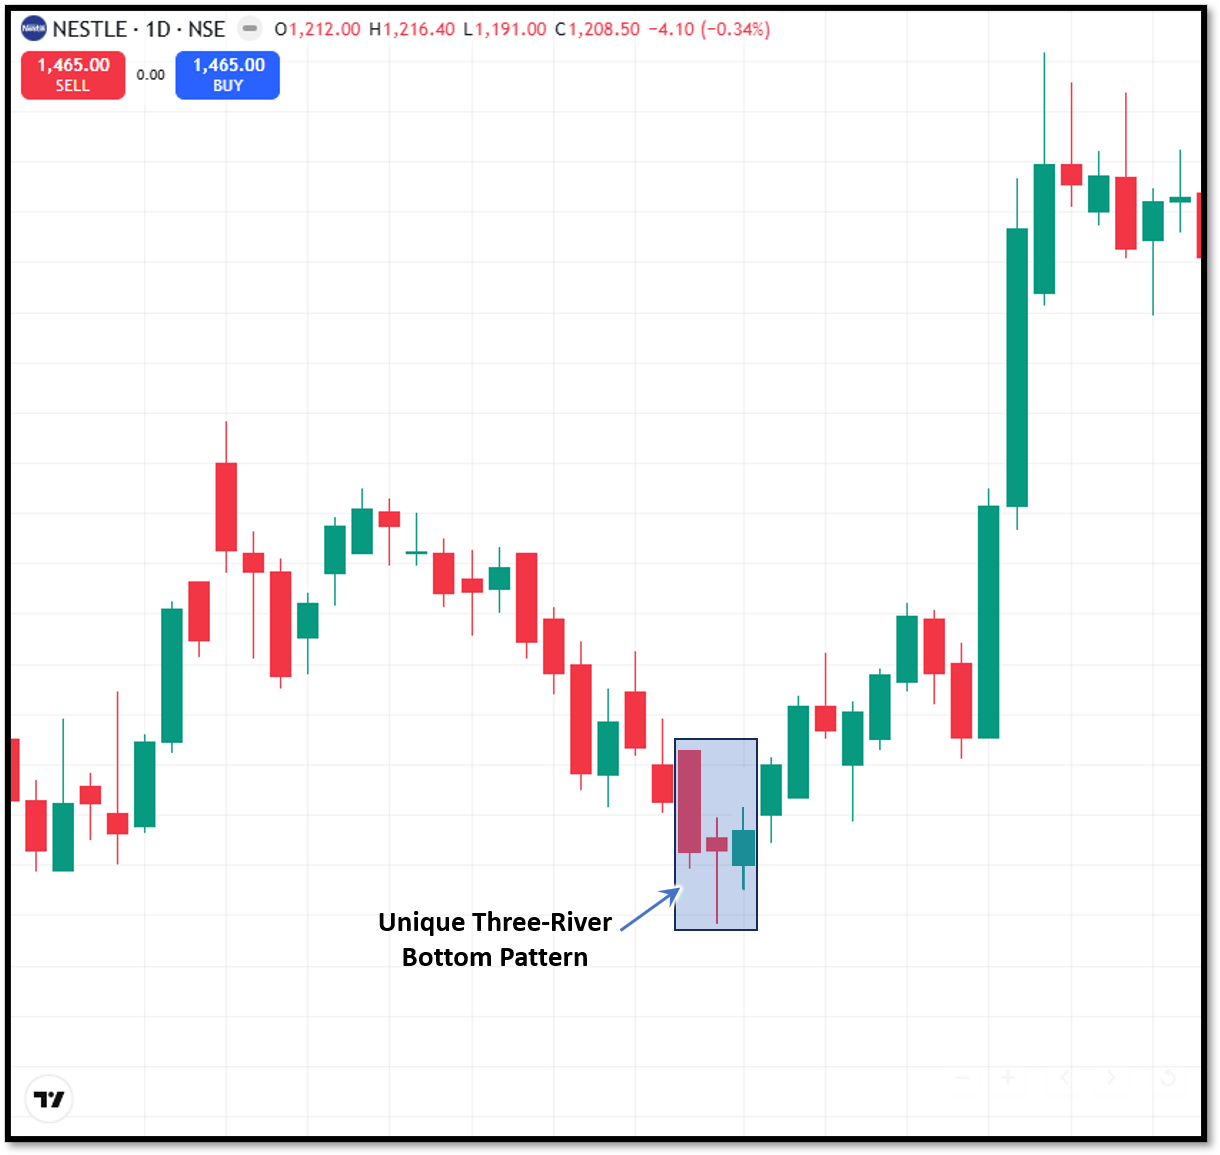
How does the pattern form?
The pattern develops through three distinct stages.
First candle
The first candle is a long bearish candle formed within an existing downtrend. It represents that sellers are still active and establishes the bearish background against which the next two candles should be interpreted.
Second candle
The second candle is where the pattern becomes more interesting. It is smaller than the first candle and has a long lower shadow. Its body remains within the first candle's body, but its low moves below the previous candle's low.
This means sellers initially push the market to a fresh low. However, buyers step in at those lower prices and force a recovery before the candle closes.
Third candle
The third candle is small and bullish. Its low remains above the second candle's low, meaning sellers have failed to extend the decline to another fresh low.
The bullish close provides another small sign that buying interest is emerging. But as the candle remains relatively small and does not completely reverse the earlier decline, confirmation is still important.
What does the unique three river bottom indicate?
The traditional interpretation is that the pattern signals a potential bullish reversal. The logic comes from the change in price behaviour across the three candles.
The first candle shows strong selling. The second candle tests a new low but recovers from it, suggesting that sellers may be losing some control. The third candle is unable to form a lower low and closes higher, adding further evidence that downward momentum may be weakening.
However, this does not mean that the market must immediately reverse. A weakening downtrend can result in a temporary bounce rather than a sustained upward trend.
How to trade the unique three river bottom pattern?
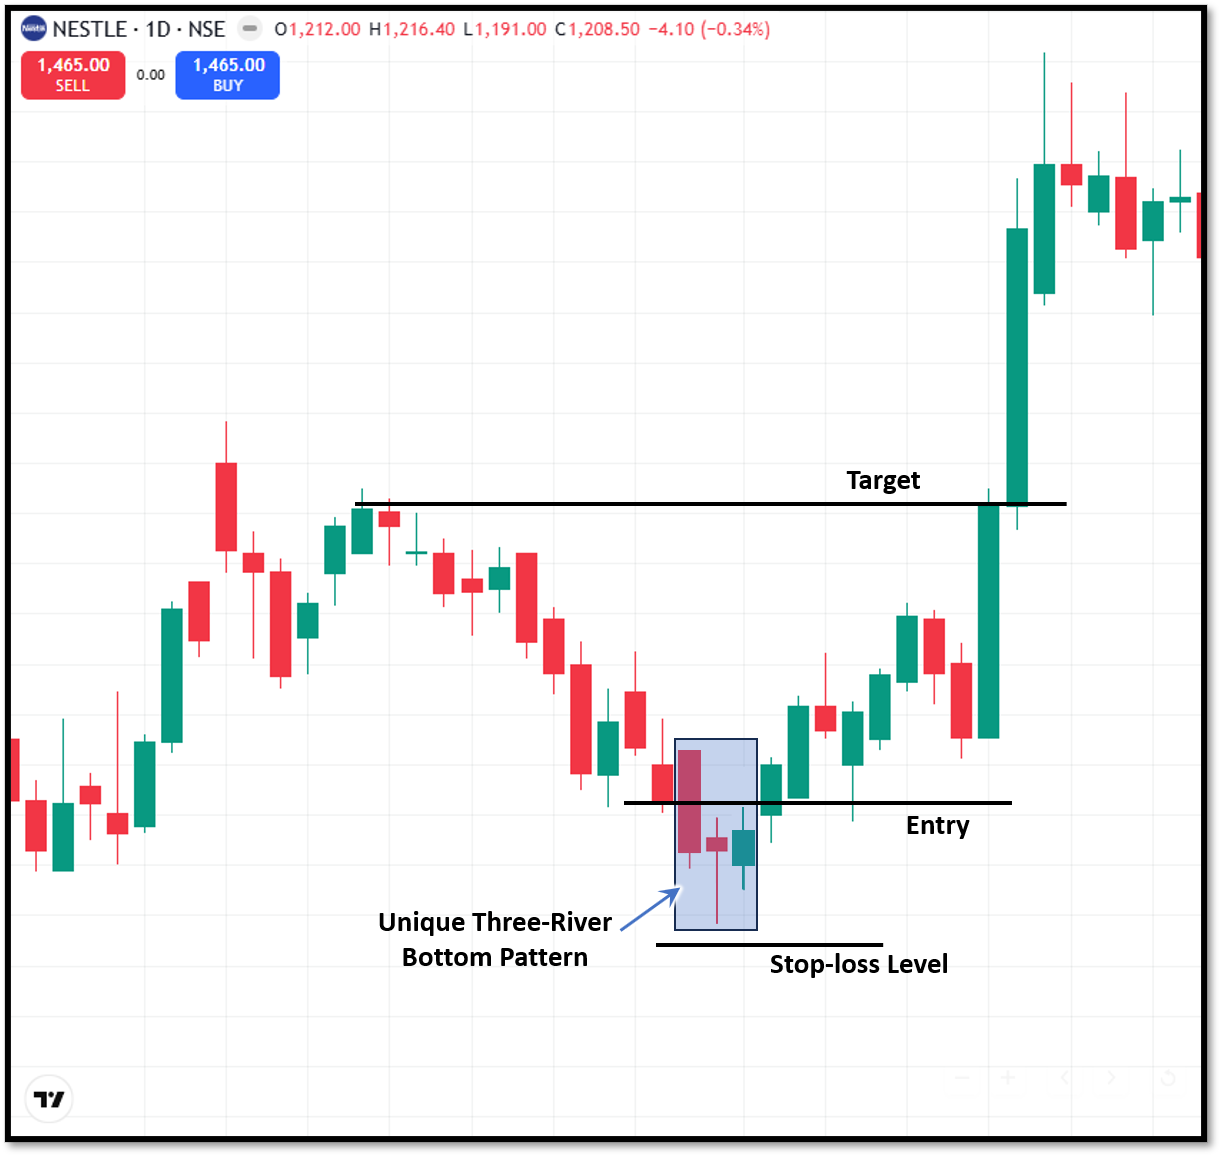
As the pattern can fail, traders may prefer to wait for confirmation before entering a long position.
One approach is to monitor the price after the third candle. A move above an important nearby resistance level or a strong bullish candle following the formation can provide additional evidence that buyers are gaining control.
Another approach is to look for the market to hold above the lows established during the pattern. If price immediately falls below the pattern's low, the bullish interpretation becomes weaker.
The exact entry level depends on the trader's strategy and timeframe. There is no single entry price that applies to every occurrence.
A stop-loss can be considered below an important low associated with the pattern, particularly the second candle's lower shadow.
A potential target can be based on the next resistance zone, previous swing high or a predefined risk-reward ratio.
Using volume for confirmation
Volume can help traders assess whether the price behaviour around the pattern is attracting meaningful participation.
Suppose the second candle produces a long lower shadow while trading volume increases. This may indicate that substantial activity occurred as prices reached the new low and recovered.
A subsequent bullish move accompanied by stronger volume can provide additional context. If the entire formation develops on unusually weak participation, a trader may want to be more cautious.
Advantages of the unique three river bottom pattern
The unique three river bottom pattern offers the following advantages:
- The second candle creates a fresh low but recovers from it, showing that buyers are willing to enter at lower prices. It highlights a failed attempt to extend the decline.
- The sequence captures strong selling, a rejected lower price and an early bullish response.
- When the pattern forms around an established support area, the second candle's rejection of a new low can add useful context to the level.
Disadvantages of the unique three river bottom pattern
Along with advantages, the pattern has the following limitations as well:
- The strict formation requirements mean traders may encounter it infrequently. This makes it unsuitable as a standalone method for generating regular trading signals.
- Although the pattern provides a strong signal of weakness in the bearish trend, it won’t guarantee the bullish reversal.
- Small differences in candle body position, lower shadows and lows can change whether a setup actually qualifies.
How to identify the pattern on a chart
When scanning a chart, you may follow a simple checklist:
- Check the trend: Confirm that the market was in a clear downtrend before the three candles appeared.
- Find the first candle: Look for a relatively long bearish candle.
- The second candle: Its bearish body should sit within the first candle's body, while its lower shadow makes a new low below the first candle's low.
- Check the third candle: Look for a small bullish candle whose low remains above the second candle's low.
- Look for confirmation: Examine subsequent price action, support, resistance and volume before considering a trade.
Wrapping up
The unique three-river bottom candlestick pattern is rare three-candle formation which suggests a potential bullish reversal after a downtrend. Its distinctive structure combines a strong bearish candle, a smaller bearish candle with a lower-shadow rejection of a new low and a small bullish third candle.
Although the pattern should always be treated as a possible bullish reversal, not a guarantee. You should confirm the pattern with other indicators and price action before entering the trade.
FAQs
Is the unique three river bottom a rare candlestick pattern?
Yes. Its specific formation requirements make it uncommon. Historical pattern data has described it as extremely rare, with very few occurrences in large historical datasets.
What does the long lower shadow mean?
The long lower shadow on the second candle shows that sellers pushed prices to a new low, but buyers responded strongly enough to recover much of that decline.
How is it different from a morning star?
Both are three-candle formations associated with potential bullish reversals, but their structures differ. The unique three river bottom is a second bearish candle with a long lower shadow and a lower low, followed by a small bullish candle.
Can the pattern be used for intraday trading?
Yes, you can use the pattern during intraday trading, provided the trader realises that candle formations can behave differently on different time frames.
Can volume be used to confirm the unique three river bottom?
Volume can provide context but does not ensure the reversal will work. Confirmation of the interpretation may be given by increased participation during a subsequent bullish breakout.







