



Morning Star Candle Pattern




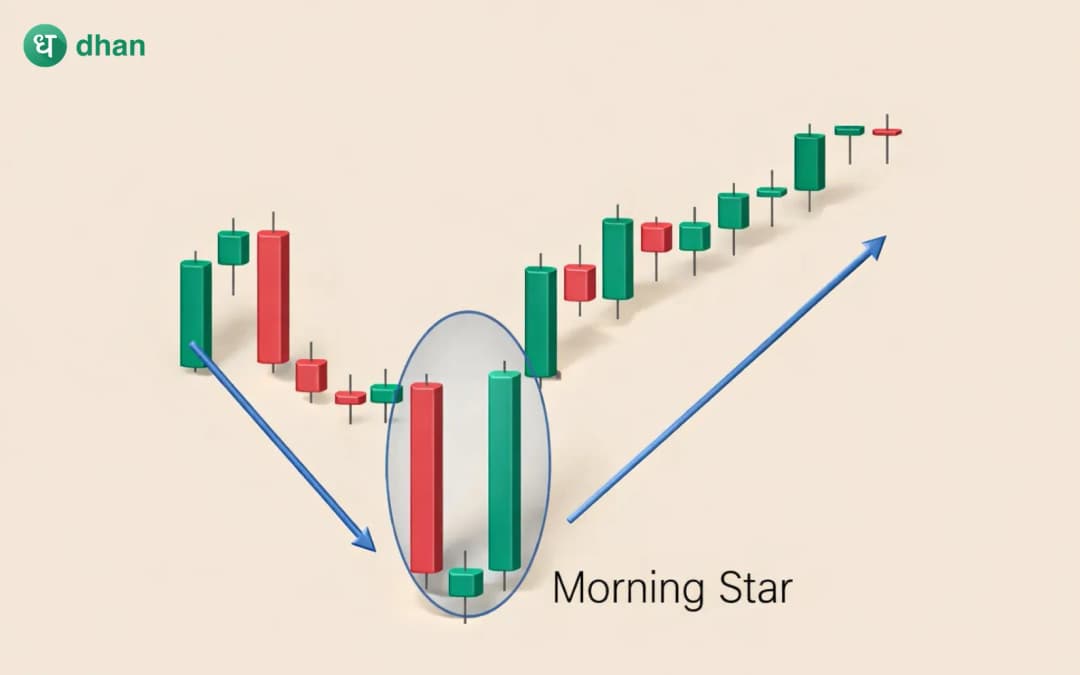




Many traders use candlestick patterns in technical analysis to understand price behaviour and to identify potential trading opportunities. Each candlestick represents something about its price behaviour. By studying candlestick patterns, traders can interpret market sentiment and anticipate possible trend changes.
There are numerous types of candlestick patterns which traders use during trading. The Morning Star candlestick pattern is one of the most reliable bullish reversal patterns. It generally forms after a strong downtrend and indicates that the selling pressure is decreasing and buying interest is increasing.
Traders always watch such patterns of trend reversal because they provide early signals of potential opportunities. Indicators give the signal much later than the pattern. Understanding how the Morning Star candle pattern forms and how to trade it can help traders identify potential entry opportunities in the market.
What is a Morning Star candle pattern?
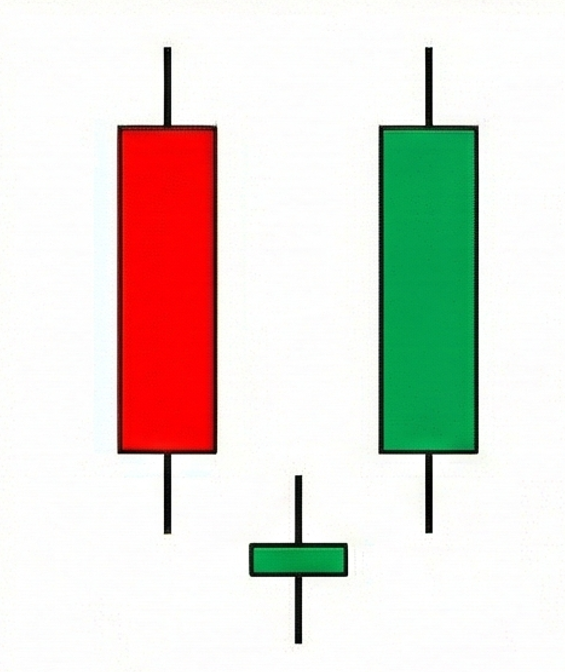
The morning star is a bullish reversal pattern which forms with three candles. This pattern usually appears at the bottom of a downtrend, signalling a possible bullish reversal. It also shows that the bearish trend is losing momentum, and buyers are stepping into the market. The pattern has three candles:
- First Candle - The first candle of this pattern is a large bearish candle, which signals high selling pressure in the market. It shows that the sellers are in control and the market is continuing its downward momentum.
- Second Candle - The second candle has a small body, usually gaps down from the first candle, which may appear like a Doji or spinning top. It represents a tight fight between buyers and sellers. Neither of them is able to dominate the market. The price movement of this candle is usually very low, which shows that the bearish momentum is weakening.
- Third Candle - The third candle is a strong bullish candle that confirms the shift in momentum. It indicates that buyers have started to take control, and the market may begin moving upward. This candle usually closes above the midpoint of the first candle. This is a confirmation candle indicating that buyers have dominated the market.
The visual representation of a Morning Star candle pattern is shown in the figure below:
Market psychology behind the Morning Star Pattern
If you understand the market psychology behind the Morning Star candle pattern, you will realise why it signals potential trend reversal.
The first candle shows that the sellers are very active and they are pushing the price down. During the formation of this candle, sellers are confident about the trend continuation. The candle ends with a strong bearish signal. The next candle opens with a gap down. In the beginning, it may go lower, but when the candle ends, it forms a very small body. This represents that there is an indecision between buyers and sellers. It usually means that the market is losing downward momentum.
The third candle shows strong buying activity. During the formation of this candle, buyers enter the market aggressively and push the price up. This shift in momentum signals that the bearish trend may be ending and a bullish trend may begin. You may notice increased volume; this is a confirmation sign of trend reversal.
How to identify a Morning Star Pattern on charts
Traders use several guidelines to identify the Morning Star candle pattern correctly.
- The pattern should appear after a clear downtrend. Without a prior downward movement, the pattern may not indicate a meaningful reversal.
- Traders also look for increased trading volume during the third candle, which strengthens the reliability of the pattern.
Modern trading platforms like Dhan will help you spot the most common candlestick patterns.
How traders use the Morning Star Pattern
The Morning Star pattern can be used as part of a trading strategy to identify potential buying opportunities.
Entry Strategy - Traders usually enter the trade after the completion of the third candle. Some traders wait for additional confirmation, such as a breakout above a resistance level.
Stop-Loss - Traders place the stop-loss below the lowest point of the morning star pattern. It is essential to keep the stop-loss while trading with candlestick patterns. It will protect the trade if the market continues to move downward.
Target - Profit targets can be set based on previous resistance levels, risk-reward ratio, or technical indicators. For example, traders may aim for a target that offers a 2:1 or 3:1 risk-reward ratio.
Advantages and limitations
Every pattern or indicator has its own strengths and weaknesses. The Morning Star candle pattern also offers some advantages and limitations.
Advantages of the morning star pattern
- The pattern provides a clear visual signal of potential reversal. It is easy to identify the three-candle structure on price charts.
- It is observed that the pattern works across multiple timeframes, including intraday, swing trading, and long-term trading.
- The pattern helps traders recognise a shift in market sentiment from bearish to bullish. This allows traders to enter the market early during the beginning of a new uptrend.
Limitations of the morning star pattern
- The pattern can sometimes produce false signals, especially in highly volatile or sideways markets.
- The pattern requires confirmation. Traders must not rely solely on this pattern without analysing other factors such as support levels or technical indicators.
- In markets with strong bearish momentum, the Morning Star pattern may fail to trigger a sustained upward move.
Tips for using the Morning Star pattern
Here are some tips to help you.
- Make sure the pattern emerges following a distinct downward trend.
- Look for the pattern near important support levels; it increases the chances of a successful reversal.
- Combine the pattern with other technical indicators, such as RSI or moving averages, for better confirmation.
- Apply proper risk management strategies.
To wrap up
The Morning Star pattern is a bullish reversal pattern which forms after a downtrend. It consists of three candles that reflect a shift from strong selling pressure to increasing buying momentum. The probability of the trend reversal increases if it appears after a clear downtrend and near a key support level.
The morning star pattern should be used in combination with support levels, technical indicators, and proper risk management. Traders should avoid relying solely on this pattern and should always look for confirmation before entering a trade.
FAQs on Morning Star candle pattern
Is the Morning Star pattern bullish or bearish?
Morning star pattern is a bullish reversal pattern. It appears at the end of the downtrend and suggests weakened selling pressure.
How reliable is the Morning Star candlestick pattern?
Traders usually trust more in the morning star pattern if it appears after a clear downtrend and near a key support level. Although it is recommended that the traders should not rely on it alone, confirmation from other sources will increase its reliability.
What is the difference between Morning Star and Evening Star patterns?
The morning star pattern is a bullish reversal pattern, while the evening star pattern is a bearish reversal pattern. Also, the evening star pattern usually appears after an uptrend, and the morning star pattern forms after a downtrend.
Should traders use the Morning Star pattern alone?
Traders should avoid using the Morning Star pattern alone. It is best to combine it with support and resistance levels, trend analysis, and technical indicators to increase the reliability.
What is the ideal stop-loss for a Morning Star trade?
The ideal stop-loss for the morning star pattern trade is below the lowest point of the pattern, usually under the second candle.







