



Williams R Indicator








Key takeaways
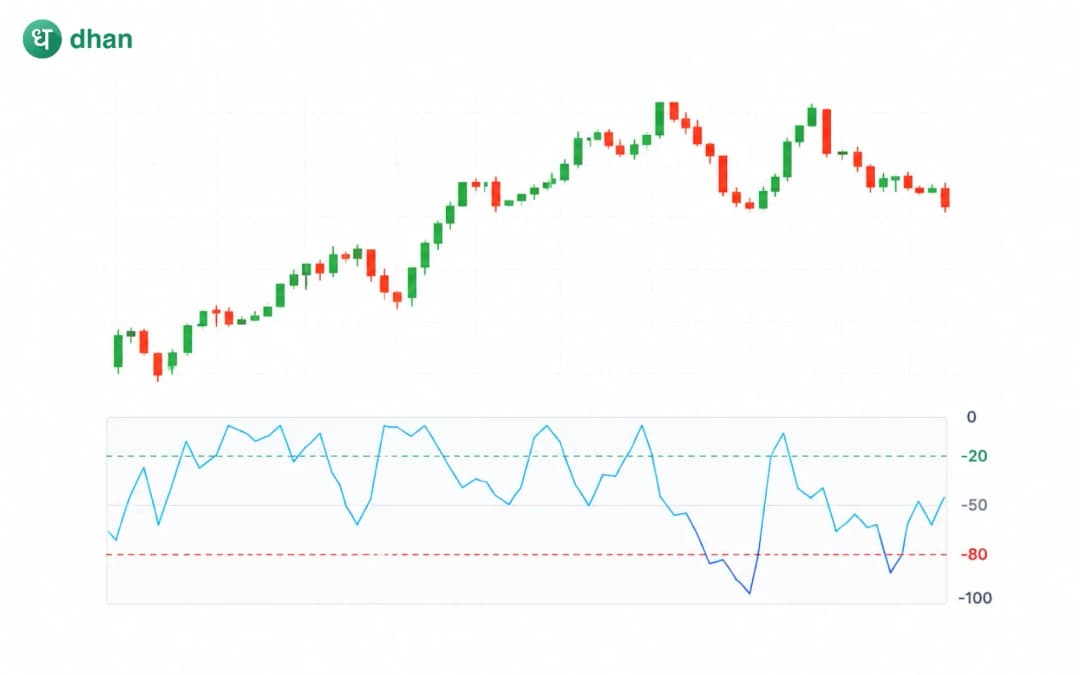
- The Williams R indicator is a momentum indicator used by traders to identify whether a financial instrument is trading close to the highest or lowest point of its recent price range.
- It ranges from 0 to -100. A value close to 0 signifies strong upward pressure, whereas a value close to -100 signifies strong downward pressure.
- Any value more than -20 indicates an “overbought” condition, which is a bearish signal, while any value less than -80 indicates an “oversold” market condition, which is a bullish signal.
- It is useful to identify changes in momentum and create possible opportunities for entering or exiting the trades.
A stock has hit a new short-term high. Should you buy, wait, or avoid it? What if another stock has suffered sharp losses and now appears to be oversold? Making decisions based solely on prices can be challenging, especially during times of high market volatility.
That is where momentum indicators can provide valuable information. The Williams R indicator is a well-known technical indicator that helps traders determine whether the current price is near the high or low point of its recent trading range.
Understanding and using the Williams R indicator effectively can enhance your trading strategies and risk management methods.
What is the Williams R indicator?
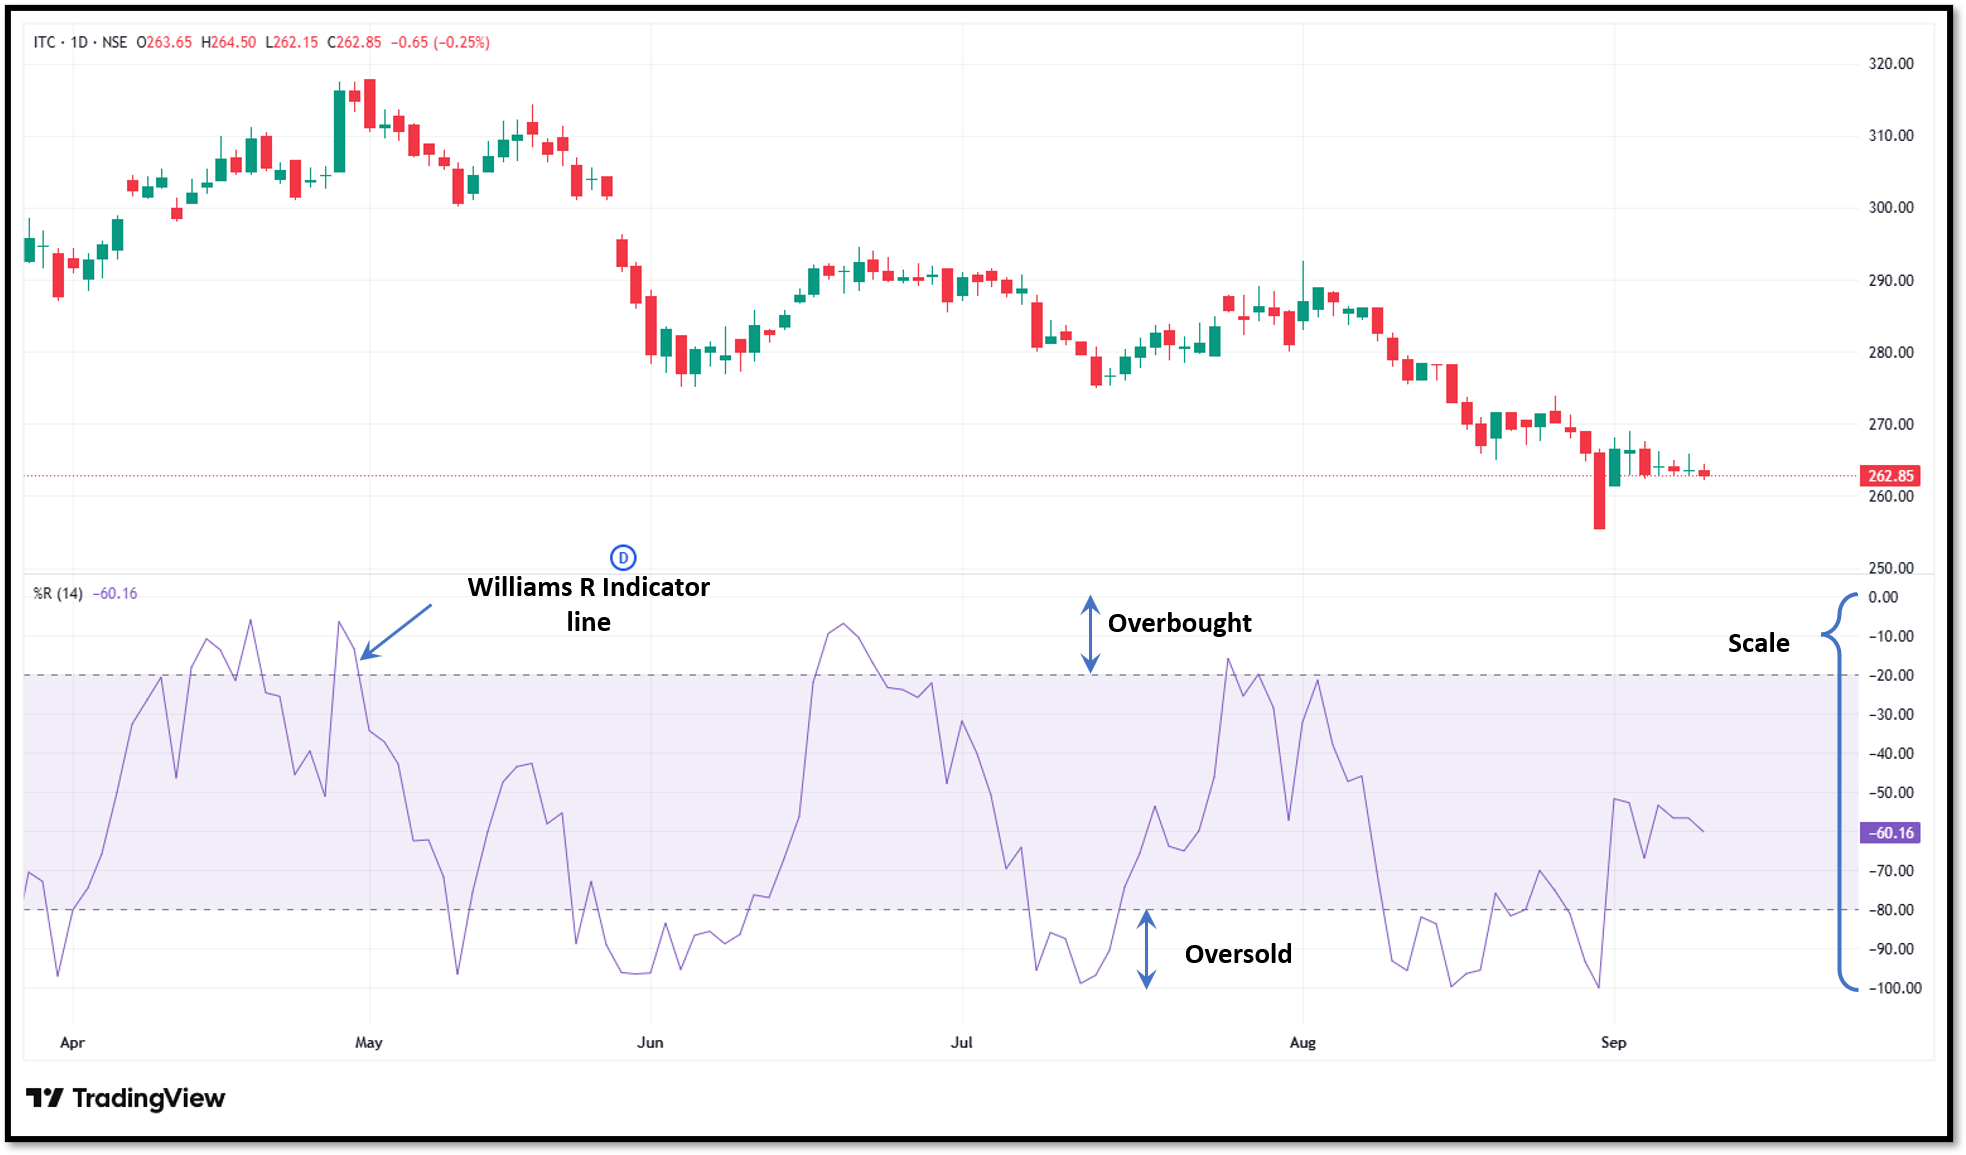
The Williams R indicator, also known as the Williams per cent range, is a momentum indicator that shows the current closing price relative to the highest and lowest prices over a particular period. A 14-day period setting is most commonly used.
The indicator ranges between 0 and -100. A value greater than -20 suggests that the asset is overbought, whereas a value lower than -80 is considered oversold. However, neither of these levels guarantees any immediate trend reversal.
How does the Williams R indicator work?
The Williams R indicator shows how close the current price is to the highest or lowest point of its recent price range. A reading near 0 suggests that the price is trading near the top of the range, while a reading close to -100 indicates that it is near the bottom.
For example, if a stock trades between ₹100 and ₹120 and closes at ₹118, the Williams R indicator reading will be close to zero. If it closes at ₹102, the value will be close to -100.
This indicator helps to understand whether the recent price move has strong or weak momentum. It works best when used along with broader market trends, rather than being used alone to generate trading signals.
How to calculate the Williams R indicator
Williams R indicator is calculated using the formula:
Williams R indicator = [(Highest High − Current Close) ÷ (Highest High − Lowest Low)] × -100
Suppose the highest high during the chosen time frame is ₹120, the lowest low ₹100, and the current market closing price is ₹115
[(120 - 115) / (120 - 100)] × -100 = -25
As a result, the Williams R indicator reading is -25, indicating that the current market price is closer to the higher end of its recent trading range. Most trading platforms can calculate this indicator automatically, so traders do not need to calculate it themselves.
How to read Williams R indicator
Williams R indicator uses a scale of 0 to -100. The reading provides information about the current closing relative to the highest and lowest prices chosen period.
- 0 to -20: The current price is at the upper end of the recent price range and is considered overbought.
- -20 to -50: The current price remains at the upper end within the recent price range, indicating strong upward momentum.
- -50 to -80: The price is in the lower range, indicating relatively weak momentum.
- -80 to -100: The price is near the lower end of the recent trading range and is considered oversold.
The most important levels to monitor are -20 and -80. A break above -20 may indicate strong buying momentum, whereas breaking below -80 may signal strong selling pressure.
Williams R indicator vs. stochastic oscillator
The Williams R indicator and the stochastic oscillator are both momentum indicators that show the relative position of the current market close with the recent price range. These two indicators help traders identify when an asset has strong or weak momentum and identify overbought or oversold conditions.
The main difference lies in their scale. Williams R indicator ranges from 0 to -100, whereas the stochastic oscillator ranges from 0 to 100. Consequently, the levels that indicate an overbought or oversold market differ. Typically, the Williams R indicator uses -20 and -80, while the Stochastic Oscillator uses 80 and 20.
The Stochastic Oscillator is commonly calculated using its %K and %D lines to identify the crossovers. Williams R indicator uses a single line, giving a direct view of where the closing price is relative to its recent trading range.
How to use the Williams R indicator in trading
There are several ways traders can use the Williams %R as part of their trading strategies.
Identify overbought and oversold conditions
Watch for readings greater than -20 or less than -80. A reading at these levels indicates that the price is trading close to the high/low end of its recent range.
Identify changes in momentum
Observe the indicator movement after it reaches an extreme level. An increase from the oversold zone suggests a decrease in selling pressure, while a downward move from the overbought zone indicates weak buying pressure.
Look for divergence
Compare Williams R with the price trend. If the price makes a new high but Williams R does not, it may be a sign of decreasing upward momentum. Similarly, if prices make new lows but the Williams R indicator does not, the downtrend may be losing momentum.
Use the indicator with the price trend
Williams R works better when used along with the prevailing market trend. For example, an oversold reading in an uptrend may signal a pullback rather than a trend reversal, while an overbought reading in a downtrend may point to a bounce rather than a rally.
Wait for confirmation before taking a position
A Williams R reading alone may not be sufficient to support your trading decision. So, it is recommended to wait for confirmation from price action and key support or resistance levels before entering a trade. This extra step can help you avoid some common pitfalls and improve your chances of success.
Advantages of the Williams R indicator
Some advantages of the Williams R indicator are:
- Williams R indicator operates on a scale from 0 to -100, providing clear and easy-to-understand readings. Traders can quickly identify whether prices are near recent highs or lows.
- It allows you to evaluate the intensity of recent market movements and shows where buying and selling pressure is increasing during a given timeframe.
- Readings above -20 and below -80 indicate whether the market is overbought or oversold. These levels allow traders to identify areas that may require close monitoring before entering a trade.
- Williams R indicator is versatile. It can be used in intraday charts as well as on daily, weekly and other timeframes. Its ability to adapt to different time frames makes it suitable for both short-term and long-term traders.
- Williams R indicator can be combined with other additional indicators like moving averages, RSI and trendlines. By using multiple indicators to analyse the market, traders can get a complete view of a trading opportunity before investing capital.
Limitations of the Williams R indicator
Some limitations of the Williams R indicator are:
- Being overbought or oversold does not mean that the price will immediately reverse. Market momentum can still be strong once an indicator reaches an extreme level.
- During strong trends, Williams R can remain above -20 or below -80. An extreme reading therefore does not necessarily indicate a price reversal.
- It alone does not provide complete information about the overall market structure. Traders should keep an eye on trends, support and resistance levels, volumes, price action and chart patterns.
- The calculation relies solely on historical prices during a specified time period. Therefore, it can describe existing trends but cannot be used to predict future price movements.
- If prices change quickly, the Williams R indicator will move frequently from one zone to another. This may generate unreliable signals, especially on shorter timeframes.
Common mistakes to avoid
Avoiding these common mistakes can improve the reliability of your trades.
Treating overbought as a sell signal
A reading above -20 does not mean that the price is about to fall. Strong buying pressure can keep an asset in an overbought state even as its price continues to rise.
Treating oversold as a buy signal
A reading below -80 does not mean that the price will definitely recover. During a strong bearish market, intense selling pressure can keep the indicator in an oversold state for an extended period of time.
Going against the main trend
Going against the broader market trend can increase the risk of a failed setup. Before taking action on a Williams R indicator signal, traders should consider the overall price direction.
Relying on one indicator
Williams R indicator should not form the sole basis of a trading decision. Using it alongside price action, support and resistance, or other technical indicators can provide extra confirmation.
Neglecting risk management
There is always uncertainty and instability in the market, which can lead to the failure of even the most advanced systems. Therefore, every trader should include position sizing, stop-loss levels, and disciplined capital management as an integral part of trading strategy.
Wrapping up
The Williams R indicator is a beneficial indicator in technical analysis as it indicates the position of the current price relative to the recent trading range. Instead of using it to predict future moves, traders can use its values to identify momentum and important areas of support and resistance.
The indicator works best when used with a well-defined trading plan rather than as a replacement for one. When its signals are combined with trend analysis, market behaviour and appropriate risk management, traders can make more informed decisions.
FAQs
How is the Williams R indicator different from the RSI indicator?
Williams R compares the closing price with its recent high-low range, whereas RSI measures the magnitude of recent gains and losses. Although both indicators can detect momentum states, they calculate and display this information differently.
Is it possible to use the Williams R indicator along with moving averages?
Yes, using the Williams R indicator along with moving averages enables traders to track both momentum and trend direction. For example, a moving average can identify major trends while the Williams R indicator provides data on short-term momentum conditions.
What timeframe is commonly used for the Williams R indicator?
Many traders and charting platforms start with the 14-period setting as a standard starting point. However, any interval can be chosen based on the asset, timeframe, and personal trading approach.
Does the Williams R indicator work in strong trends?
Yes, but caution must be taken when reading extreme values during strong trends. An asset can remain overbought or oversold for an extended period before experiencing any significant reversal.
Is Williams R suitable for beginners?
Yes, with its easy-to-understand scale from 0 to -100, it is simple to understand. New traders should concentrate on using it alongside trend analysis and risk management rather than relying solely on it.







