



Advance Block Candlestick Pattern








Key takeaways
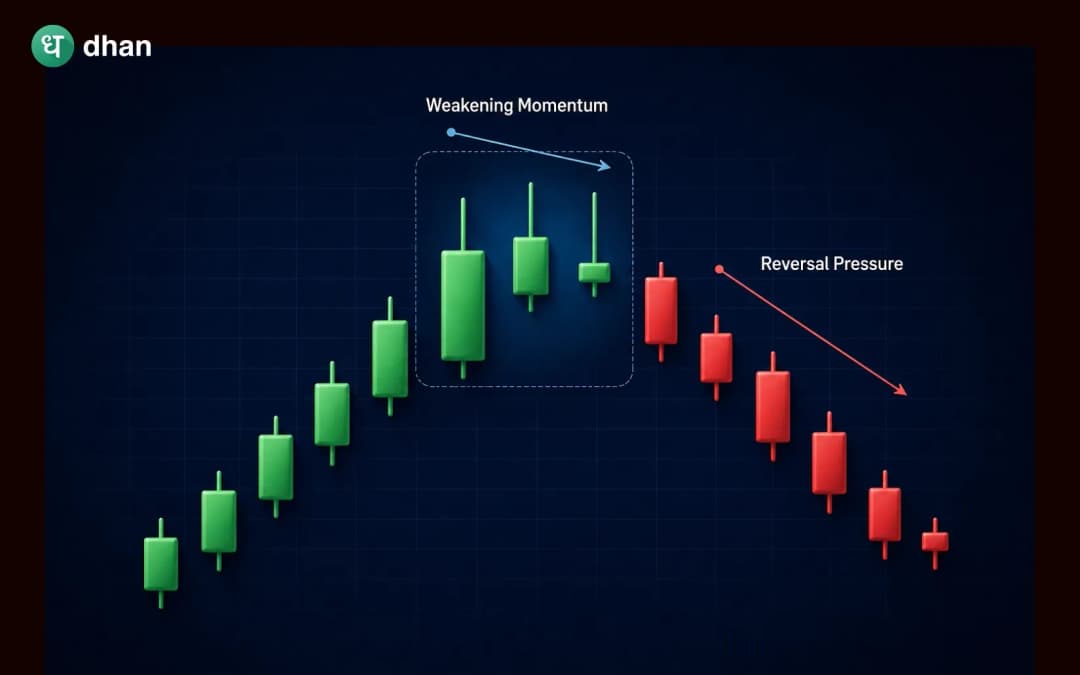
- The advance block is a candlestick pattern which forms after a prolonged uptrend, and it signals the beginning of a bearish reversal in the market.
- It consists of three consecutive bullish candles; however, every candle shows weakening buying power.
- This pattern implies that buyers are gradually losing dominance while sellers become more active.
- Trading this pattern alone may be hazardous as false signals are common. Traders should always seek confirmation using price action, volume, or technical indicators.
- The pattern works best when it appears near a resistance level or during an extended rally.
Candlestick patterns are a key element of technical analysis as they provide information about investor sentiment beyond price movements. These patterns show whether sellers or buyers are in control, which helps to spot opportunities to buy or sell stocks.
One such formation is the Advance Block candlestick pattern. It’s a bearish reversal pattern that indicates buying momentum is slowing down. Although prices are still rising, there’s less enthusiasm among buyers with each successive candle. Identifying changes in momentum helps traders get ready for a possible trend change and enhance their trading strategy overall.
Here in this article, we will explore the formation of the Advance Block pattern, its implications on the mood of the market, what it tells about investor sentiment, and how traders can use it in their trading strategy.
What is the Advance Block Candlestick Pattern?
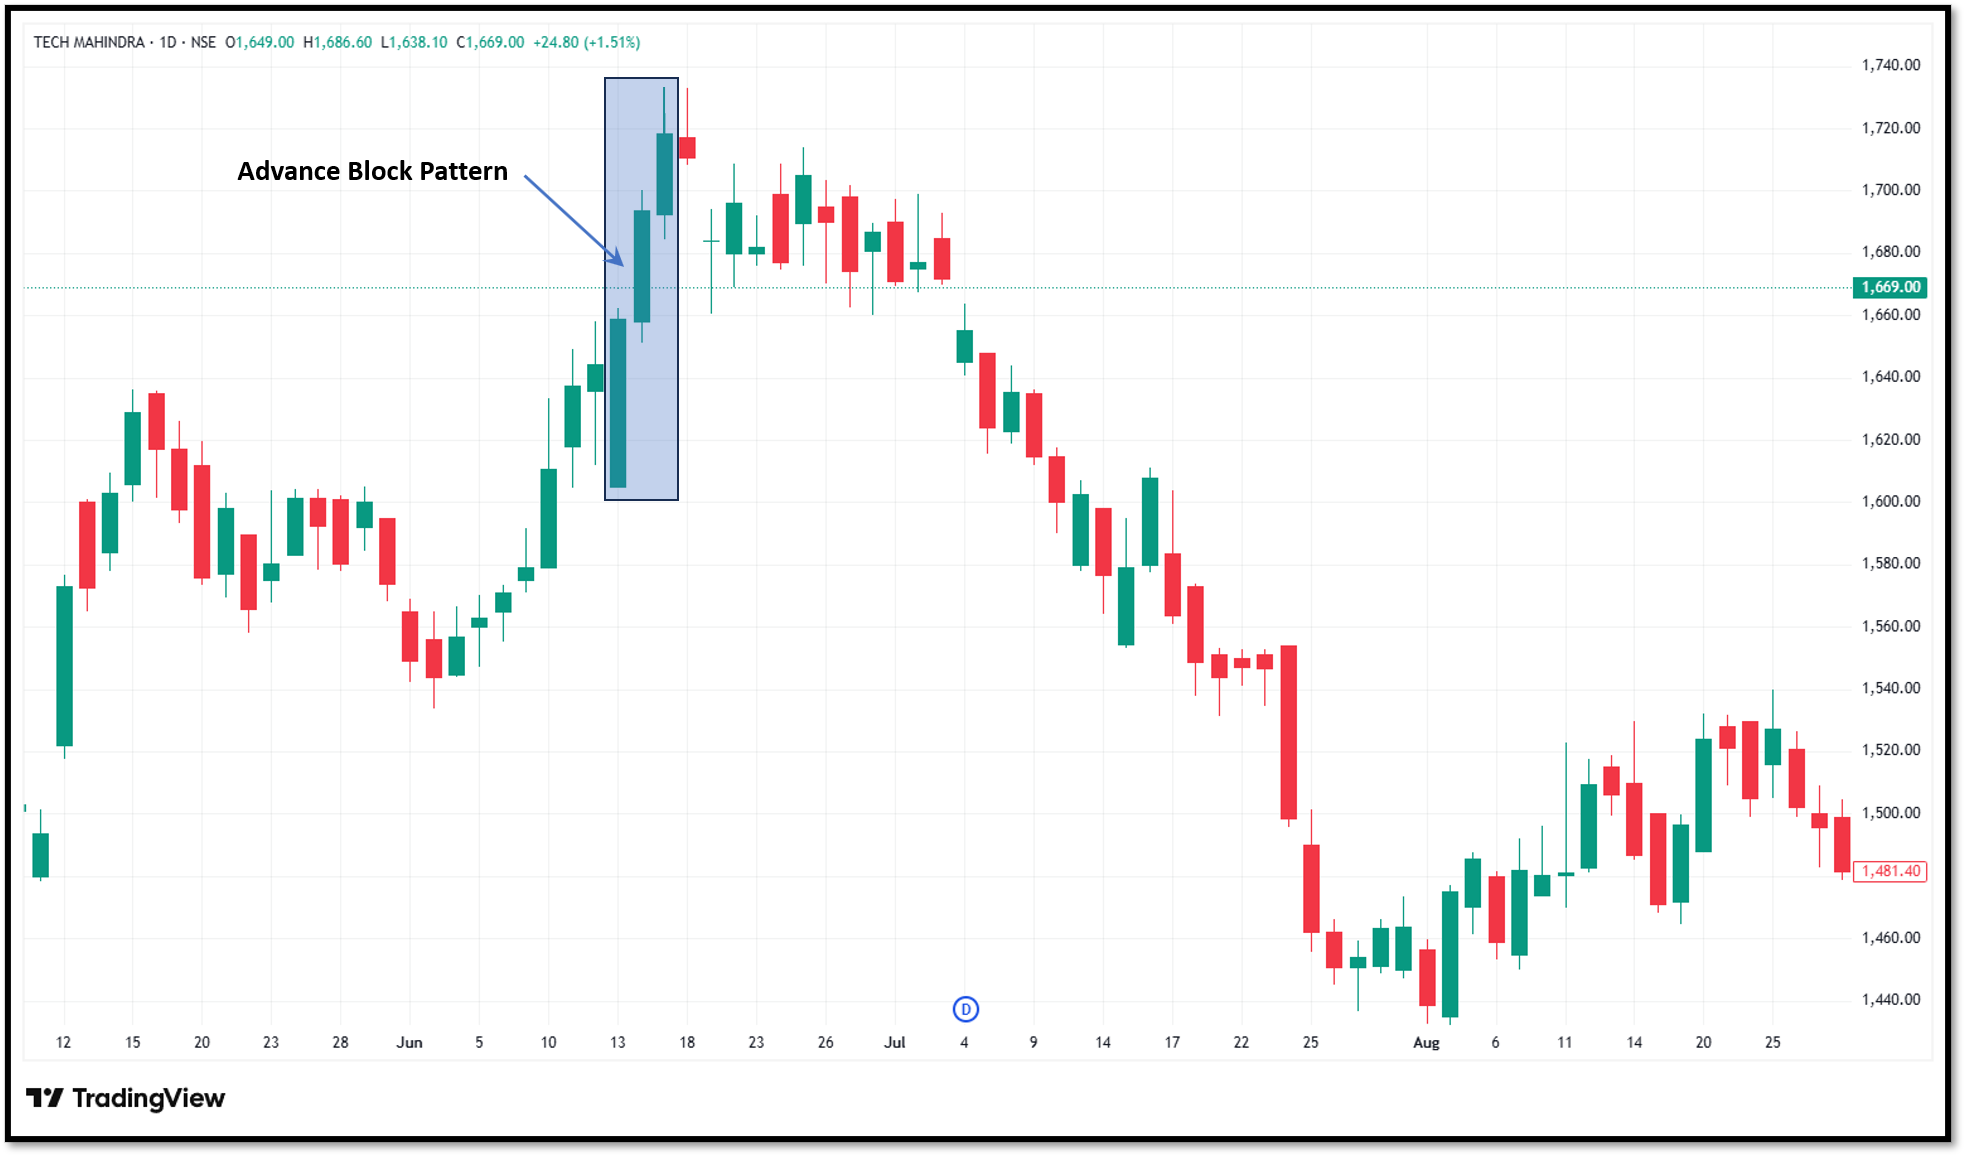
The Advance Block Candlestick Pattern is a bearish reversal pattern containing three candles that emerges in an ongoing uptrend. It signals that even though buyers keep driving prices up, their momentum has started to weaken gradually.
Unlike bullish continuation patterns where every candle closes higher than the previous one, the Advance Block pattern indicates that each successive bullish candle is less strong. The real body sizes decrease, and the upper wicks grow longer, which indicates decreasing buying pressure.
The decrease in momentum in this pattern serves as a warning signal rather than a reason to immediately go short. Traders generally wait for additional technical indicators before opening a bearish position.
How does the Advance Block Pattern form?
The Advance Block pattern forms after three trading sessions. Although prices continue to rise, the strength behind each move weakens.
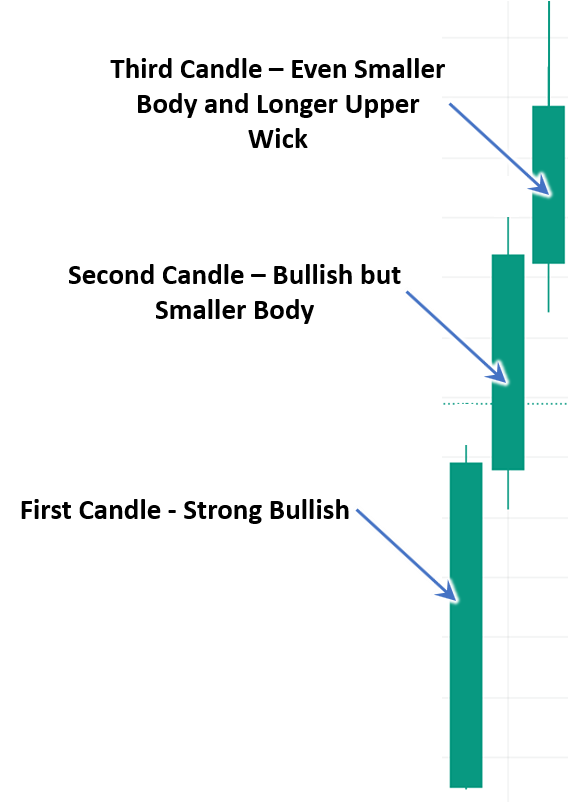
The first candle is a strong bullish candle indicating that buyers are fully in control. At this stage, the upward trend looks healthy with ongoing positive market mood.
The second candle also closes at a higher level, with a shorter body compared to the first one. As prices move upwards, a longer upper shadow appears, indicating that bears are becoming active when prices increase. Even though buyers are still in control, they are beginning to face resistance.
By the third candle, this weakness is more apparent. The real body is even shorter, with a longer upper wick, indicating weakening buying power as the sellers are taking control.
How to trade the Advance Block Candlestick Pattern
Once you know the valid pattern, the next step is executing a disciplined trade. Here are a few strategies:
Identify the pattern
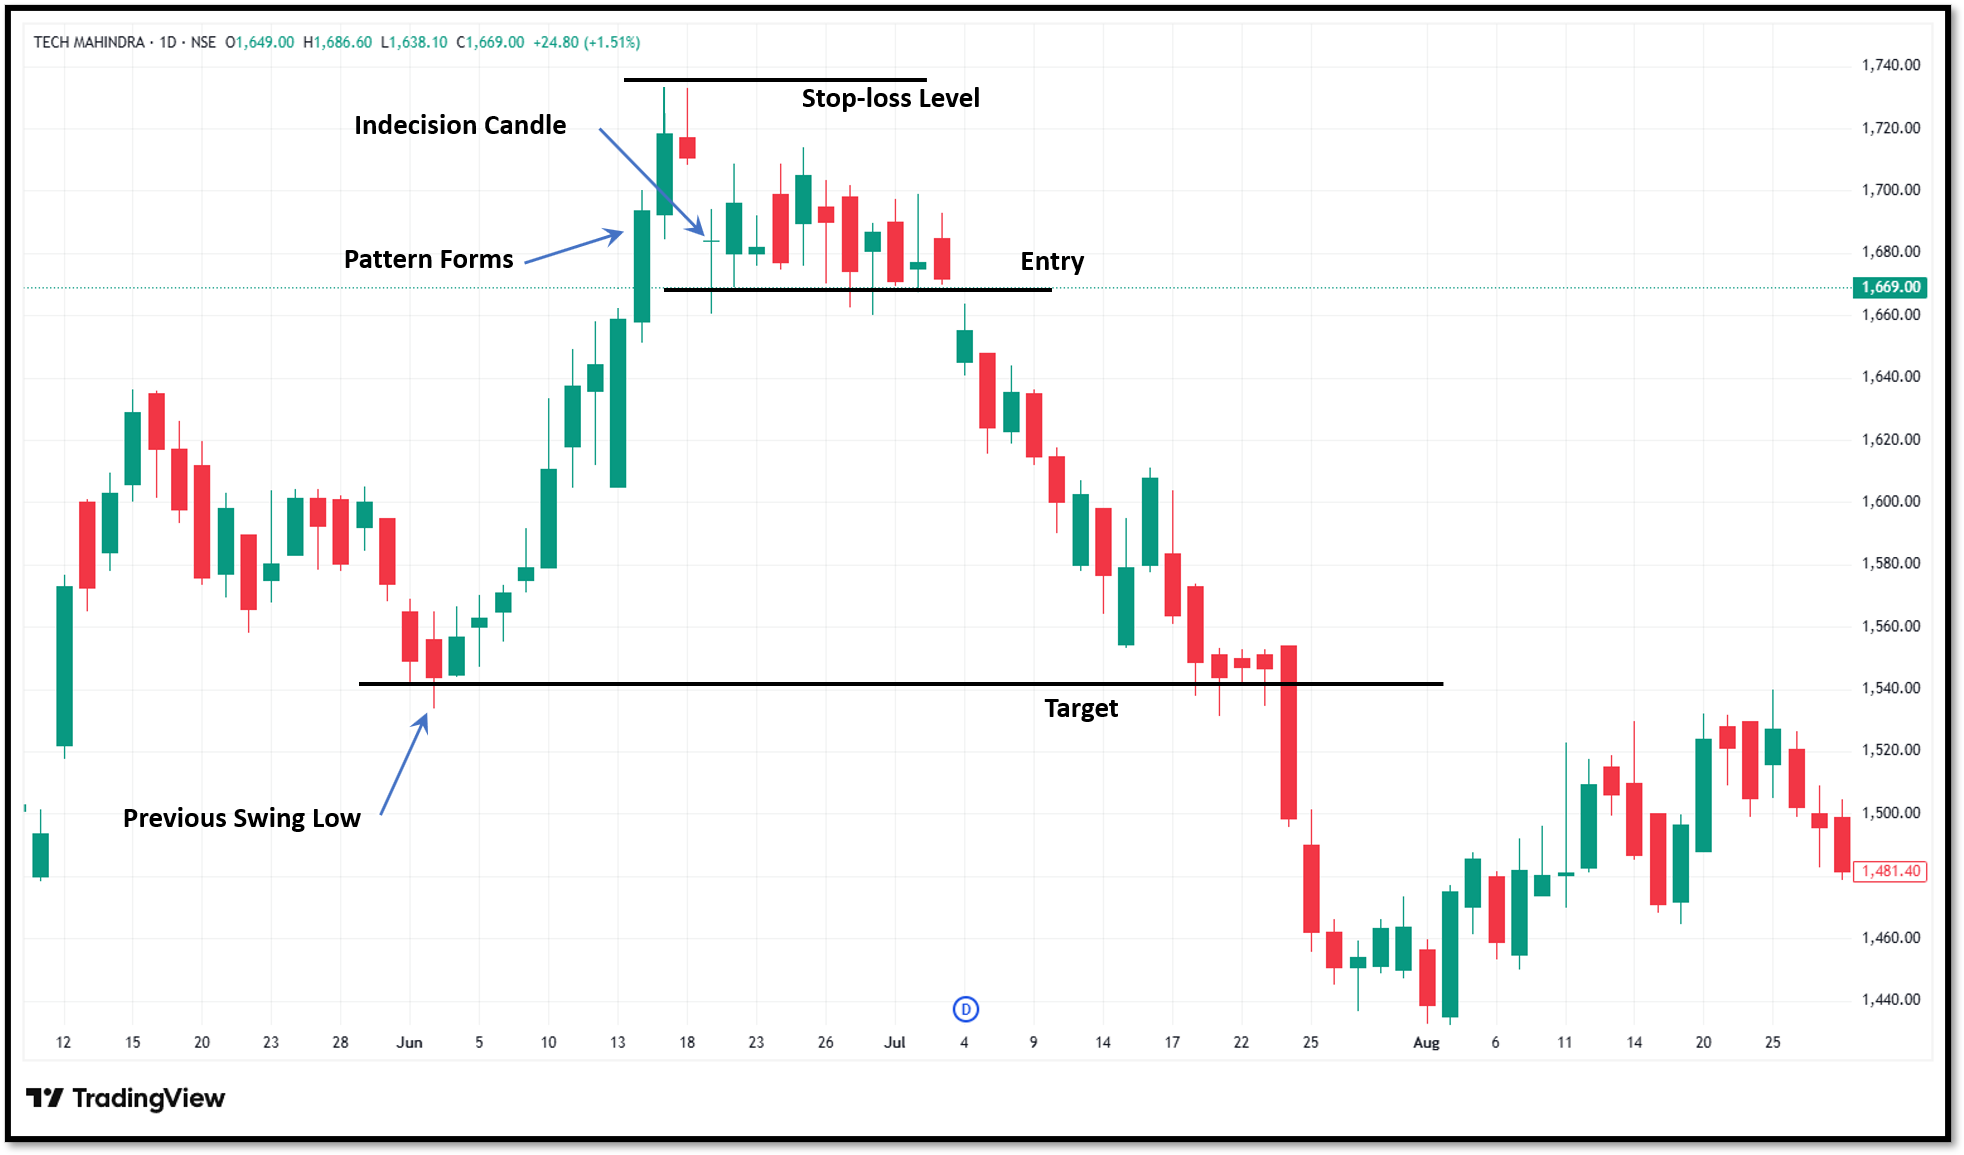
Start by identifying the current trend and monitoring the price movement. Look for three bullish candles in an uptrend with shrinking bodies and long upper wicks.
Trend confirmation
Use patterns to confirm an ongoing trend. Follow the momentum of the trend, and then make trades in the direction with a higher probability of success. Confirm it with other indicators like volume, support levels, or momentum before taking any action.
Entry points
Determine a suitable entry point once the pattern completes, such as after a breakdown below the pattern or a bearish candle formation, to increase potential gains.
Stop loss
A stop loss is important in every trade. Place the stop loss right above the highest point of the pattern to prevent heavy losses if the market goes up and the trader is holding a short position.
Set a target
Measure the vertical height of the pattern from its highest point to its lowest point, then project this distance downwards from the breakout point. This will give you an estimated minimum target price for when the breakout occurs.
Position sizing
Manage trade size according to your risk tolerance and portfolio exposure. Controlling position sizes makes sure that no single trade significantly affects overall capital.
When the Advance Block Pattern works best
Not every advance block is equally important. It is usually more significant under the following circumstances:
Established uptrend - After a long, well-established uptrend, the longer and stronger the rise before the pattern, the more probable the exhaustion is real.
Daily or weekly charts – The pattern is more reliable in higher timeframes like daily or weekly charts as compared to intraday ones where random price fluctuations could generate a similar appearance
Near a resistance level - When the pattern’s high aligns with a level the stock struggled to cross previously, it becomes an even stronger case.
Falling volume - The decreasing volume over three candles supports this notion that fewer participants are ready to buy at the top.
Confirmation candle - The confirmation candle right after a bearish candle closing below the low of the second or third candle transforms a potential pattern into an actionable one.
When you should avoid trading the Advance Block Pattern
Understanding when not to trade the pattern is as important as knowing how to trade it.
No prior uptrend: This pattern indicates weakness after a bullish trend. Its importance decreases when it occurs within sideways or bearish markets.
During a bullish rally: In a highly momentum-driven market, when sellers are not able to stop buyers from pushing prices higher even with a resistance breakout.
Near major news or events: Events like quarterly earnings, RBI policy announcements or global economic data can disrupt sense in trading and result in random price shifts.
Without a confirmation candle: Jumping into a trade right after the third candle carries some level of risk. Hold off until you see a bearish confirmatory candle or a drop below a support level before opening a position.
When volume supports the uptrend: This occurs when buying volume is high during the formation of a pattern; this might show that buyers remain firmly in command, making the bearish signal less reliable.
Advantages of the Advance Block Pattern
Some advantages of the advance block pattern are:
- Unlike many reversal patterns that appear after the market has actually turned, the advance block warns traders that bullish momentum is gradually losing steam.
- The pattern motivates traders to study the current market environment rather than mindlessly going along with an ongoing uptrend.
- After grasping its structure, the pattern is easy to identify as it consists of three consecutive bullish candles with decreasing momentum.
- The pattern becomes more reliable when combined with indicators such as RSI, MACD, moving averages, and volume analysis to confirm the trend reversal.
- The pattern is found in stocks, indices, forex, commodities, and even cryptocurrencies, providing opportunities to trade with various market players.
Limitations of the Advance Block Pattern
Some limitations of the advance block candlestick pattern are:
- The pattern is just a sign that the buying momentum is weakening. Before entering a trade, a bearish confirmation candle is still required.
- In strong bull markets, prices may continue rising even after the pattern has formed.
- The reliability of the pattern drops significantly if there is no clear upward trend before the pattern forms.
- Although effective at times, the pattern does not show if there will be a minor pullback or a major trend reversal in the market even after trading on it.
- Trading solely on this pattern can lead to inaccurate trade entries. The pattern is more effective with the support of volume, resistance levels, and additional technical indicators.
Trading tips for the Advance Block Candlestick Pattern
Here are some important tips traders should consider before entering a trade:
- Always wait for a confirming candle before taking action. Developing this habit will help eliminate false signals because a pattern serves as just a warning, not a guarantee.
- Prefer daily or weekly charts rather than the short-term intraday ones. The shorter periods are susceptible to random fluctuations that may resemble an advance block but do not represent it.
- Observe the volume trend across three candles. Decreasing volume gives more credibility to the notion that buyers are losing momentum.
- Verify the setup against a support or resistance level, or additional indicators like MACD and RSI, rather than relying solely on candle formation.
- Never engage in any trading activity without placing a stop loss order. If the breakout turns out to be false, a stop loss order can help limit the financial losses.
- Review historical price charts to understand how effectively the chart pattern has performed across various market conditions, including its strength and weakness.
The final call
The advance block candlestick pattern is a strong bearish pattern indicating a steady decline in bullish strength and a possible change in the market mood.
Even though the pattern is rare, it offers good trading opportunities whenever it appears at significant chart points, including resistance lines, Bollinger Bands, moving averages or after a break and re-test trading strategy.
Just like all candlestick patterns, the advance block pattern should not be traded alone. To enhance its performance, this pattern must be combined with market analysis, trend analysis, as well as proper risk management. Understanding this pattern and practising identifying it on actual charts enables traders to include another effective tool in their arsenal for price action trading.
FAQs
What does the advance block candlestick pattern tell traders?
The advance block candlestick pattern generally indicates that it's a bearish reversal pattern and that the current uptrend might be ending. It serves as a signal that the bulls are losing control while the bears are gaining strength.
How does the advance candlestick pattern look?
The advance block pattern is made up of three long-bodied candlesticks that move together upwards. It starts with the first longest candle, followed by a second one that is shorter than the first, and then the third and final candle, which is the shortest of the three.
How effective is the advance block candlestick chart pattern?
The success rate for the advance block candlestick pattern is 65%. Therefore, it can be considered a reliable chart pattern.
How rare is the advance block pattern?
It is quite rare. Therefore, you will hardly ever come across a valid setup.
Should I wait for confirmation to trade it?
Yes. Since the pattern’s actual trading results are somewhat mixed, experienced traders wait for a bearish candle to close below the high of the third candle rather than acting immediately on the completed pattern.







