Bullish Candle Patterns







Key takeaways:
- Bullish candle patterns indicate the possibility of the price going up in the market.
- These formations can help traders identify buying pressure and trend reversals.
- These are often used in trading stocks and commodities.
- Popular bullish patterns include Hammer, Bullish Engulfing and Morning Star.
- Candlestick patterns are more effective when used with technical indicators and volume analysis
Understanding price action is one of the most important parts of trading, for which traders use candlestick charts to identify trends and potential reversals. There are many chart formations you can use, but bullish candle patterns are very useful because they help you with upward momentum and buying pressure trends. In this article, we will cover more on what bullish candle patterns are, and how you can use them.
What are Bullish Candle Patterns?
Bullish candle patterns are candlestick patterns indicating that prices may rise. These patterns usually form after a downtrend or during a market correction and signify that buyers are slowly taking over.
In a given time period, a candlestick chart shows four important prices:
- Opening price
- Closing price
- Highest price
- Lowest price
A bullish candle is formed when the closing price is higher than the opening price. If many bullish formations appear, this can be a sign of a possible trend reversal or continuation.
Why traders use Bullish Candlestick Patterns
Bullish patterns are attractive because they are simple to recognise and provide a quick glimpse into market sentiment. Traders watch them to see if buyers are taking control and sellers are losing momentum.
These patterns are also useful because they can help traders:
- Spot possible buying opportunities
- Identify reversal zones
- Improve trade entries
- Understand market behavior
But candlestick patterns should never be used in isolation. Experienced traders combine them with trading volume, support and resistance levels and technical indicators for better confirmation.
8 Most Popular Bullish Candle Patterns
Here are the top bullish candlestick patterns traders use to identify potential uptrends.
1. Hammer & Inverted Hammer
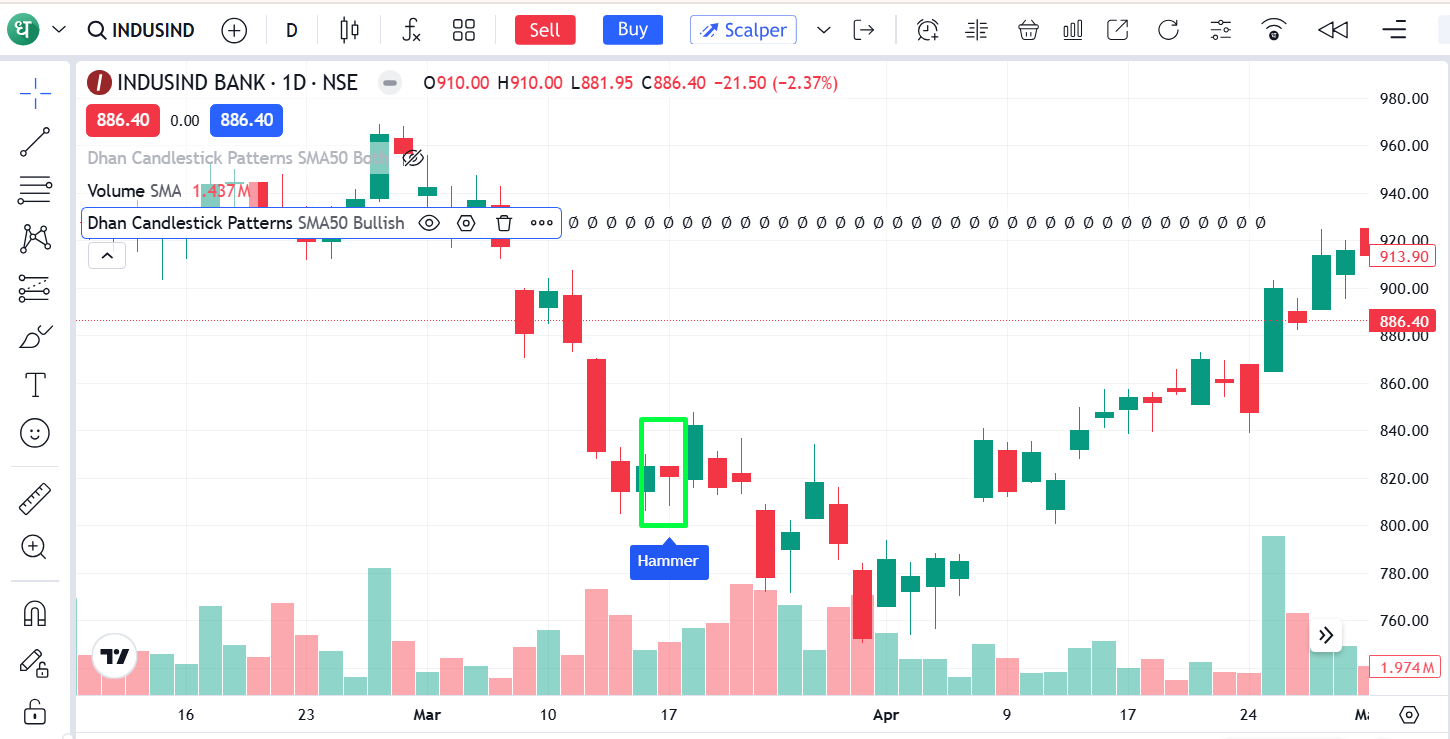
The hammer and inverted hammer are bullish reversal candlestick patterns that usually occur at the end of a downtrend.
The Hammer pattern has a small body at its top and a long lower shadow.
And the Inverted Hammer has a small body at its bottom and a long upper shadow.
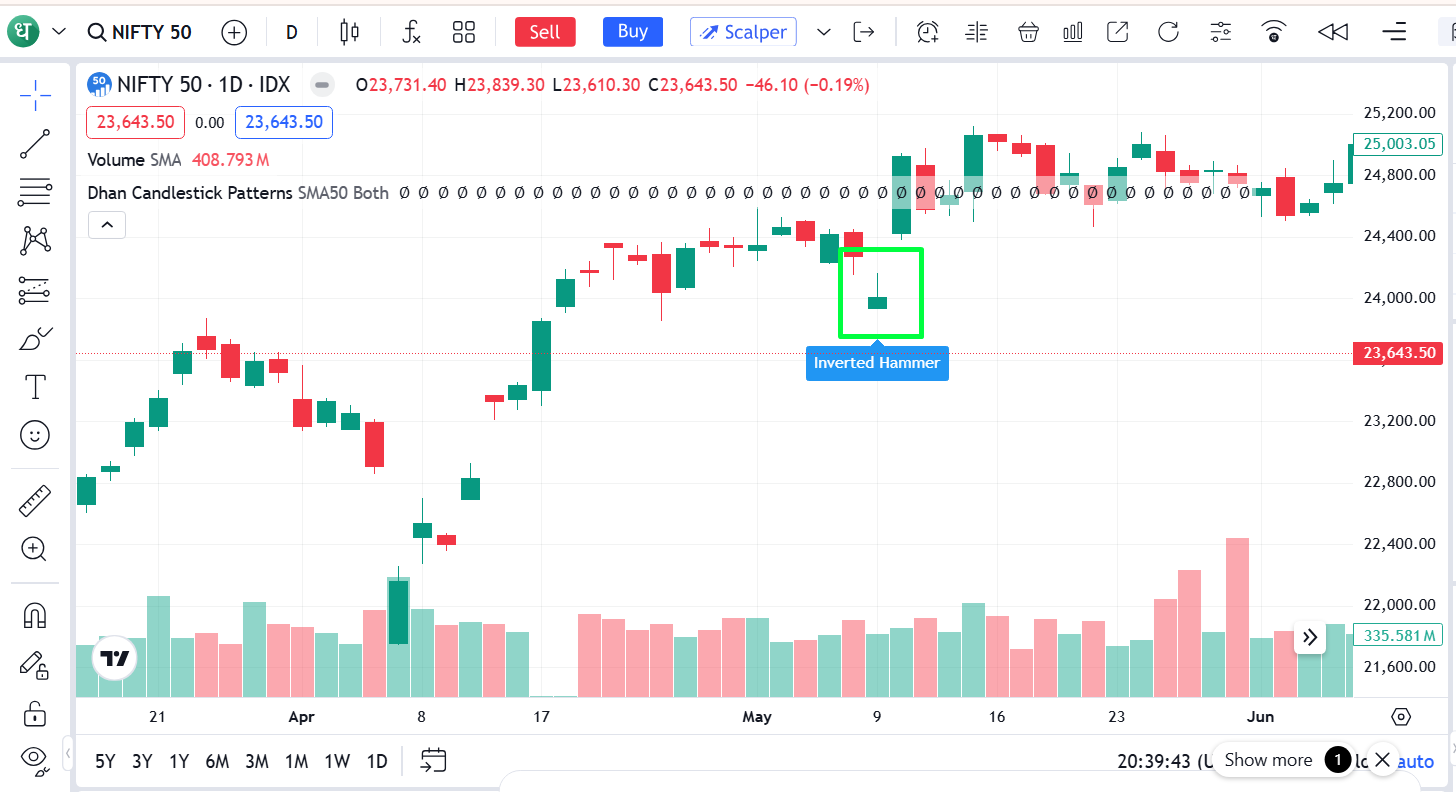
Both patterns suggest that selling pressure could be easing, and that buyers could be taking control of the market.
Key characteristics of hammer & inverted hammer:
- Appears after a downtrend
- Potential bullish reversal sign
- The hammer has a long lower shadow.
- Inverted Hammer has a long upper shadow
- A small candle body indicates weakening selling pressure
- With confirming candles and more robust near support zones
2. Bullish Engulfing
The Bullish Engulfing pattern is a two-candle pattern that signifies strong buying pressure in the market. It often appears after a bearish trend and indicates a potential reversal.
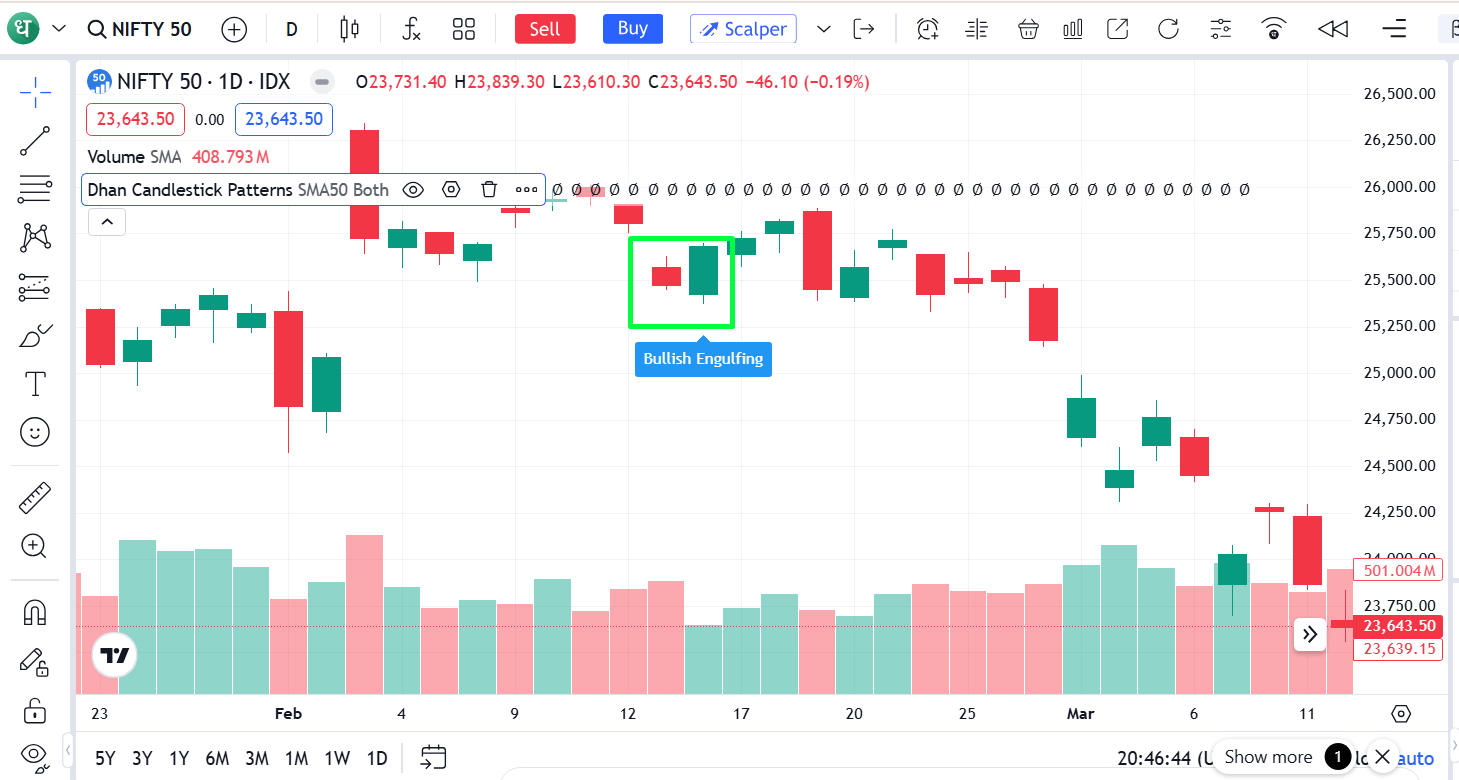
Key characteristics of the bullish engulfing pattern
- There are two candles
- The second candle covers the first candle completely
- Signifies strong buying pressure
- Shows up after a downtrend
- More reliable with more volume
3. Morning Star
A three-candle bullish reversal pattern, the Morning Star pattern is often seen after a downtrend. It shows that the selling pressure is diminishing and buyer strength is beginning. The first candle is a bearish candle, the second candle has a small body showing indecision, and the third candle is strongly bullish.
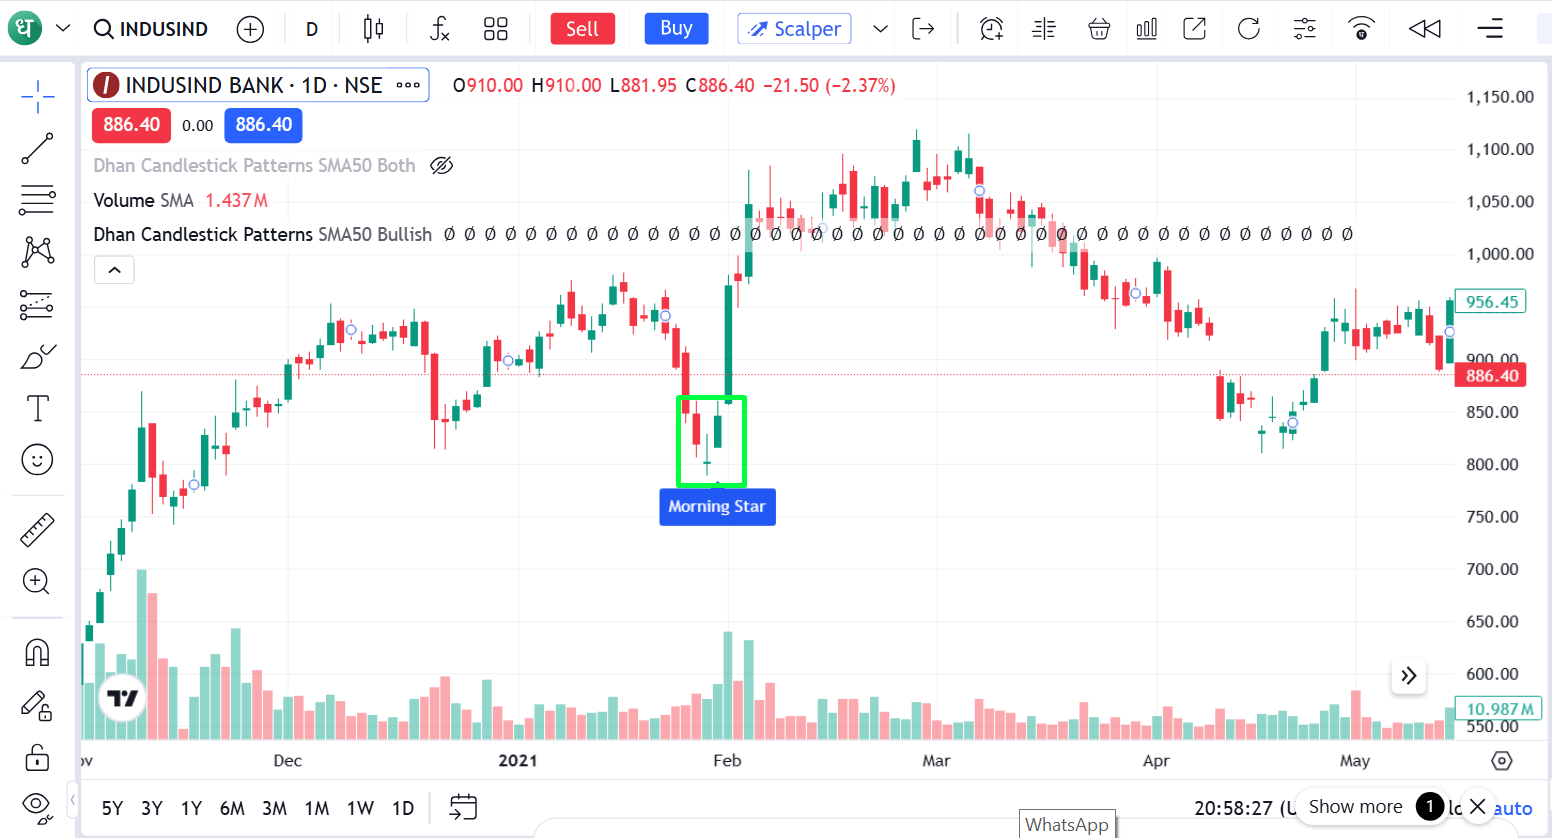
Key characteristics of the morning star pattern:
- Three-candle reversal pattern
- Looks like after a downtrend
- Market indecision, middle candle
- The third candle confirms the bullish momentum
- Indicates potential trend reversal
4. Piercing Line
The Piercing Line pattern appears after a bearish trend and indicates a possible recovery of the market. It indicates increasing demand following heavy selling.
First candle is bearish, second candle is bullish with open lower than the previous candle but close higher than the midpoint of the previous candle. That suggests buyers stepped in aggressively after the early weakness.
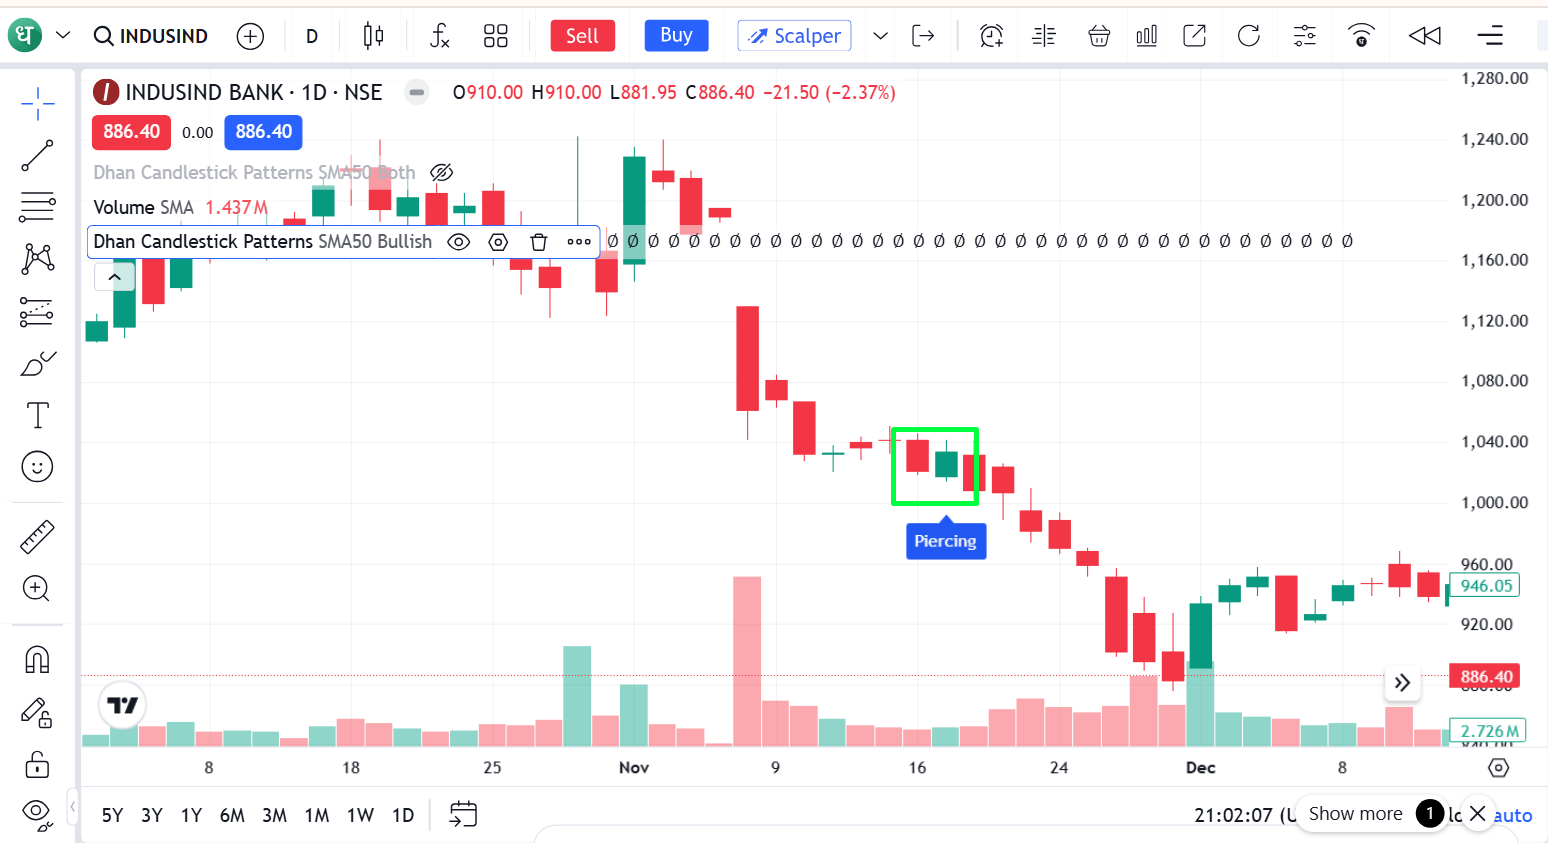
Key characteristics of piercing line pattern:
- Two candles bull pattern
- Close second candle above the middle of the first candle
- It follows a downtrend
- Shows increasing buying pressure
- Signals a possible reversal
5. Tweezer Bottoms
Tweezer Bottoms are a common bullish reversal candlestick pattern used by traders in a variety of markets.
This pattern consists of two candles, one being bearish and the other bullish, and both are usually of similar size, signalling a change in market momentum.
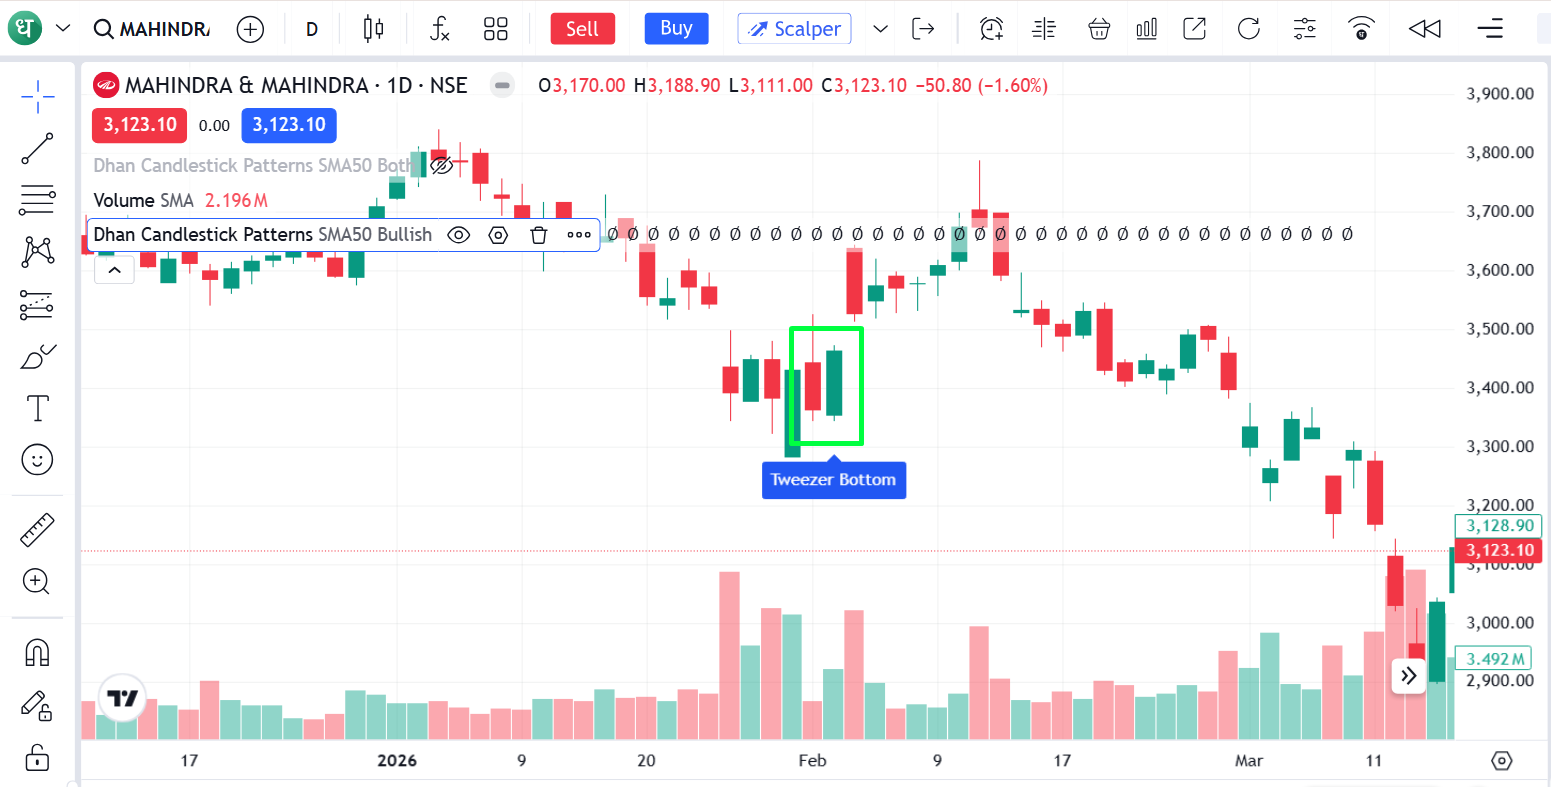
Key characteristics of tweezer bottoms:
- Made with two candles
- Formed after a downtrend
- Has one bearish and one bullish candle
- In general, both candles are similar in size
- Indicates strong support at the price level
- Points to a potential bullish reversal
6. Three White Soldiers
The Three White Soldiers pattern is a powerful bullish pattern that consists of three consecutive bullish candles. Usually occurs after a long downtrend and indicates strong upward momentum.
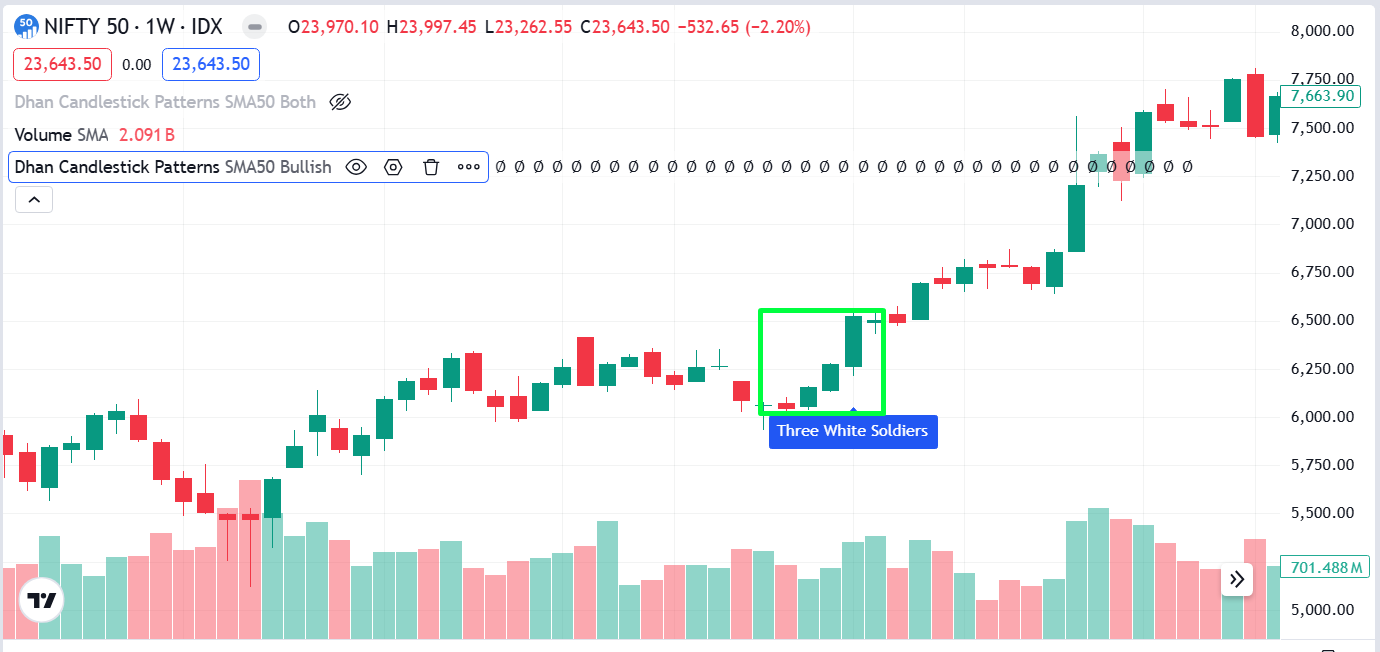
Key characteristics of the three white soldiers pattern:
- Three consecutive up candles
- Closing prices are going higher every session
- Strong buying momentum.
- Forming after a downtrend.
- Trends reversal or continuation indication
7. Bullish Harami
The Bullish Harami pattern is a two-candle reversal pattern. It indicates the bearish momentum is losing steam, and the market could change direction.
The pattern begins with a large bearish candle, then a smaller bullish candle, which remains within the body of the previous candle.
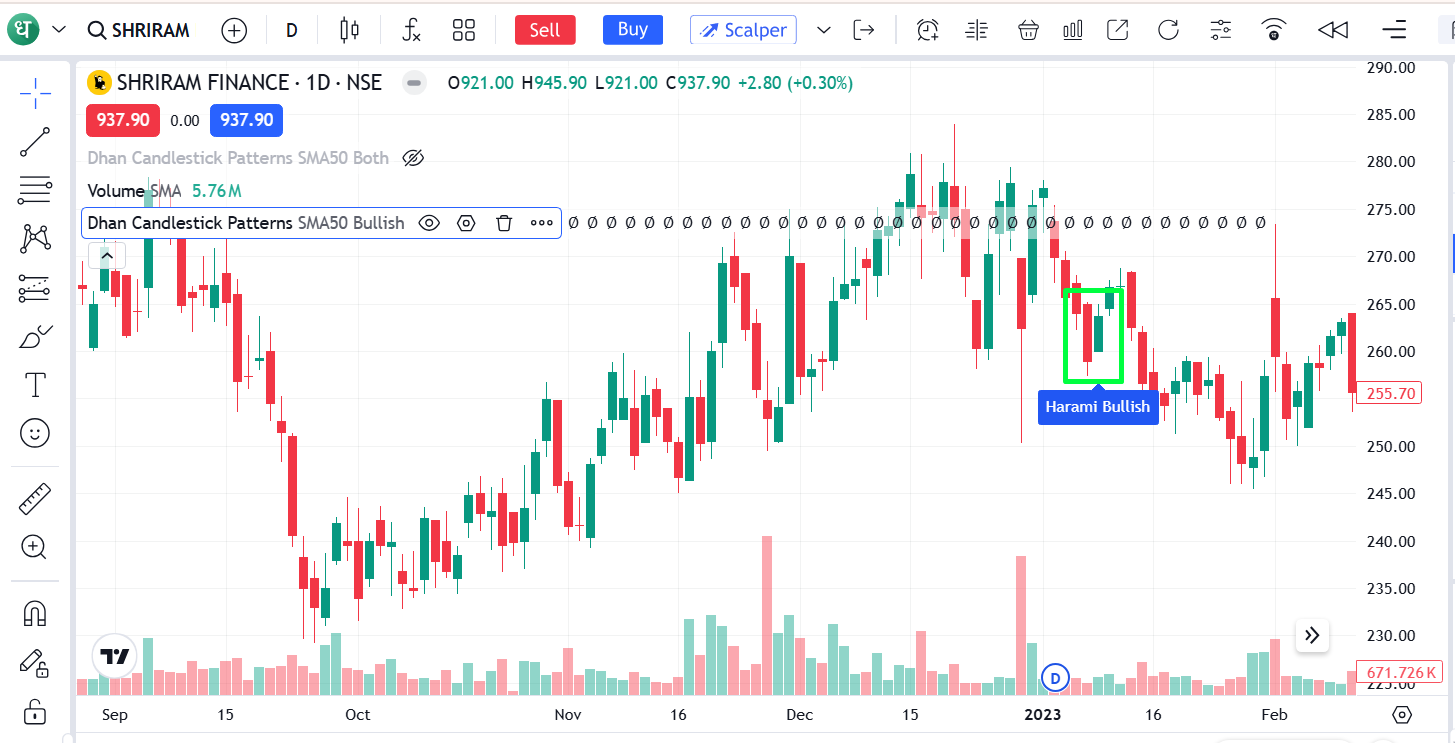
Key characteristics of the bullish harami pattern:
- Reversal pattern: Two candles
- bullish candle inside of previous bear candle
- Indications of diminishing selling pressure
- Indicates market indecision
- Potential bullish reversal shows
8. Doji
The Doji pattern shows that there is indecision in the market and is formed when the opening and closing prices are almost identical. The Doji by itself is not always bullish, but it could be a possible trend reversal after a heavy downtrend.
The candle usually has a very small body with upper and lower shadows, and this means that the buyers and sellers are equally active in the market.
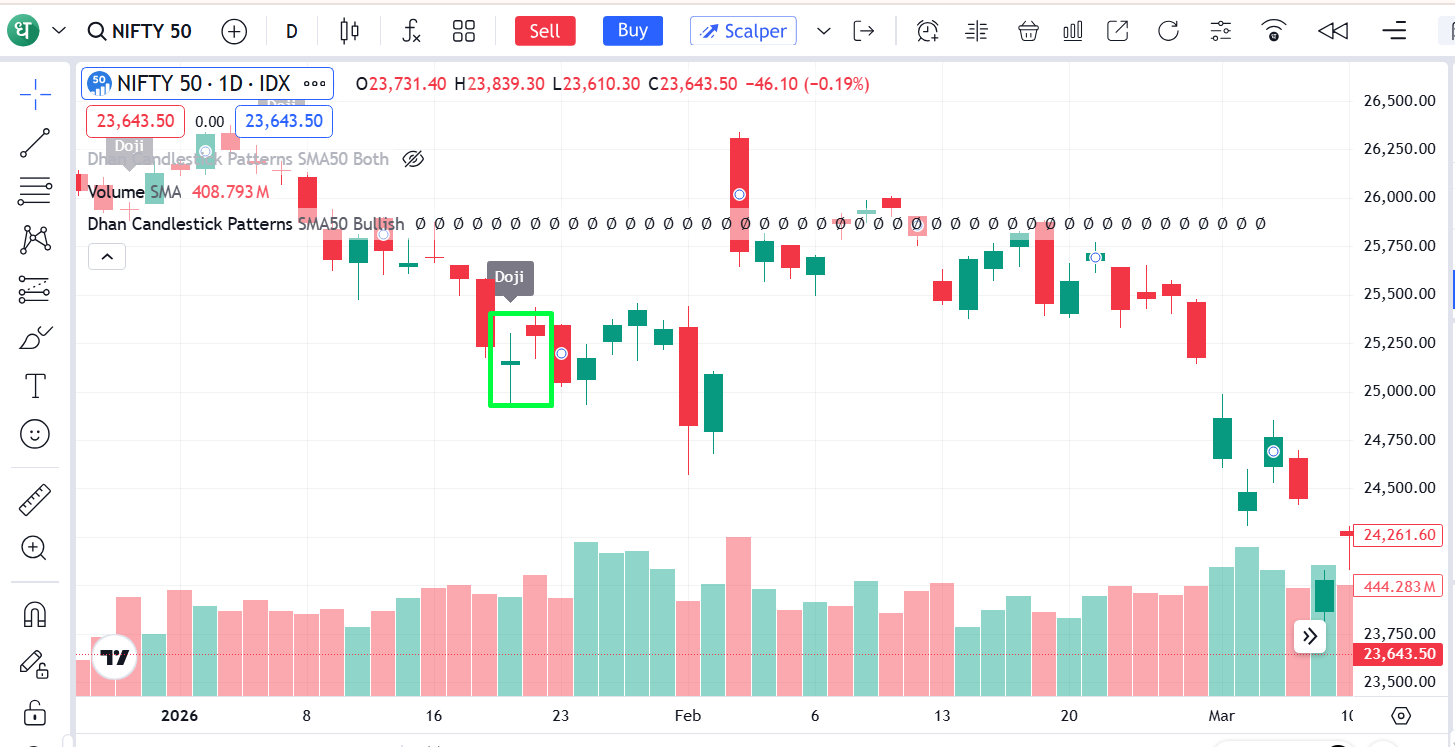
Key characteristics of the Doji pattern:
- Small Candle Body
- The opening and closing prices are similar
- Show apathy market uncertainty
- May indicate a trend reversal from the downtrend
- Need confirmation from the next candle
Best timeframes for Bullish Candlestick Analysis
Bullish candle patterns work on different time frames of charts.
Day traders often use 5-minute or 15-minute charts for short-term trades. Swing traders tend to use 4-hour or daily charts because they give clearer signals without much noise.
Long-term investors might use weekly or monthly charts to identify longer-term market trends.
Higher timeframes are giving stronger and more reliable signals in most cases.
To Conclude
Learning these bullish candle patterns can help traders get a better idea of price action and market psychology. Popular patterns are The Hammer, Bullish Engulfing, Morning Star and Three White Soldiers as they can provide early warning signs of a possible upward move.
As you learn more about bullish candlestick formations, over time, this could be a useful skill to identify market opportunities with more conviction.
FAQs
Which bullish candlestick pattern is considered the strongest?
The Bullish Engulfing and the Morning Star are viewed by many traders as some of the strongest reversal signals.
Do bullish candle patterns work in all markets?
Yes. These patterns are used a lot in stock, forex, commodity and more.
Can beginners learn candlestick trading easily?
Yes. Compared with many advanced trading strategies, candlestick patterns are visually simple and beginner-friendly.
Is confirmation necessary before trading bullish patterns?
Yes, trading with confirmation of volume, indicators or support levels increases the accuracy of trades.
Are bullish candle patterns always successful?
No, they only increase the probability of market moving up and should always be used in conjunction with proper risk management.