



Bullish Counterattack Pattern








Key takeaways
- The bullish counterattack pattern is a two-candlestick bullish reversal pattern that appears after a downtrend and may indicate that selling pressure is beginning to weaken.
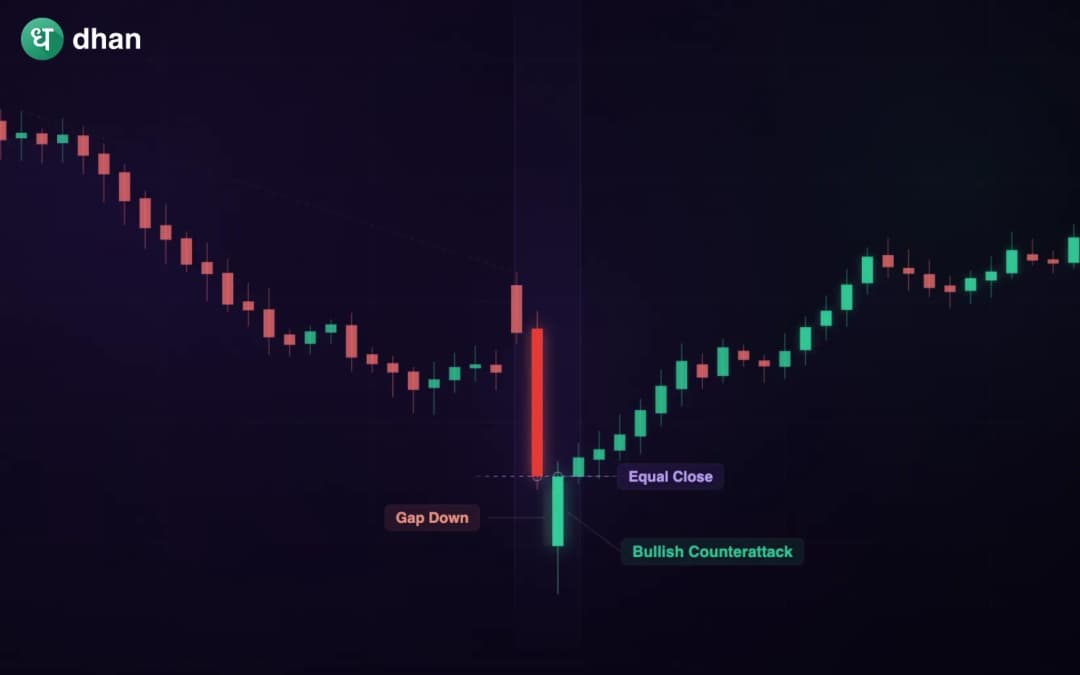
- The pattern is formed when a strong bearish candle is followed by a bullish candle that opens lower but closes near the previous candle's closing price.
- Traders should always wait for confirmation and combine the pattern with technical indicators, support levels, and volume analysis before making trading decisions.
Traders usually try to find reversals as it can be an opportunity. But spotting the reversals early is not easy. Prices often continue declining even after appearing oversold, while some reversals happen with very little warning. This is why traders pay close attention to candlestick patterns that reveal shifts in market sentiment.
One such pattern is the bullish counterattack pattern. Although it is less common than patterns like the bullish engulfing or hammer, it provides valuable insight into the battle between buyers and sellers. Instead of showing immediate buying dominance, it highlights a situation where buyers successfully counter a strong wave of selling, suggesting that bearish momentum may be losing strength.
Even though the bullish counterattack pattern isn’t a buy signal in any case, it works best with confirmations from price action, indicators and overall market structure.
What is a Bullish Counterattack Pattern?
The bullish counterattack pattern is a two candlestick pattern that usually forms after an established downtrend and signals a bullish reversal.
The first candle is a long bearish candle, reflecting strong selling pressure. The second candle opens with a gap down, suggesting that sellers are still in control at the start of the session. However, buyers step in aggressively and push the price higher, causing the candle to close at or very close to the previous candle's closing price. This sudden recovery indicates that buyers have successfully challenged the prevailing bearish sentiment.
How does Bullish Counterattack Pattern form?
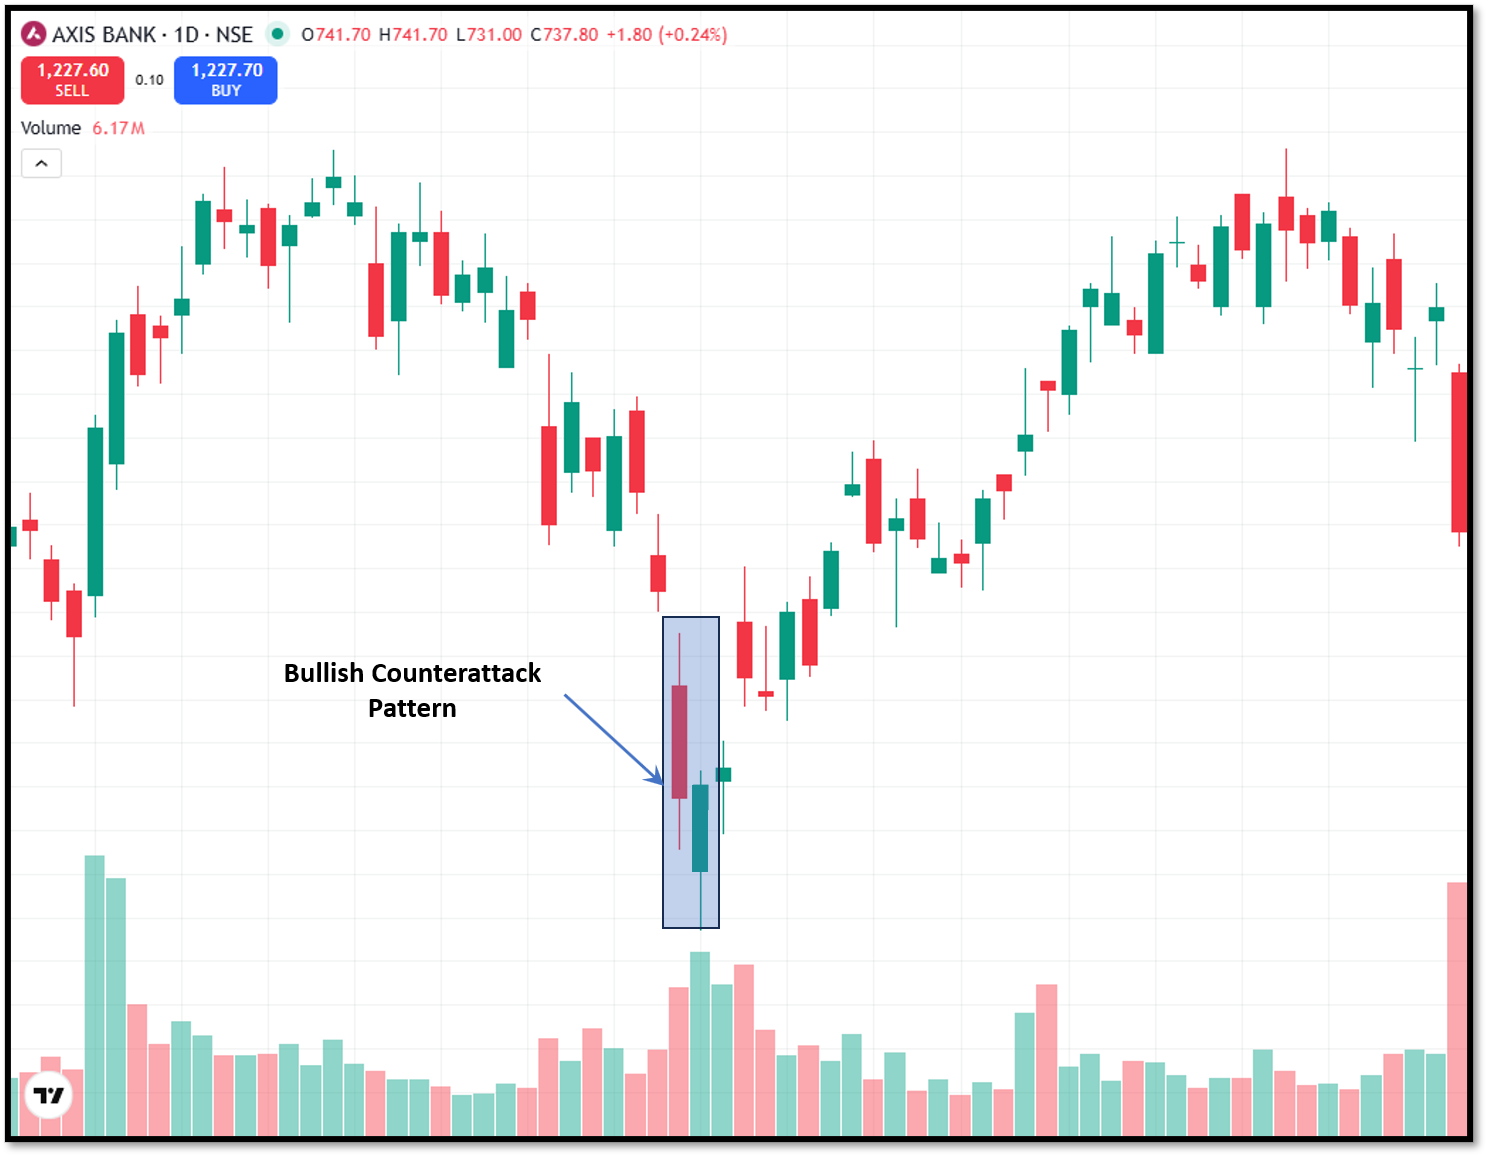
The pattern develops over two consecutive trading sessions. The first candle is a large bearish candle that continues the existing downtrend. The candle shows that the sellers remain firmly in control, and push prices lower throughout the session. The second candle opens below the previous day's close, creating the impression that the downtrend will continue.
But buying interest gradually increases during the session. Buyers absorb the selling pressure and drive the price higher until it closes at or almost exactly the same level as the previous candle's close.
What does the Bullish Counterattack Pattern indicate?
The bullish counterattack pattern reflects an important shift in market psychology. During the first session, sellers dominate the market and reinforce the ongoing downtrend. Confidence among bearish traders remains high as prices continue falling.
The following session begins with another bearish signal as prices gap lower. At this stage, many market participants expect further declines.
Instead, buyers gradually regain control throughout the trading session. By recovering almost the entire opening loss and closing near the previous day's close, they demonstrate that demand is beginning to match—or even overpower—selling pressure.
Bullish Counterattack vs Bullish Engulfing
Although both patterns suggest a possible bullish reversal, they are formed differently.
How to trade using the Bullish Counterattack?
A disciplined trading approach helps reduce false signals and improves decision-making.
Confirm the existing downtrend
The bullish counterattack pattern carries greater importance only after a noticeable decline. If the market is moving sideways, the pattern may not be reliable.
Wait for confirmation
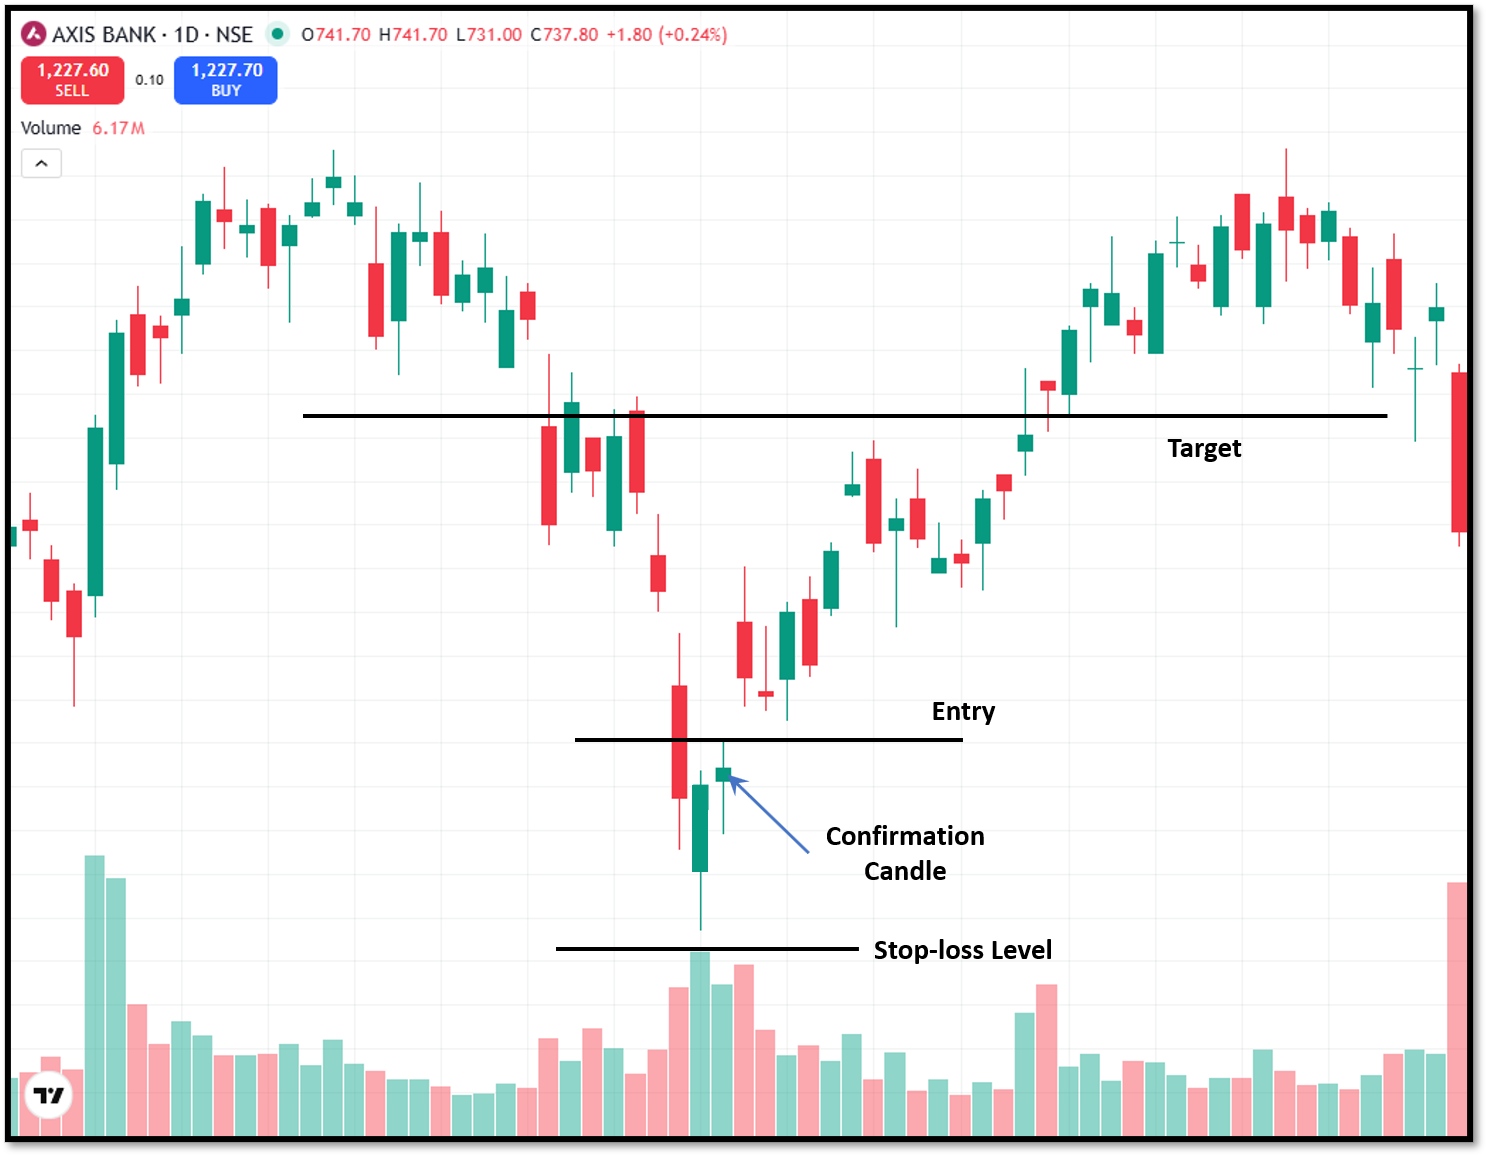
Avoid entering a trade immediately after the second candle forms. Traders usually wait for the next candle to close above the pattern or break a nearby resistance level.
Entry
Some traders enter after the confirmation candle closes, while others wait for a small pullback to obtain a better risk-reward ratio.
Stop-loss
A common approach is placing the stop-loss slightly below the low of the bullish counterattack pattern.
If prices move below this level, it may indicate that sellers have regained control.
Profit target
You may set the price target by using one of the following methods, whichever is suits the situation.
- Previous resistance levels
- Swing highs
- Fibonacci retracement levels
- Fixed risk-reward ratios such as 1:2 or 1:3
Indicators to use with the Bullish Counterattack
Although the pattern provides useful information, combining it with other technical tools generally improves its effectiveness.
Relative Strength Index (RSI)
If the bullish counterattack pattern forms while the RSI is in the oversold region, it strengthens the possibility of a bullish reversal.
Volume
Increasing buying volume during or immediately after the pattern usually indicates stronger participation from buyers, making the reversal more convincing.
Moving averages
The pattern becomes more meaningful when it develops near a widely watched moving average or after prices bounce from long-term support.
MACD
A bullish MACD crossover occurring around the same time as the pattern can provide additional confirmation that bearish momentum is fading.
Support levels
If the pattern forms near a key support zone, then it carries more significance than one which appears in the middle of nowhere.
Advantages of Bullish Counterattack Pattern
The bullish counterattack pattern offers the following advantages:
- The pattern shows that buyers are capable of reversing strong intraday losses after a prolonged decline. This can alert traders to monitor the market for a possible trend reversal.
- Since the pattern consists of only two candles with well-defined characteristics, even beginner traders can learn to recognise it quickly.
- Stocks, commodities, forex, indices and cryptocurrencies can all display the bullish counterattack pattern. Its interpretation is broadly similar across asset classes as it captures changes in the behaviour of buyers and sellers.
- When combined with support levels, RSI, MACD, moving averages, or volume analysis, the pattern becomes more useful for confirming potential reversals.
Limitations of Bullish Counterattack Pattern
Along with advantages, the bullish counterattack pattern has the following limitations:
- The pattern alone does not confirm that a new uptrend has begun. Waiting for the next bullish candle is essential.
- If the market is in a strong downtrend, the appearance of the pattern will be invalidated due to heavy selling.
- Traders may encounter the bullish counterattack pattern less frequently than patterns like the hammer or bullish engulfing.
- The pattern needs to be combined with other indicators like RSI, moving averages, support and resistance, etc. It can not act as a standalone signal.
Conclusion
The bullish counterattack pattern is a useful two-candlestick reversal pattern that highlights a possible shift in market sentiment after a downtrend. It shows that although sellers initially appear to be in control, buyers are able to recover much of the lost ground by the end of the session, signalling that bearish momentum may be weakening.
But the pattern should never be treated as a standalone buy signal. While trading the bullish counterattack pattern, confirmation, analysis of support levels, checking volume, etc. are important to trade effectively.
FAQs
Can beginners use the bullish counterattack pattern?
Yes, the bullish counterattack pattern is beginner-friendly. It is easy to identify and provides a structured way to trade.
Which indicators can be used with the bullish counterattack pattern?
RSI, MACD, moving averages, support levels, and volume analysis are commonly used alongside the bullish counterattack pattern to strengthen the reversal signal.
Does the bullish counterattack pattern work in intraday trading?
Yes. The pattern can appear on intraday, daily, and weekly charts. However, lower timeframes tend to generate more market noise, making confirmation especially important.
Where should traders place a stop-loss when trading this pattern?
A common approach is placing the stop-loss slightly below the lowest point of the pattern.
Can the bullish counterattack pattern be used in all financial markets?
Yes. The pattern can be applied to stocks, forex, commodities, indices, and cryptocurrencies because it reflects changes in market sentiment rather than asset-specific behaviour.







