



Double Candlestick Patterns








Key takeaways
- Double candlestick patterns are chart formations made up of two consecutive candles that provide clues about potential market direction.
- These patterns can signal either trend reversals or trend continuation depending on where they appear.
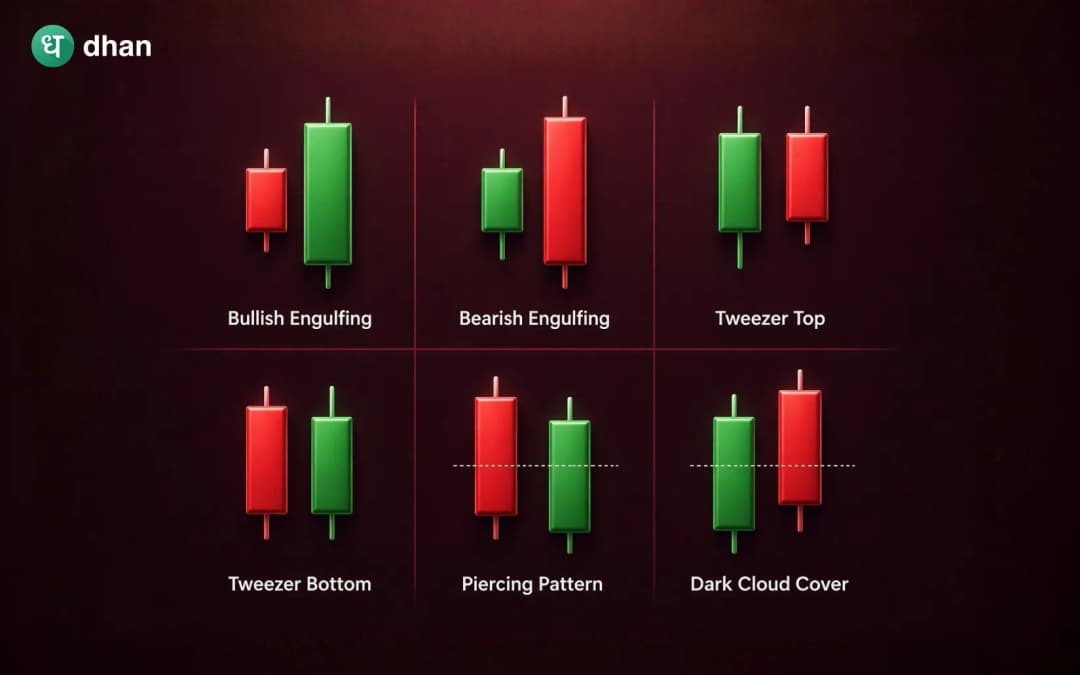
- Popular double candlestick patterns include Bullish Engulfing, Bearish Engulfing, Piercing Pattern, Dark Cloud Cover, Tweezer Top, and Tweezer Bottom.
Price charts constantly reflect the ongoing battle between buyers and sellers. Every candle tells part of that story, but sometimes a single candle is not enough to understand a meaningful shift in market sentiment.
This is where double candlestick patterns become useful.
As the name suggests, these formations consist of two consecutive candles whose relationship provides insight into changing market dynamics. They help traders identify moments when buyers may be gaining strength, sellers may be taking control, or an existing trend may be preparing to continue.
One reason double candlestick patterns remain popular is their simplicity. Chart patterns that can take weeks or months to develop, but the double candlestick formations emerge within a short period, allowing traders to react more quickly to changing conditions.
However, their effectiveness depends heavily on context. A bullish pattern appearing after a prolonged decline carries a different meaning than the same pattern appearing during a strong uptrend.
What are Double Candlestick Patterns?
Double candlestick patterns are technical formations created by two consecutive candles. The relationship between the two candles provides information about the balance between buyers and sellers. These patterns are generally categorised into the following patterns:
- Reversal patterns
- Continuation patterns
Reversal patterns suggest that an existing trend may be losing momentum and could change direction. Continuation patterns indicate that the current trend may resume after a temporary pause.
The significance of the pattern depends not only on its structure but also on where it appears within the broader market trend.
Bullish engulfing pattern
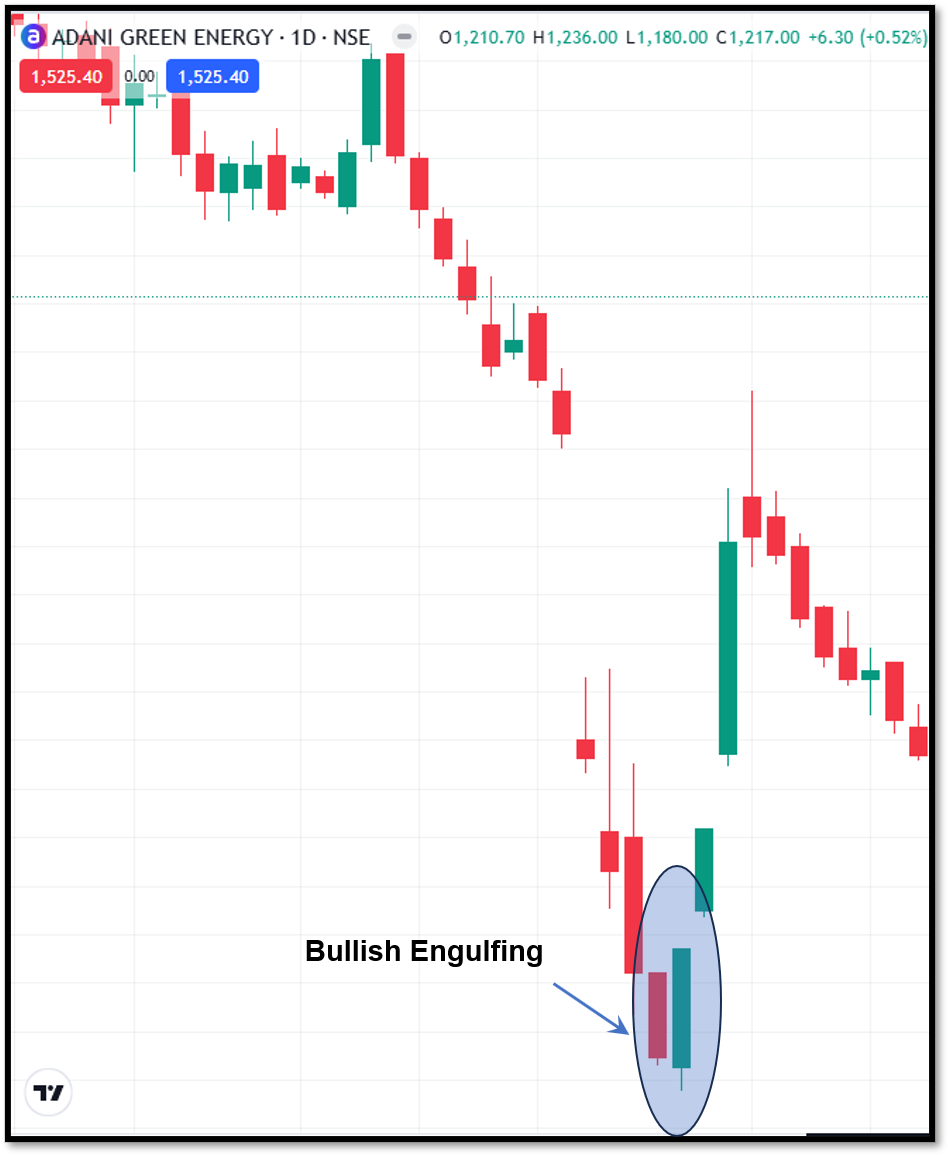
The Bullish Engulfing pattern is one of the most widely recognised bullish reversal formations. It consists of:
- The first candle is a bearish candle
- Following the first candle is a strong bullish candle which completely swallows the previous candle
The pattern typically forms after a downtrend. The first candle confirms seller dominance. The second candle shows buyers returning aggressively and completely overcoming the previous session's selling pressure.
This shift often signals increasing bullish momentum. Many traders look for additional confirmation before entering long positions.
Bearish engulfing pattern
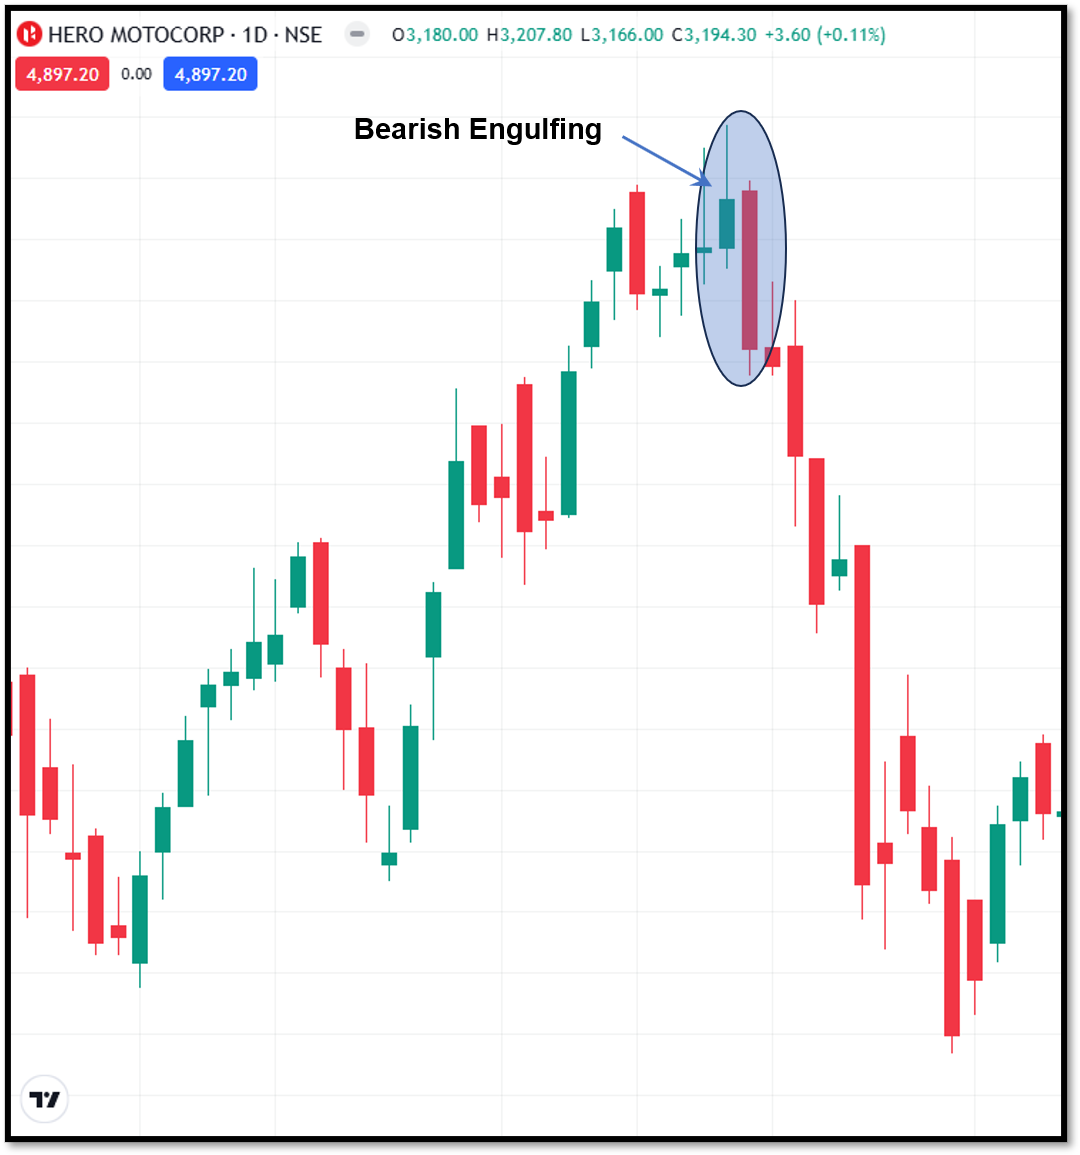
The Bearish Engulfing pattern is the opposite of the Bullish Engulfing pattern. Its structure consists of:
- A bullish candle
- A larger bearish candle that completely engulfs the previous candle's body
The formation usually appears after an uptrend. The strong bearish candle indicates that sellers have absorbed buying pressure and gained control of the market.
Because it reflects a sudden shift in sentiment, the pattern is commonly used to identify potential bearish reversals.
Piercing pattern
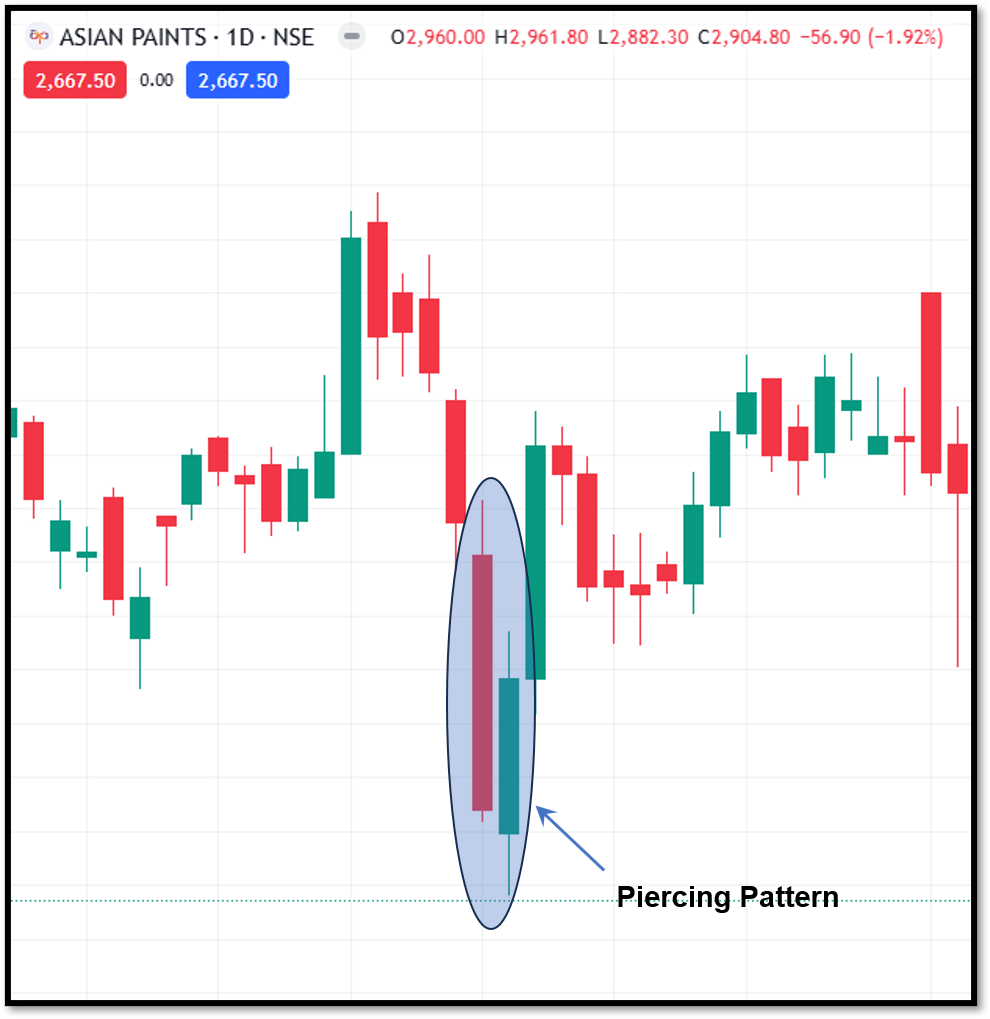
The Piercing Pattern is a bullish reversal pattern that develops after a downtrend. The first candle is strongly bearish. The second candle opens lower but closes above the midpoint of the previous bearish candle.
This recovery shows that the buyers have entered the market aggressively after initial weakness. Although the second candle does not completely engulf the first candle, the strong rebound suggests that bearish momentum is fading.
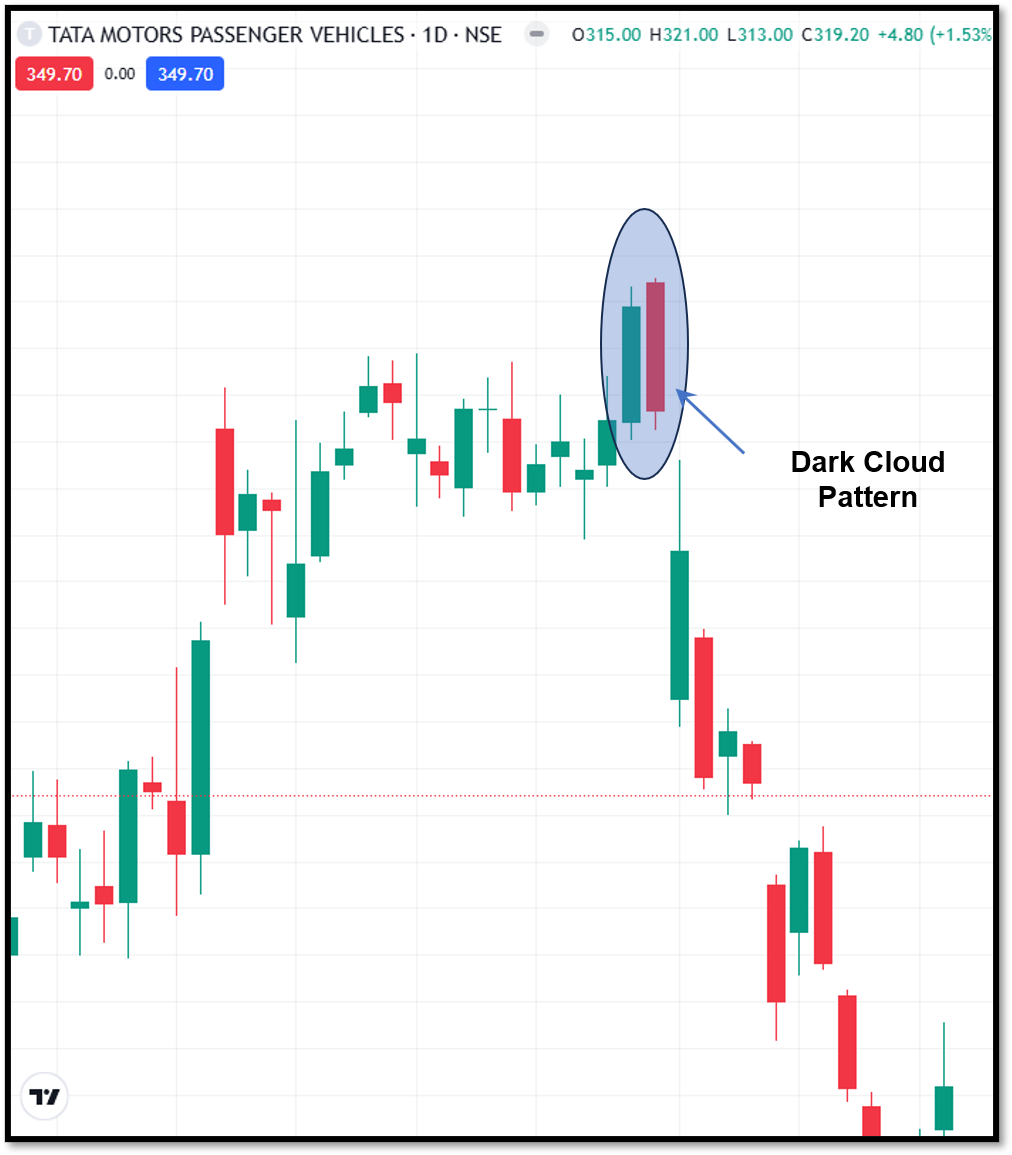
Dark cloud cover pattern
The Dark Cloud Cover is a bearish reversal pattern and the counterpart of the Piercing Pattern. The first candle is a strong bullish candle.
The second candle opens above the previous high but closes below the midpoint of the first candle's body.
This sudden shift indicates that sellers have interrupted the bullish advance and may be beginning to take control.
The deeper the second candle closes into the first candle's body, the stronger the bearish signal tends to be.
Tweezer top pattern
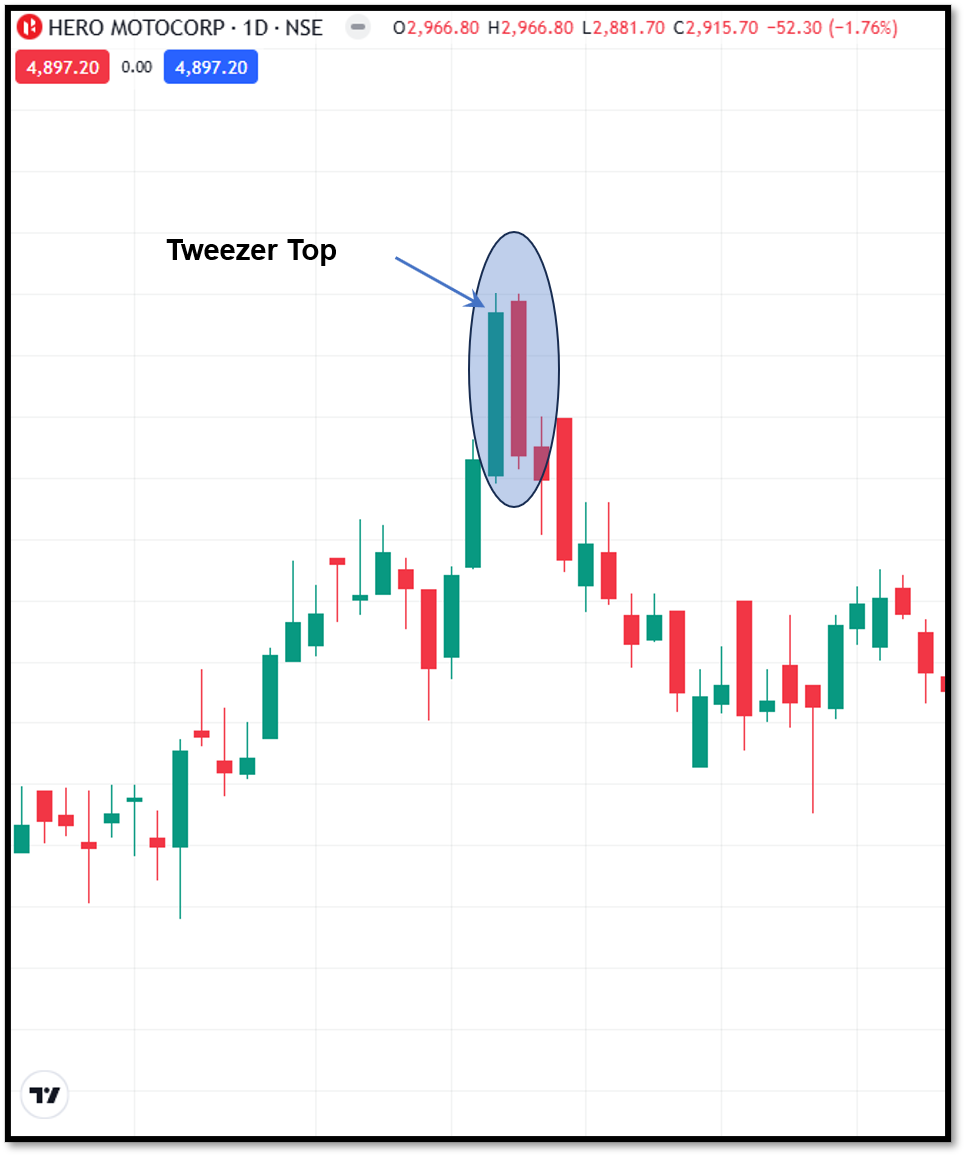
The Tweezer Top is a bearish reversal pattern that usually appears after an uptrend.
The two candles form nearly identical highs. This repeated rejection suggests that buyers are struggling to push prices above a specific resistance level.
As selling pressure increases, traders begin viewing the pattern as a potential warning sign that the uptrend may be weakening.
Tweezer bottom pattern
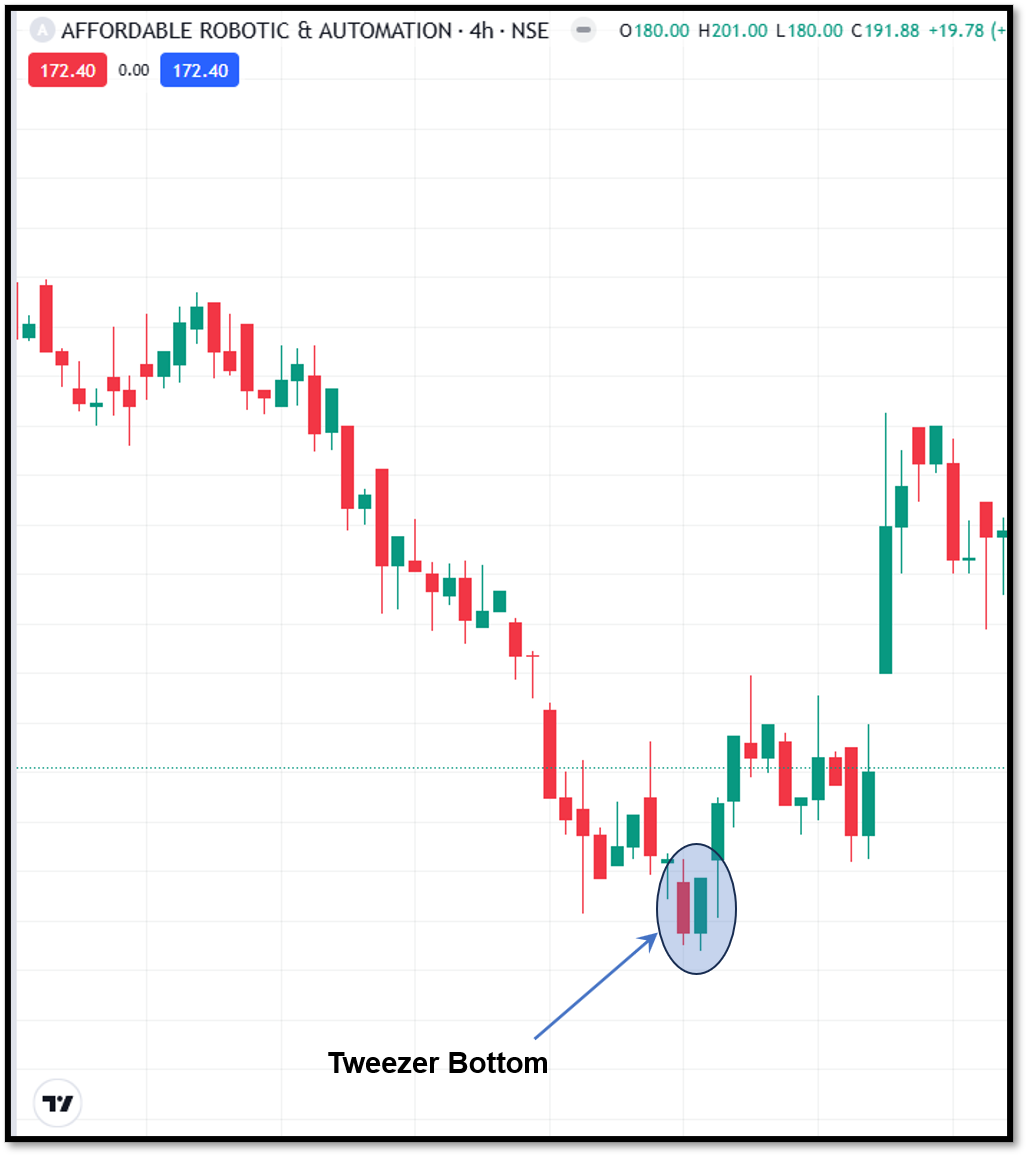
The Tweezer Bottom is a bullish reversal formation that typically develops after a downtrend.
The pattern consists of two candles with nearly identical lows.
The repeated defence of a support level indicates that sellers may be losing momentum.
When buyers begin pushing prices higher afterwards, the pattern can signal the possibility of a bullish reversal.
Bullish harami pattern
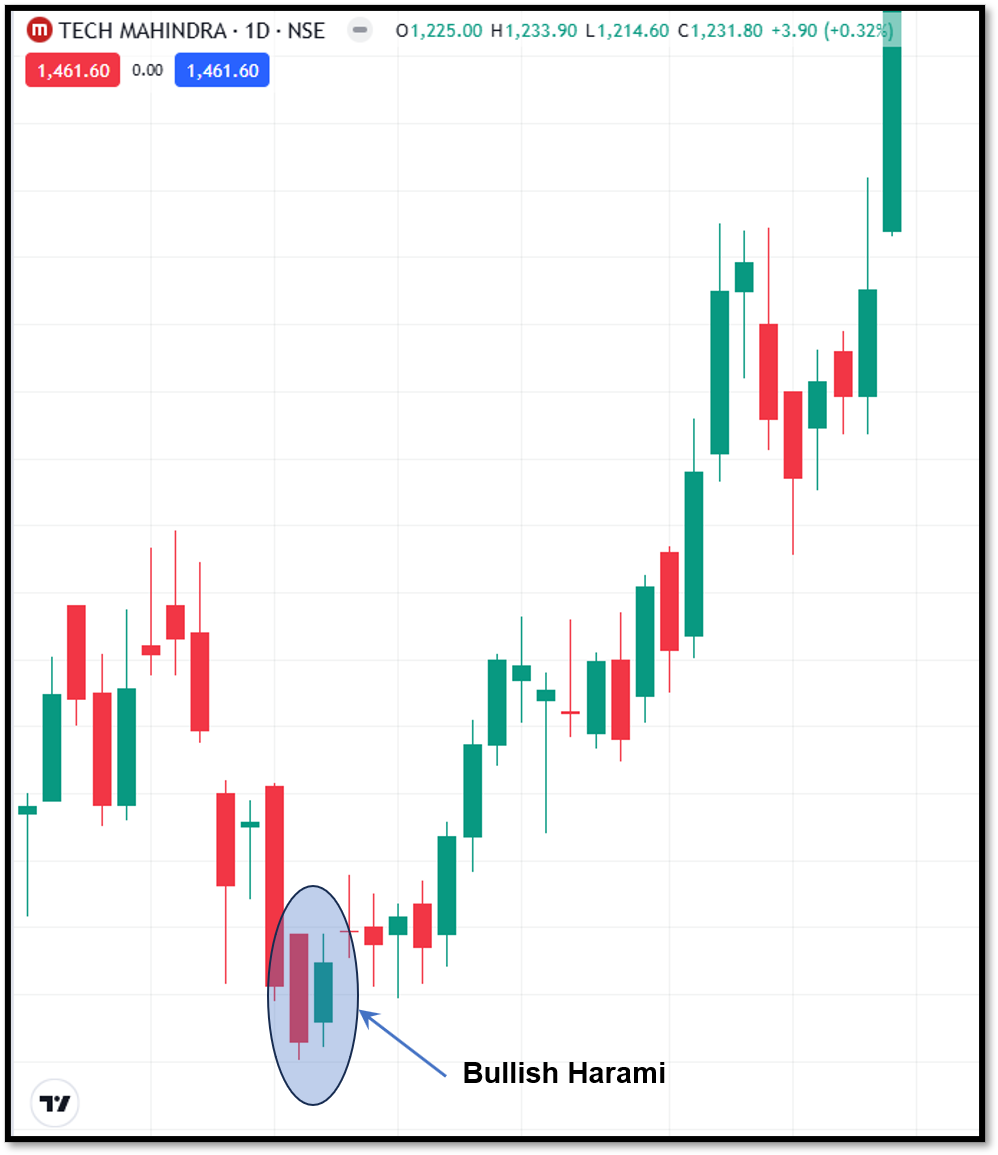
The Bullish Harami is a bullish reversal pattern that typically appears after a downtrend.
The first candle is a large bearish candle, while the second candle is a smaller bullish candle that forms completely within the body of the first candle.
The pattern suggests that selling momentum is beginning to weaken. Although buyers have not fully taken control, the reduced bearish pressure can indicate that a potential reversal is developing.
Many traders look for a strong bullish candle after the pattern forms to confirm the shift in sentiment.
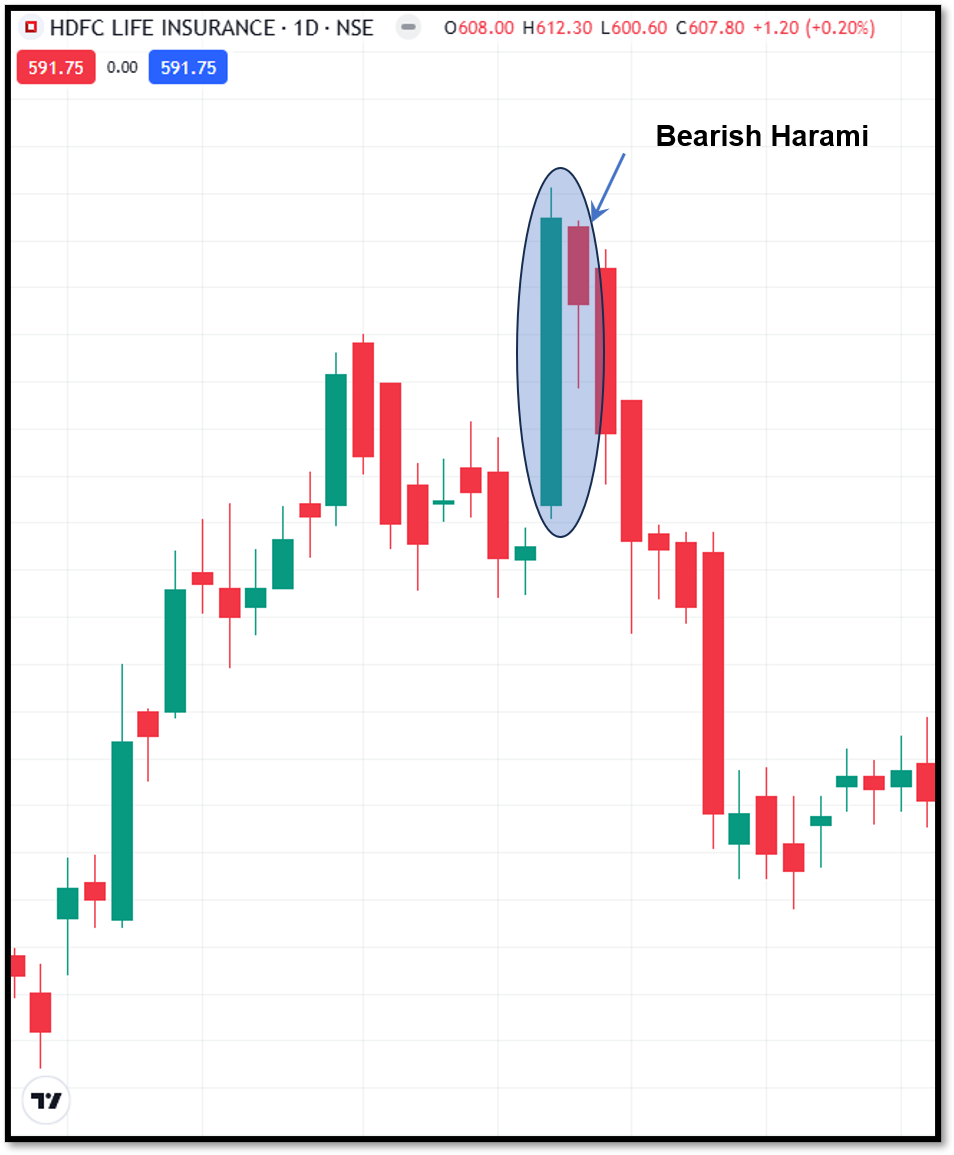
Bearish harami pattern
The Bearish Harami is the bearish counterpart of the Bullish Harami. It usually develops after an uptrend and consists of a large bullish candle followed by a smaller bearish candle that remains within the body of the first candle.
The pattern reflects a little pause in buying momentum. While sellers have not yet established complete control, the loss of bullish strength may signal an upcoming reversal.
Additional confirmation through lower prices or increased selling activity is often preferred before acting on the signal.
Matching low pattern
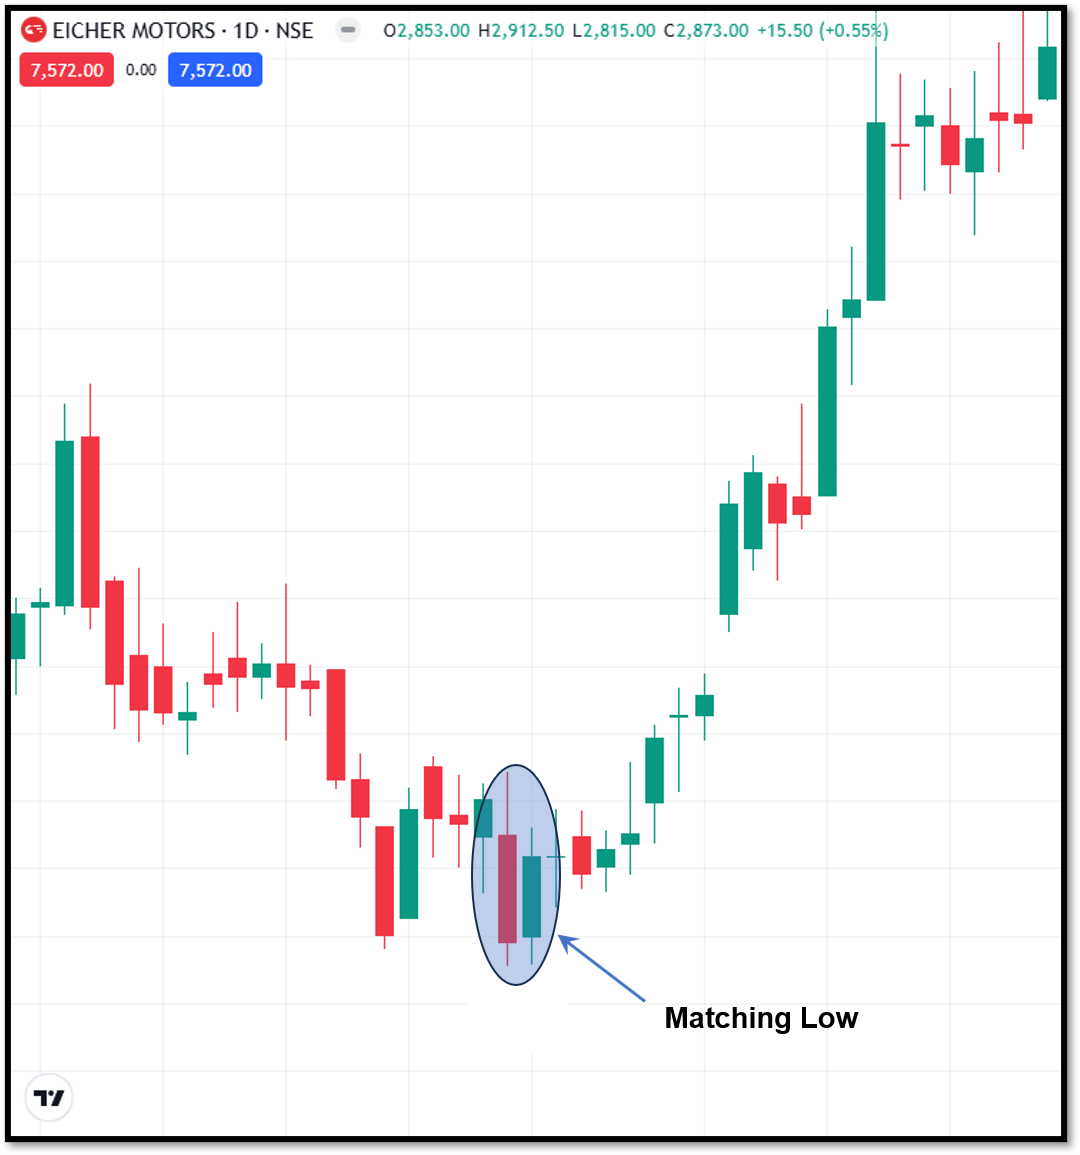
The Matching Low is a bullish reversal pattern that appears during a downward move.
The pattern consists of two bearish candles with nearly identical closing prices. The similar closes suggest that sellers attempted to continue pushing the market lower but encountered support at the same level on consecutive sessions.
This repeated support can indicate that selling pressure is weakening and that buyers may soon begin stepping into the market.
Advantages of Double Candlestick Patterns
The advantages of double candlestick patterns are as follows:
- Double candlestick patterns give more information than single-candle formations as they capture the interaction between buyers and sellers across multiple trading sessions.
- Most double candlestick patterns are relatively easy to recognise on a chart. Hence, they can be used by both beginner and experienced traders.
- These patterns provide early warnings or potential reversal signals. Traders use this information to reassess positions, tighten risk controls, or prepare for possible trend changes.
Limitations of Double Candlestick Patterns
The double candlestick patterns offer more advantages than the single candle, but they have some limitations as well. The limitations of double candlestick patterns are as follows:
- The double candlestick patterns can generate false signals. This can occur, especially during highly volatile or range-bound market conditions.
- The reliability of the pattern mainly depends on the market context. A pattern that works well after a strong trend may be far less effective during a sideways market.
- Traders usually enter the trade just because the pattern appears and ignore the broader context. Support and resistance levels, volume, and trend strength should still be considered.
Summing up
Double candlestick patterns are widely used during technical analysis as they provide insight into changing market sentiment using a relatively simple structure. Traders can identify potential reversals, continuation opportunities, and changes in market sentiment by observing only two candles.
Understanding these formations can improve chart-reading skills and provide a deeper understanding of how price action reflects underlying market psychology.
FAQs
What are double candlestick patterns?
Double candlestick patterns are chart formations consisting of two consecutive candles that assist traders in identifying possible reversal or continuation signals.
Are double candlestick patterns trustworthy?
Double candlestick patterns are reliable when they are used in combination with broader market context and other indicators like volume and support - resistance levels.
Do double candlestick patterns work in intraday trading?
Yes. These patterns can appear on intraday charts as well as daily, weekly, and monthly timeframes.
What indicators can be combined with double candlestick patterns?
Traders usually use the RSI, MACD, moving averages, Bollinger Bands, and volume to confirm double candlestick pattern signals.
How can traders avoid false signals when using double candlestick patterns?
Traders can reduce false signals by analysing the broader trend, monitoring volume, identifying support and resistance levels, and waiting for confirmation before making trading decisions.







