



Bullish Harami Cross Pattern




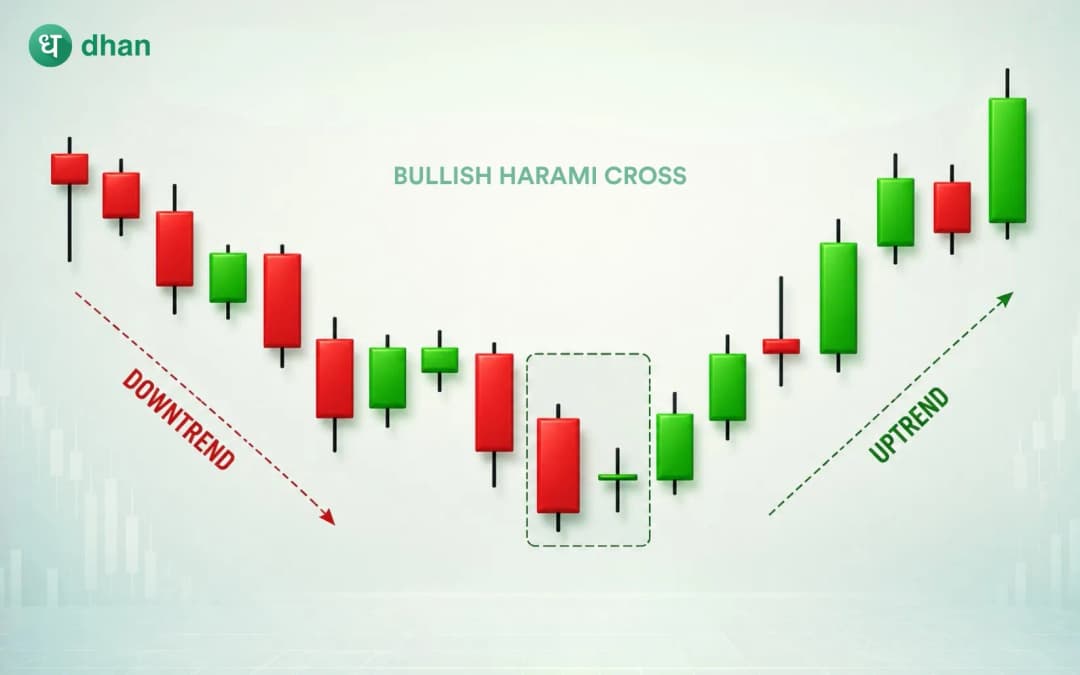




Key takeaways
- The bullish harami cross is a two-candlestick bullish reversal pattern that is usually observed after a downtrend.
- It is a long bearish candle followed by a Doji formed inside the body of the first candle. The pattern indicates that the selling pressure may be decreasing but does not signal a trend reversal on its own.
- Always wait for a bullish confirmation candle to enter a trade.
- The reliability of the pattern can be improved by trading volume, support levels, and general market conditions.
- To manage risk effectively, use a stop loss below the pattern’s low and define a clear profit target.
The financial markets move in trends, sometimes up and down, so it's important for traders to see signs that a reversal may be coming. Being able to recognise a change in market direction at the right time can help traders make better-informed decisions, manage risk more effectively, and identify trading opportunities.
Candlestick patterns are often used to gain insight into changes in market sentiment, but like any indicator, they cannot predict price movements.
One of these patterns is the bullish harami cross, a popular bullish reversal candlestick pattern that usually forms after a downtrend. This could indicate a reduction in selling pressure and a potential for buyers to take over.
With any technical pattern, it should be combined with other indicators and market conditions before making a trading decision.
This article will cover the bullish harami cross pattern, how to identify and trade it, how to confirm the signal with technical indicators, its advantages and disadvantages, and practical tips to use it more effectively in different market conditions.
What is a Bullish Harami Cross?
The bullish harami Cross is a two-candle bullish reversal pattern that indicates a possible reversal from a downtrend to an uptrend. It usually comes after a long price decline and signals that bearish momentum may be running out of strength.
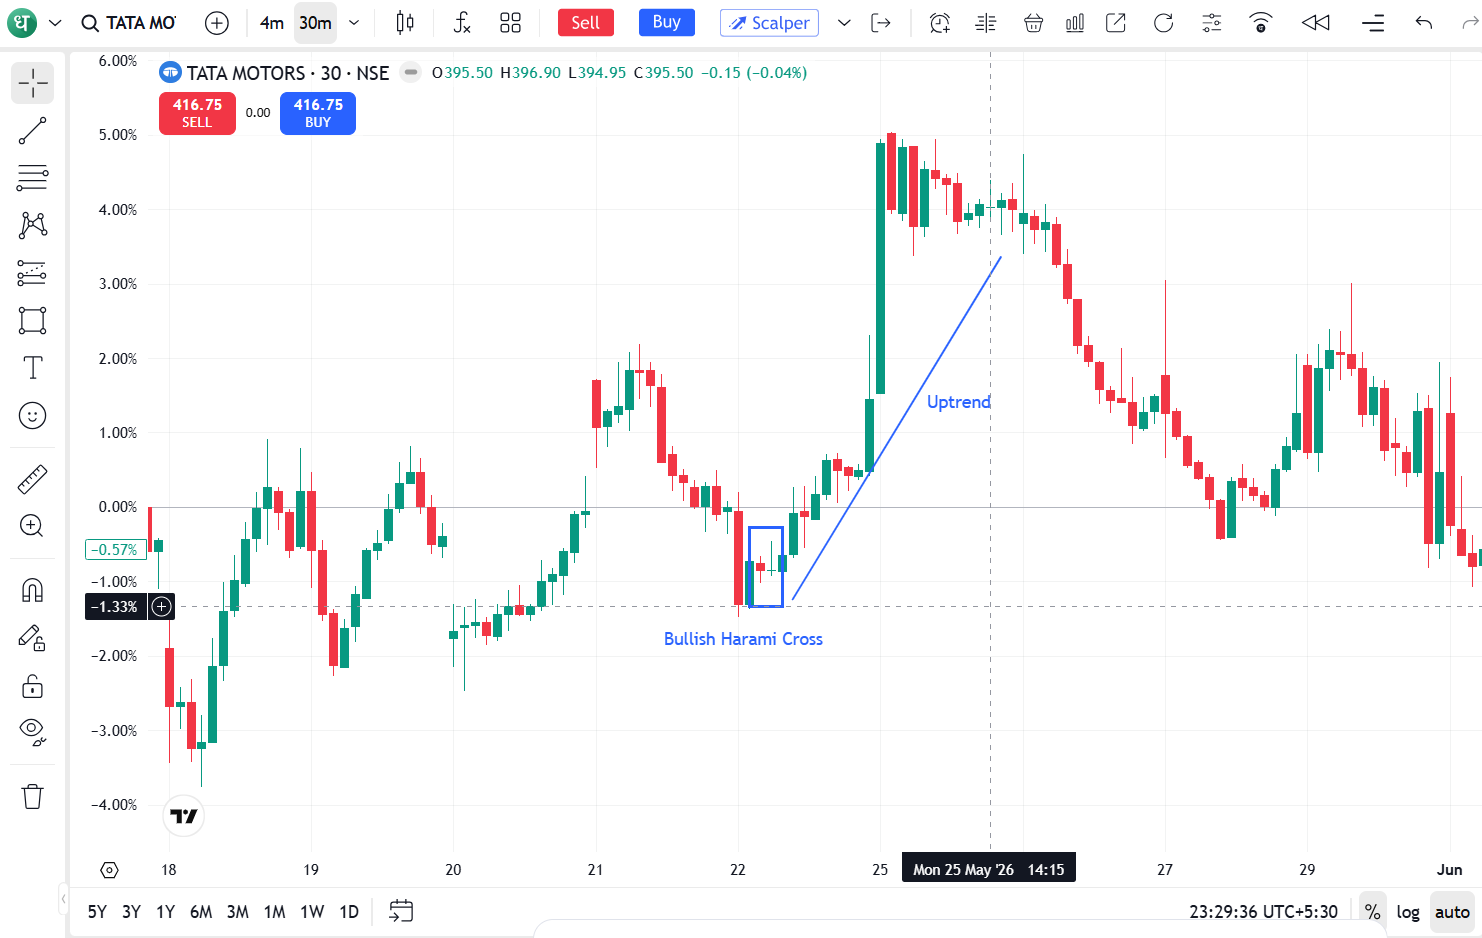
The pattern itself does not guarantee a reversal, but it can be a sign that the buyers are starting to push back against the sellers, particularly if other technical indicators confirm the pattern.
This formation shows that although sellers dominated the previous trading session, they were unable to maintain the same level of control in the next session.
Components of the Bullish Harami Cross Pattern
Traders can easily identify the bullish harami cross pattern when they understand the individual components of the pattern. Each piece plays an important role in indicating a possible shift in market sentiment from bearish to bullish.
Why does the Bullish Harami Cross form?
The bullish harami cross is formed when the bears are losing steam, and the buyers are gradually coming in. This pattern is not an immediate reversal of the trend, but a change of market sentiment from strong selling pressure to rising uncertainty.
Understanding the psychology behind this formation can help traders to better understand the pattern and not just depend on the pattern.
Sellers initially control the market
The pattern starts with a long bearish candle indicating that the sellers are in control. The selling pressure remains high in this session, driving prices lower and strengthening the existing downtrend.
Market sentiment is negative at this point, and many traders expect the fall to continue.
Buyers and sellers reach equilibrium
The second candlestick is a Doji, indicating indecision in the market. The opening and closing prices are so close together that neither side can get a leg up on the other.
This move from a strong bearish momentum to a balanced trading session is a sign that selling pressure is starting to lose steam.
Buyers begin regaining strength
Buyers are beginning to get a bit more active as sellers are being forced to lower prices. The bearish momentum is fading, indicating that the downtrend is approaching its end, and demand is beginning to rise.
Bullish Harami Cross trading strategy
The bullish harami Cross is best traded with proper confirmation and not just on the pattern by itself. A structured trading approach can help traders to reduce false signals and improve risk management.
Here is a step-by-step trading strategy for the bullish harami Cross pattern.
Step 1: Wait for the complete pattern
Start in a clear downtrend, with a bullish harami Cross pattern. This should be a long bearish candle followed by a Doji completely contained within the long body of the bearish candle.
Wait until the second candle closes to get into the trade.
Step 2: Wait for a confirmation candle
A bullish harami Cross does not confirm a reversal, but indicates a possible reversal. Then wait for the next candlestick to close above the Doji or show strong bullish momentum.
If you get a confirmation candle, then it means that the buyers have started to take control of the market and the trading signal is more reliable.
Step 3: Enter above the confirmation candle's high
After a bull candlestick pattern is formed, you might look to enter the trade at the top. This is to ensure that the momentum is held when buying, before trading.
Traders also back-test the signal by applying other technical indicators such as RSI, MACD, trading volume, etc.
Step 4: Place a stop loss
Risk Management is essential as part of any day trading strategy. Place the stop loss at the bottom of the bullish harami Cross pattern (or the Doji, depending upon the trading plan). This will help to cut losses if the market turns against you.
Step 5: Set a profit target
Determine the profit target you want before you get to the trade. You can exit the trade at the previous resistance, or you can take a 1:2 or 1:3 risk-reward ratio. Make your plan long ago to stay disciplined and not go on impulse.
Bullish Harami Cross vs Bullish Harami
Both patterns are potential bullish reversals after a downtrend, but they are different in the second candlestick and the strength of the signal they give.
Both patterns need confirmation before traders consider entering into a position.
Advantages and limitations of the Bullish Harami Cross
Understanding both the strengths and limitations of the bullish harami cross can help traders use the pattern more effectively.
This may be a sign of a potential bullish reversal but works best when used in combination with confirmation signals and a disciplined risk management strategy.
To wrap up
The bullish harami cross is a useful candlestick pattern that can assist traders in spotting potential bullish reversals after a downtrend.
However, this should always be confirmed before entering a trade. This pattern, combined with price action, volume analysis and disciplined risk management, can lead to more informed trading decisions.
FAQs
1. Is the Bullish harami cross a reliable indicator?
It can indicate a possible reversal, but it must be confirmed by price action, volume and technical indicators before taking any trading decision.
2. What is the difference between a bullish harami and a bullish harami cross?
The second candle in the bullish harami is a small-bodied candle, while in the bullish harami cross, a Doji is used, which shows more market indecision.
3. Can the bullish harami cross be used for intraday trading?
Yes, a bullish harami Cross can be used for intraday trading as it appears on different timeframes. Traders should wait for confirmation and have good risk management before entering a trade.
4. Can beginners use the bullish harami cross?
Yes. It is relatively straightforward to identify, but beginners should practise on historical charts and always follow proper risk management before trading with real capital.
5. Which timeframe is best for the bullish harami cross?
The pattern can be formed on any timeframe, but generally the higher timeframes like daily and weekly charts provide more reliable signals.







