



Dark Cloud Cover Pattern








Key takeaways
- The dark cloud cover pattern is a bearish reversal pattern with two candlesticks that usually appears after a strong upward price move.
- It signals that buying momentum may be weakening and sellers are beginning to gain control.
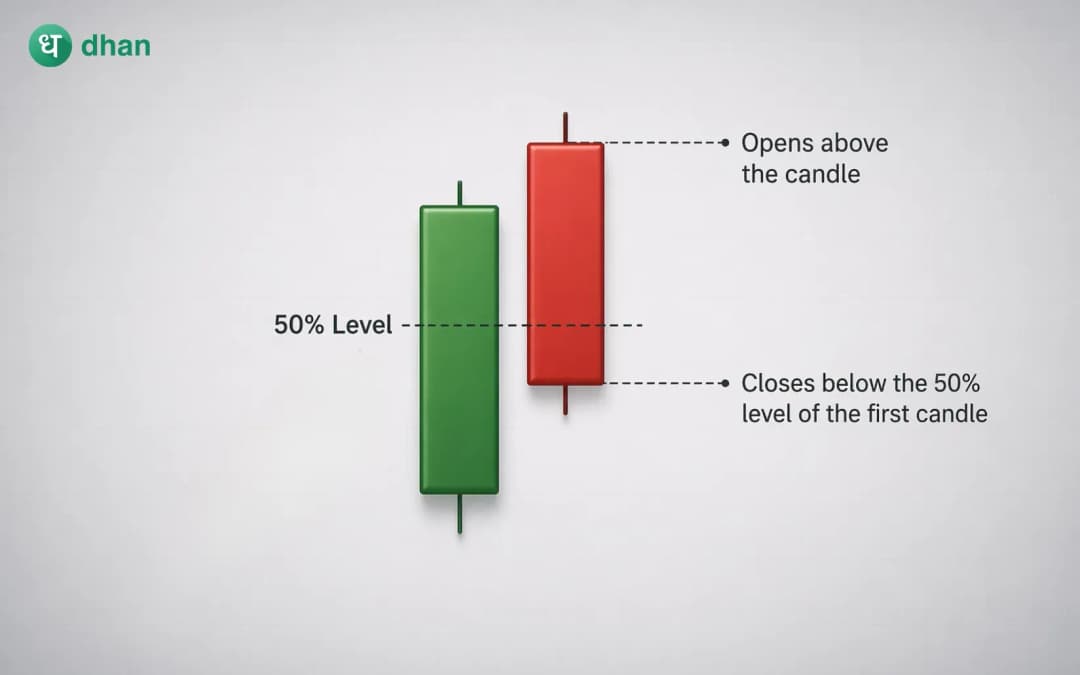
- The pattern forms when a bearish candle opens above the previous candle's high and closes below the midpoint of the prior bullish candle.
- It is considered stronger when it develops near resistance levels or after an extended rally.
The market represents the battle between buyers and sellers through the price action. During this battle, the prices form certain patterns. Traders try to make sense of it through these patterns. Traders have identified many patterns over the years. Some of them are bearish, and others represent the bullish formations.
Dark cloud pattern is one of the bearish reversal patterns that highlights a sudden change in control. The pattern usually appears after an uptrend. A strong bullish candle creates optimism among traders; the following candle opens higher, suggesting that buyers remain confident. However, instead of continuing upward, sellers step in aggressively and push prices lower, casting a "dark cloud" over the previous bullish advance.
Traders interpret this as an early warning that the existing uptrend may be losing strength. Although the pattern does not guarantee a reversal, it can provide valuable insight into changing market conditions. This article explores the dark cloud cover pattern, how it forms, the psychology behind it and why it matters. By understanding these factors, you can improve your trading decision-making.
What is a Dark Cloud Cover Pattern?
A dark cloud cover is a two-candle bearish reversal pattern. The pattern usually forms after a noticeable upward price move and suggests that bullish momentum may be fading.
It has two primary components:
- A strong bullish candle that continues the existing uptrend.
- A bearish candle which opens above the previous candle's high but closes below the midpoint of the bullish candle.
This second candle is the defining feature. The strong bearish close indicates that sellers were able to overcome buying pressure during the session and regain control.
The deeper the bearish candle closes into the body of the previous candle, the stronger the bearish implication tends to be.
Why the pattern matters
One reason traders pay attention to the dark cloud cover pattern is that it reveals a meaningful shift in sentiment. At the beginning of the second candle, buyers appear confident. The gap higher suggests that market participants expect the uptrend to continue.
But as trading progresses, selling pressure emerges and completely changes the direction of the session.
Instead of extending the rally, the market closes significantly lower. This transition from optimism to caution can indicate that buyers are becoming exhausted and sellers are becoming more aggressive.
While one pattern alone does not define the future direction of the market, it serves as an early sign that momentum is changing.
Understanding the psychology behind the pattern
Candlestick patterns become more useful when traders understand the behaviour they represent. The first candle reflects strong bullish sentiment. Buyers are firmly in control, and confidence remains high.
The second candle begins with another positive development. Price opens above the previous high, creating the impression that the rally will continue. But something changes during the trading session.
Selling pressure increases and gradually overwhelms buyers. By the close, the market has fallen deep into the body of the previous bullish candle. This reversal in intraday sentiment demonstrates that sellers have challenged bullish dominance.
The greater the bearish penetration into the previous candle's body, the stronger the shift in market sentiment.
Characteristics of the Dark Cloud Cover Pattern
Not all dark cloud cover formations carry the same significance. Several factors can increase the reliability of the pattern.
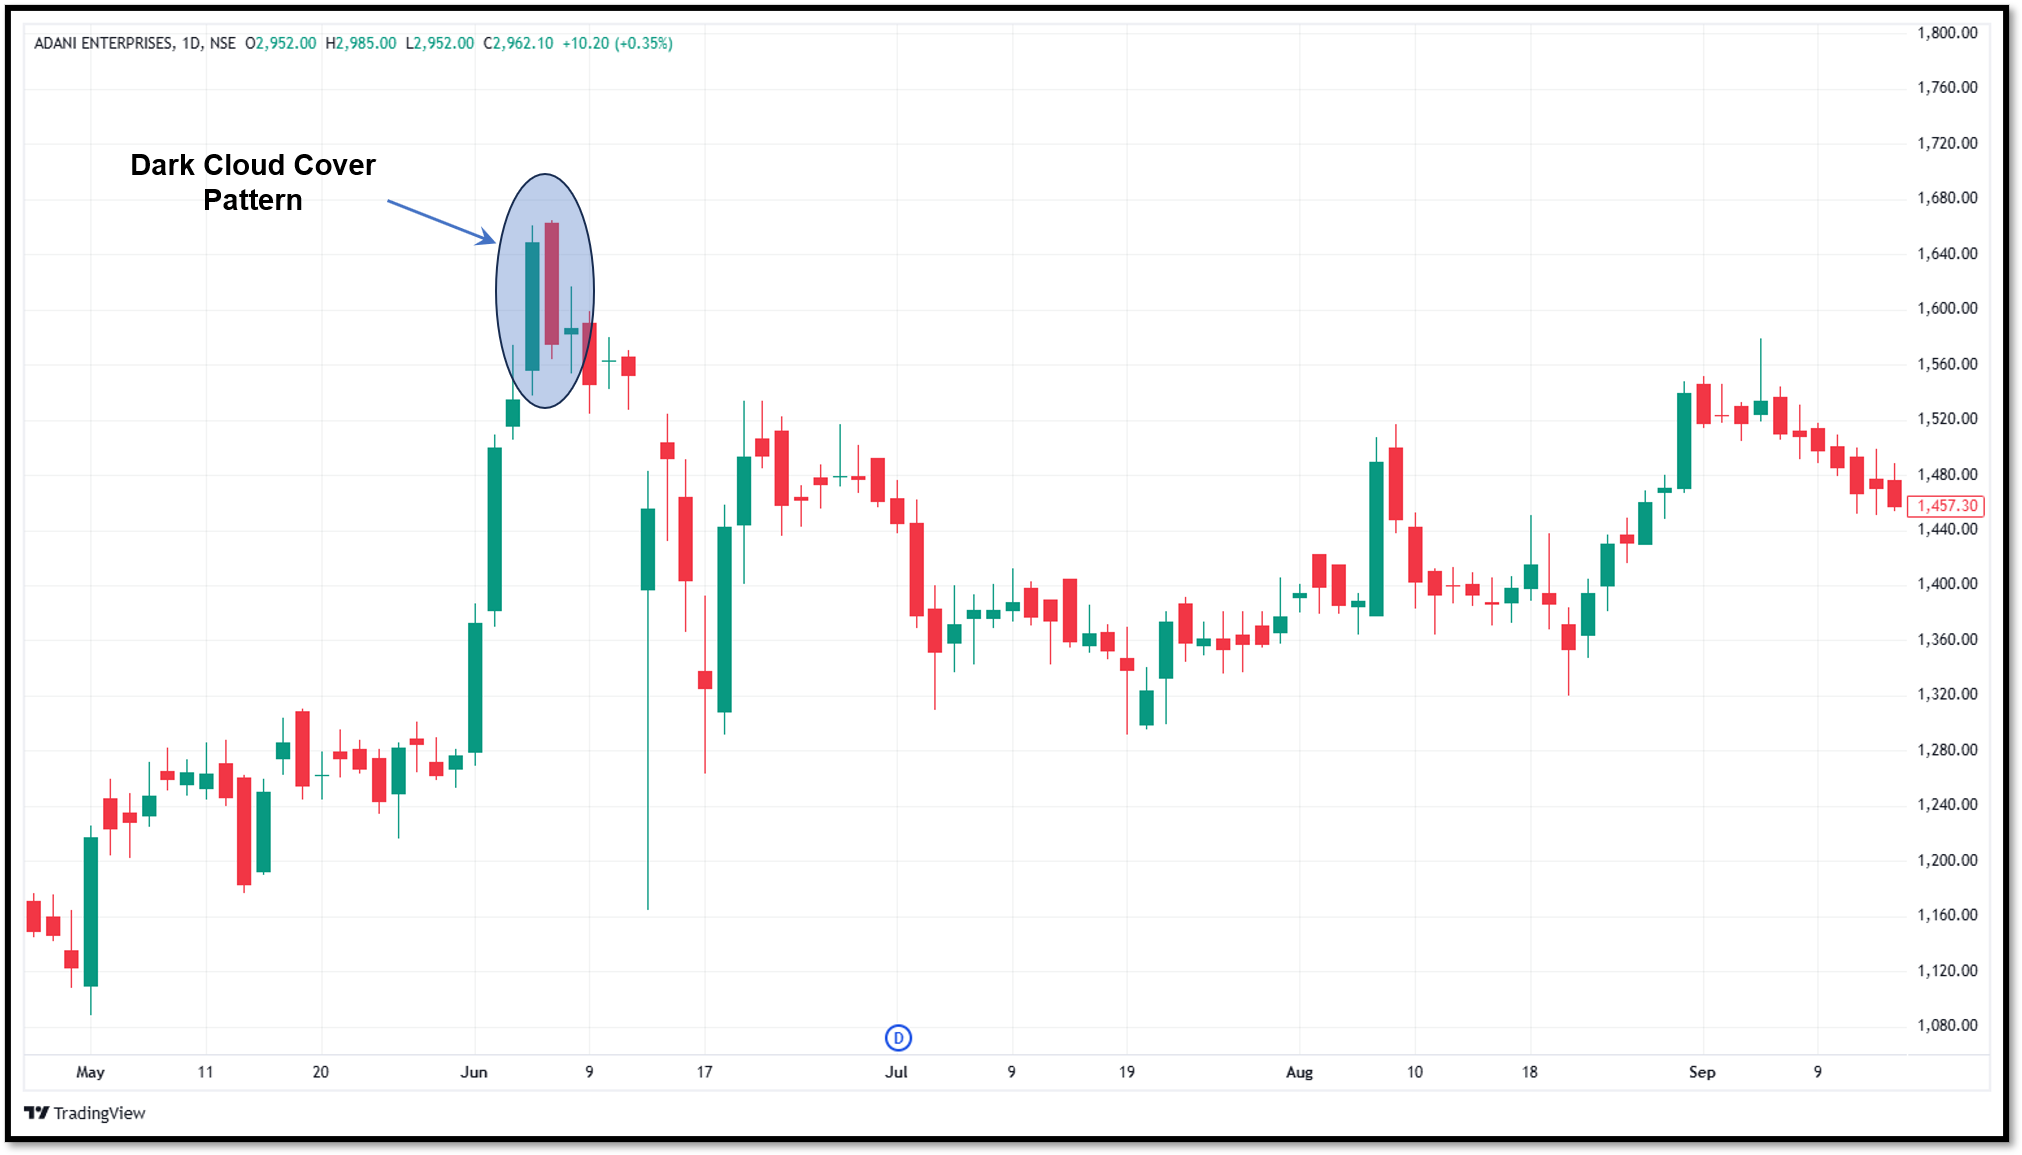
Prior Uptrend
The pattern is most meaningful when it develops after a sustained upward move. Without a prior uptrend, there is little bullish momentum for the pattern to reverse.
A strong bearish second candle
A deeper close below the midpoint of the previous bullish candle indicates stronger seller conviction. The more aggressively sellers push prices lower, the more meaningful the pattern becomes.
High trading volume
Increased volume during the bearish candle can indicate broader market participation. This suggests that sellers are entering the market with greater conviction.
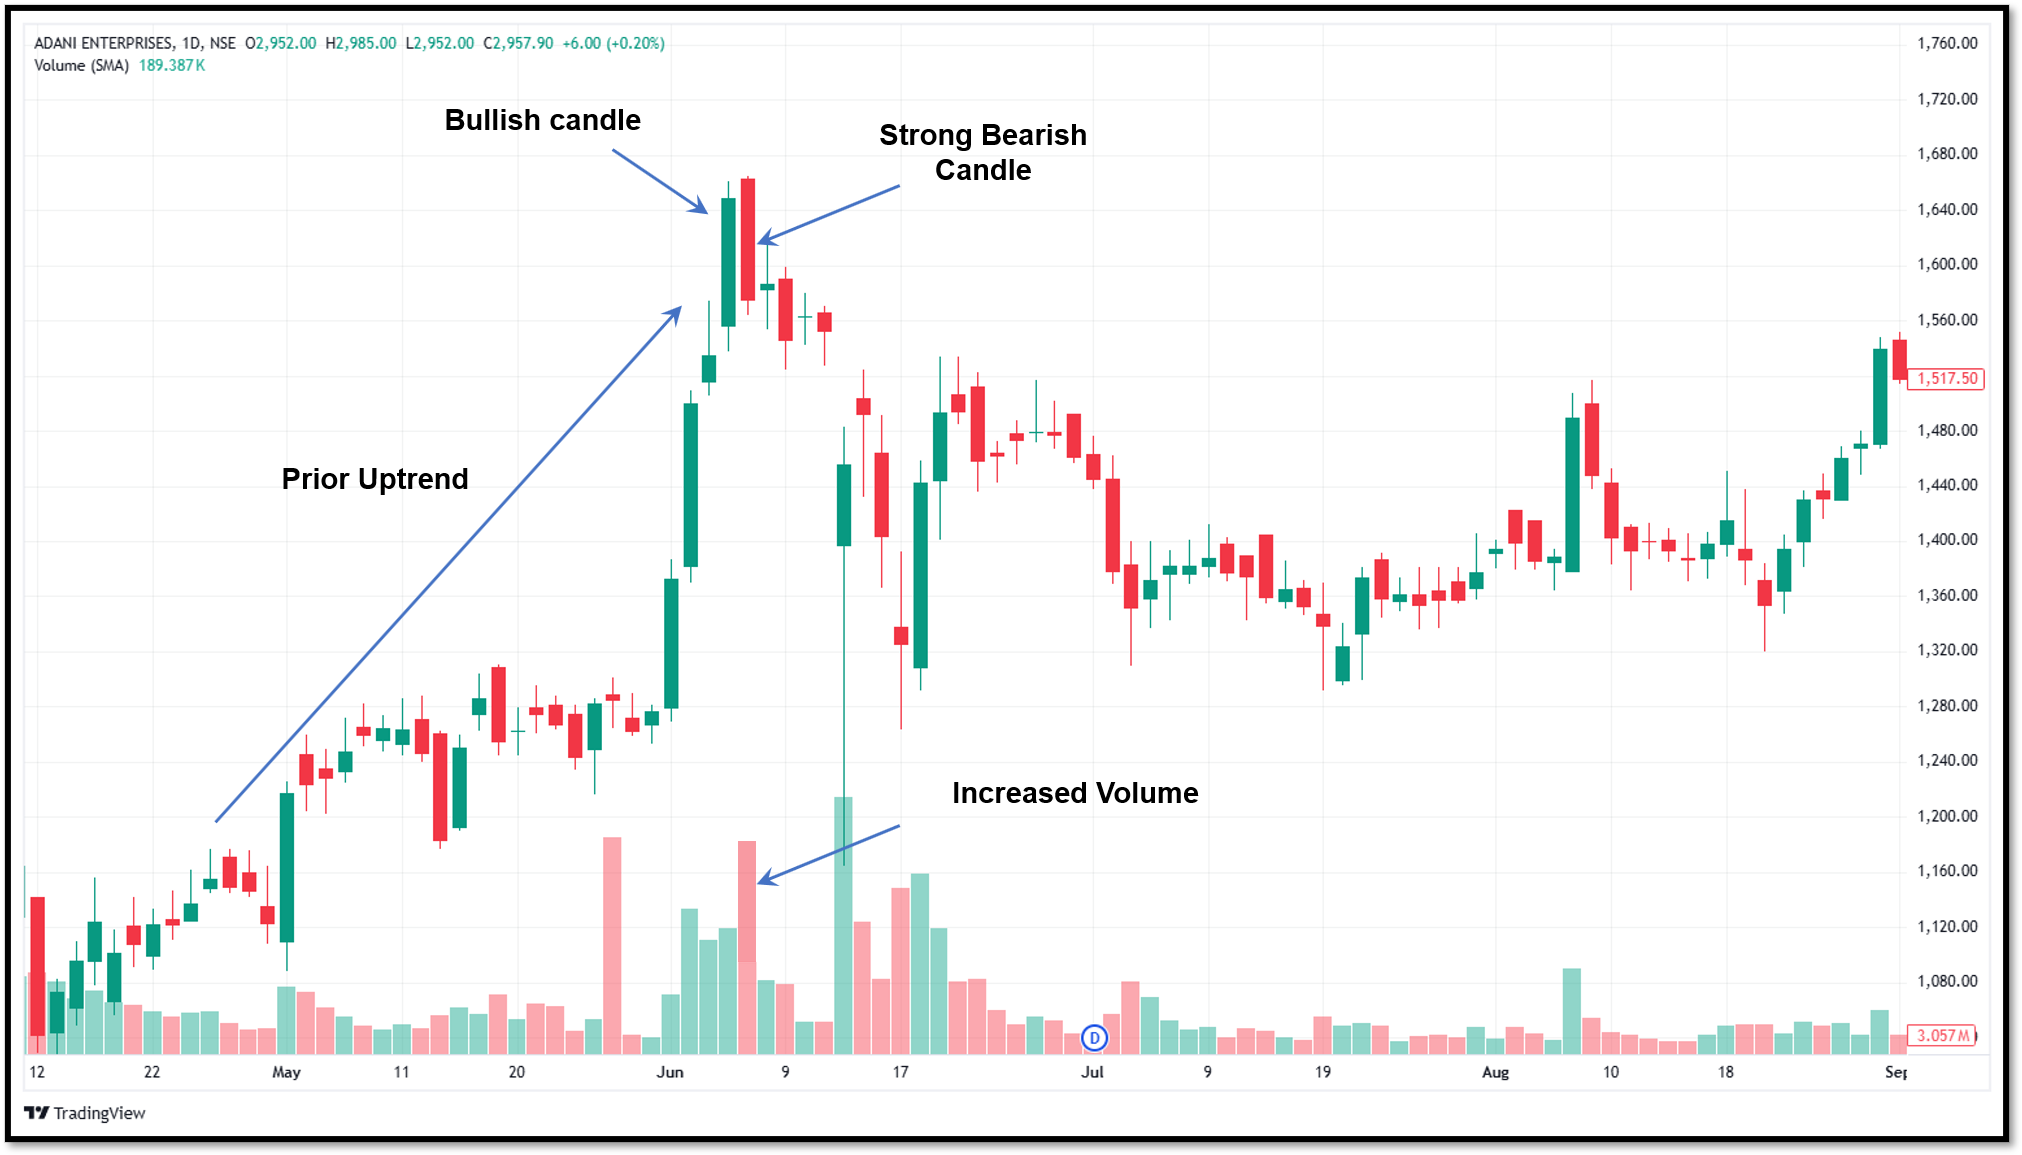
Resistance levels
If the pattern forms near a key resistance zone, then it carries more weight and is more reliable.
How to identify a Dark Cloud Cover Pattern
Recognising the pattern requires attention to both structure and context. You can identify the dark cloud cover pattern with the following steps:
- Identify a market that has been trending higher.
- Locate a strong bullish candle that continues the upward move.
- Look for a bearish candle that opens above the previous high or near the upper portion of the prior candle and closes below the midpoint of the first candle's body.
- Examine the surrounding market environment. Patterns appearing near resistance levels or after extended rallies generally deserve more attention than those forming in random market conditions.
Trading the Dark Cloud Cover Pattern
Traders use several approaches when incorporating this pattern into their analysis.
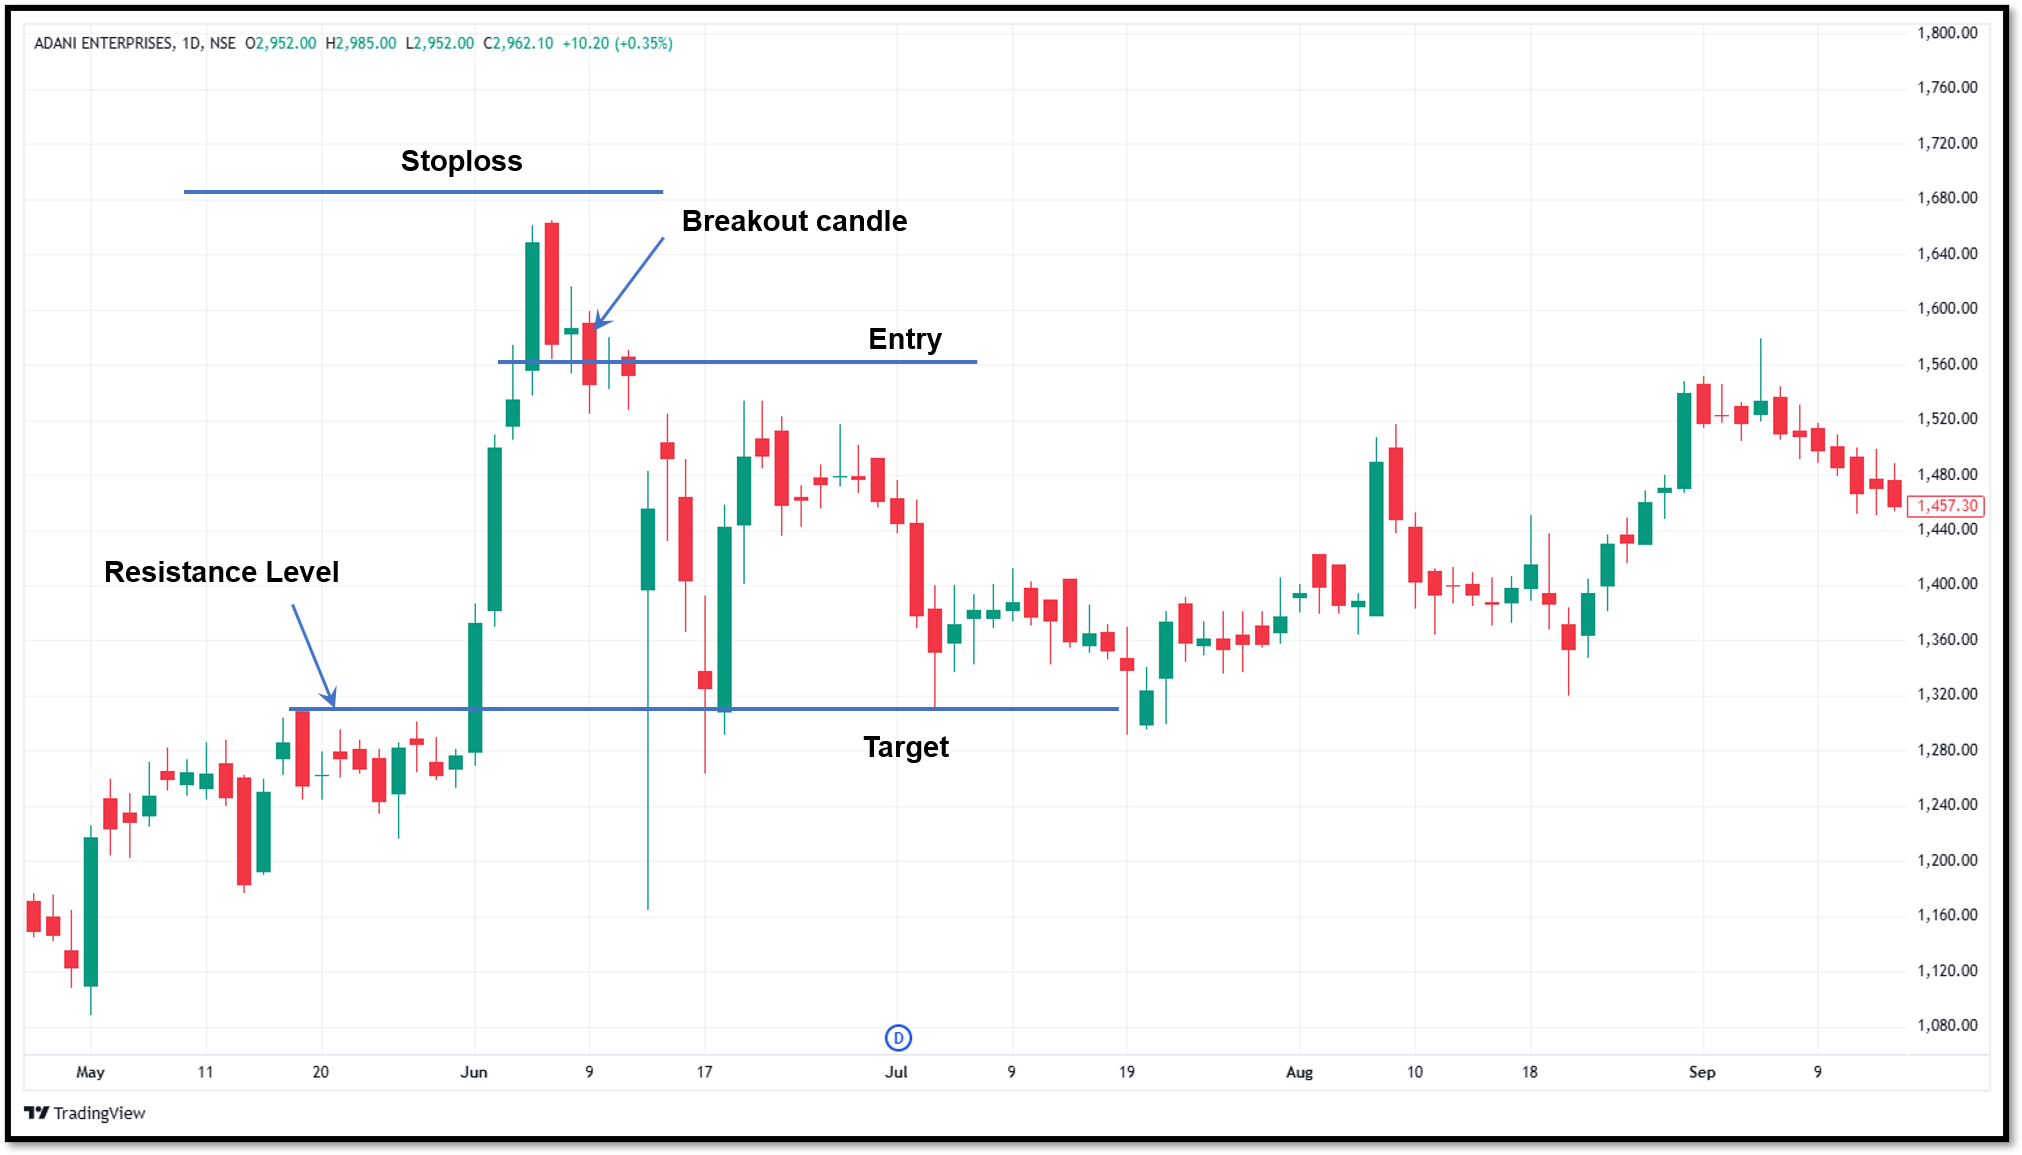
Waiting for confirmation
Traders usually avoid entering immediately after the pattern forms. They wait for confirmation through additional bearish price action. Like,
- A lower close on the following candle
- A break below recent support
- Increasing selling volume
- Bearish momentum indicator signals
Such confirmations can help reduce the risk of acting on a false signal.
Entry considerations
Traders enter the short positions after confirmation occurs. Some traders use the pattern as a signal to reduce long exposure or tighten stop-loss levels.
Stop-loss placement
A common risk management technique involves placing a stop-loss above the high of the pattern. If the market moves above this level, the bearish setup may no longer be valid.
Profit targets
The target price can be set based on:
- Previous support zones
- Swing lows
- Risk-reward ratios
- Trendline support areas
Advantages of the Dark Cloud Cover Pattern
The advantages of the dark cloud cover pattern are as follows:
- The pattern acts as an early warning that bullish momentum may be weakening. The dark cloud cover can highlight a potential shift in sentiment within just two trading sessions.
- The strong bearish close represents that the sellers have successfully challenged buyer dominance. It makes the pattern valuable for spotting possible trend exhaustion.
- The pattern becomes particularly effective near resistance zones. When a dark cloud cover appears after a strong rally into a major resistance level, it shows that the sellers are more interested in that level.
- Traders can define risk relatively clearly. The high of the pattern often serves as a logical invalidation level, helping traders structure entries and stop-loss placements more effectively.
Disadvantages of the Dark Cloud Cover Pattern
Along with the advantages, the dark cloud pattern has some limitations as follows:
- The pattern represents a warning signal rather than confirmation of a reversal. Markets can resume their uptrend shortly after the formation appears.
- In very volatile markets the pattern can form often without any significant downside move. This can lead traders to overestimate the importance of single formations.
- The pattern can not be traded alone. It requires confirmation from other indicators.
- Traders who act without confirmation may enter positions too early. Waiting for additional bearish evidence can improve reliability but may also result in later trade entries.
To wrap up
The dark cloud cover pattern is a bearish reversal formation. It helps traders identify potential shifts in market sentiment. Its structure consists of a strong bullish candle after an uptrend, followed by a bearish candle that opens above the previous candle's high and closes below the midpoint of that candle. The formation shows that the bullish momentum is weakening.
A failed attempt to extend an uptrend reveals changing market dynamics that traders may otherwise overlook. But the pattern should not be used alone. Traders must view the pattern in context with the broader market.
FAQs
What is the difference between a dark cloud cover and a bearish engulfing pattern?
A bearish engulfing pattern completely engulfs the previous bullish candle's body. A dark cloud cover closes below the midpoint of the previous candle but does not necessarily engulf it entirely.
Can the dark cloud cover pattern be used in intraday trading?
Yes. The pattern can appear on intraday charts as well as daily, weekly, and monthly timeframes. However, lower timeframes may generate more false signals.
Does volume matter when analysing the pattern?
Yes. Higher volume during the bearish candle indicates stronger seller participation and can increase confidence in the signal.
Can a dark cloud cover appear in any market?
Yes. The pattern can occur in stocks, commodities, forex, indices, and cryptocurrencies because it reflects universal market psychology between buyers and sellers.
How many candles form a dark cloud cover pattern?
The pattern consists of two candles. The first is bullish, while the second is bearish and closes below the midpoint of the first candle.







