



Harmonic Chart Patterns








Key takeaways
- Harmonic chart patterns are advanced technical analysis patterns that use Fibonacci ratios to identify potential market reversals.
- Popular harmonic patterns include the Gartley, Butterfly, Bat, Crab, Cypher, and Shark patterns, each following a unique price structure.
- Harmonic patterns identify potential reversal zones. Traders should always seek confirmation through price action, technical indicators, and sound risk management.
The financial markets usually do not move randomly. Each price swing shows the struggle between buyers and sellers. This creates patterns that usually provide predictive outcomes. The chart patterns usually rely on the visual price structure, but harmonic patterns add numbers to it with Fibonacci ratios.
Harmonic trading presumes that the financial market moves in predictable cycles, which creates geometric price patterns. There is a mathematical relationship between each price fluctuation. Traders use Fibonacci retracement ratios to measure the relationship between these swings.
At first glance, the harmonic patterns usually look complex and hard to identify. But once you understand the logic, it becomes easier to recognise. Harmonic patterns do not predict reversals with certainty, but they can help traders identify the high-probability zones.
What are Harmonic Chart Patterns?
Harmonic chart patterns are price formations that combine chart structure with Fibonacci ratios to identify potential reversal points in the market.
To become a harmonic chart pattern, it must satisfy specific mathematical relationships between consecutive price swings. If these Fibonacci ratios are not satisfied, the formation is not considered a valid harmonic pattern.
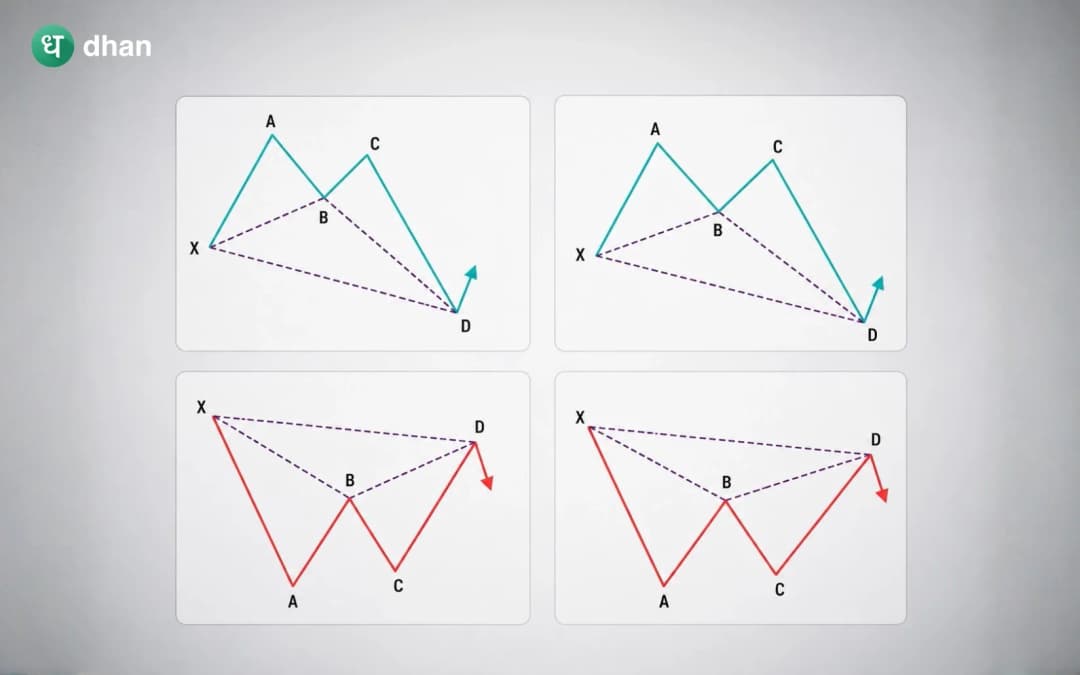
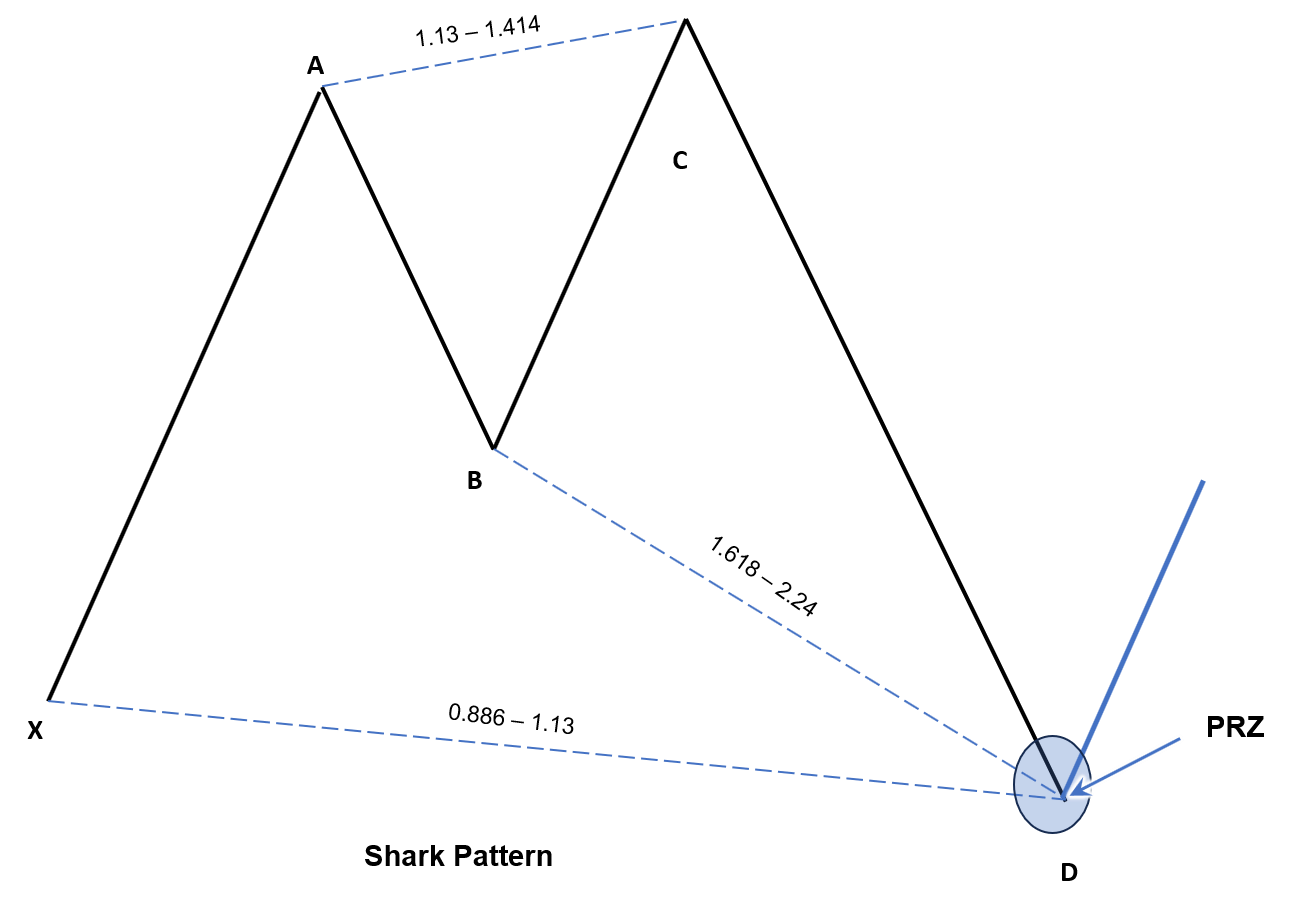
Most harmonic patterns consist of five price points connected by four or more price legs. These points are commonly labelled X, A, B, C, and D, although some patterns, such as the Shark pattern, use OXABC instead.
The final point of the pattern generally represents the Potential Reversal Zone (PRZ), where traders begin looking for confirmation that the prevailing trend may reverse.
Why traders use Harmonic Chart Patterns
It is usually difficult to identify where a trend may lose its momentum, and the price can reverse. Harmonic patterns offer guidelines to estimate potential reversal zones using Fibonacci measurements. Many traders prefer harmonic patterns because of the following reasons:
- They set levels for entry and exit
- Traders can set a logical stop loss
- Trading Rules are based on Fibonacci Ratios
- They offer a systematic way of identifying potential reversals
Types of Harmonic Chart Patterns
Several harmonic patterns are commonly used by traders. Although they all rely on Fibonacci relationships, each pattern has a unique structure and trading application.
Gartley pattern
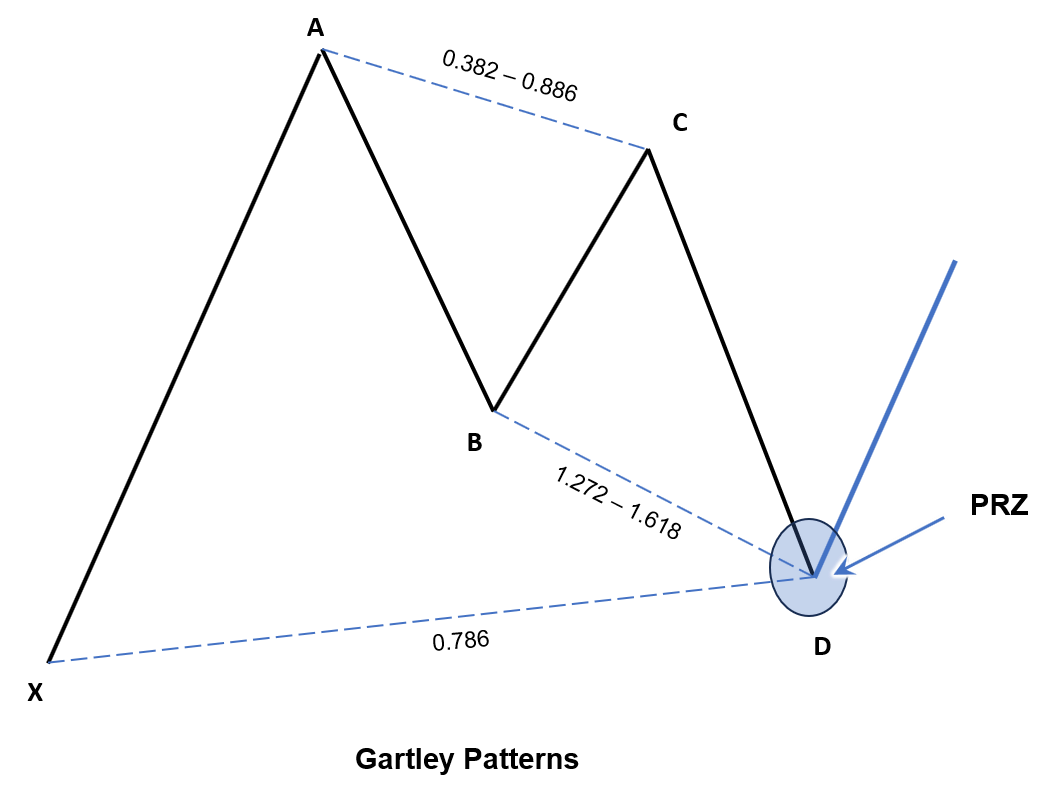
The Gartley pattern is one of the oldest and most recognised harmonic patterns. It consists of five price points and typically signals that an existing trend is likely to resume after a temporary correction.
The pattern completes near the 78.6% retracement of the XA leg, where traders begin looking for reversal confirmation. Both bullish and bearish versions of the Gartley pattern exist.
Butterfly pattern
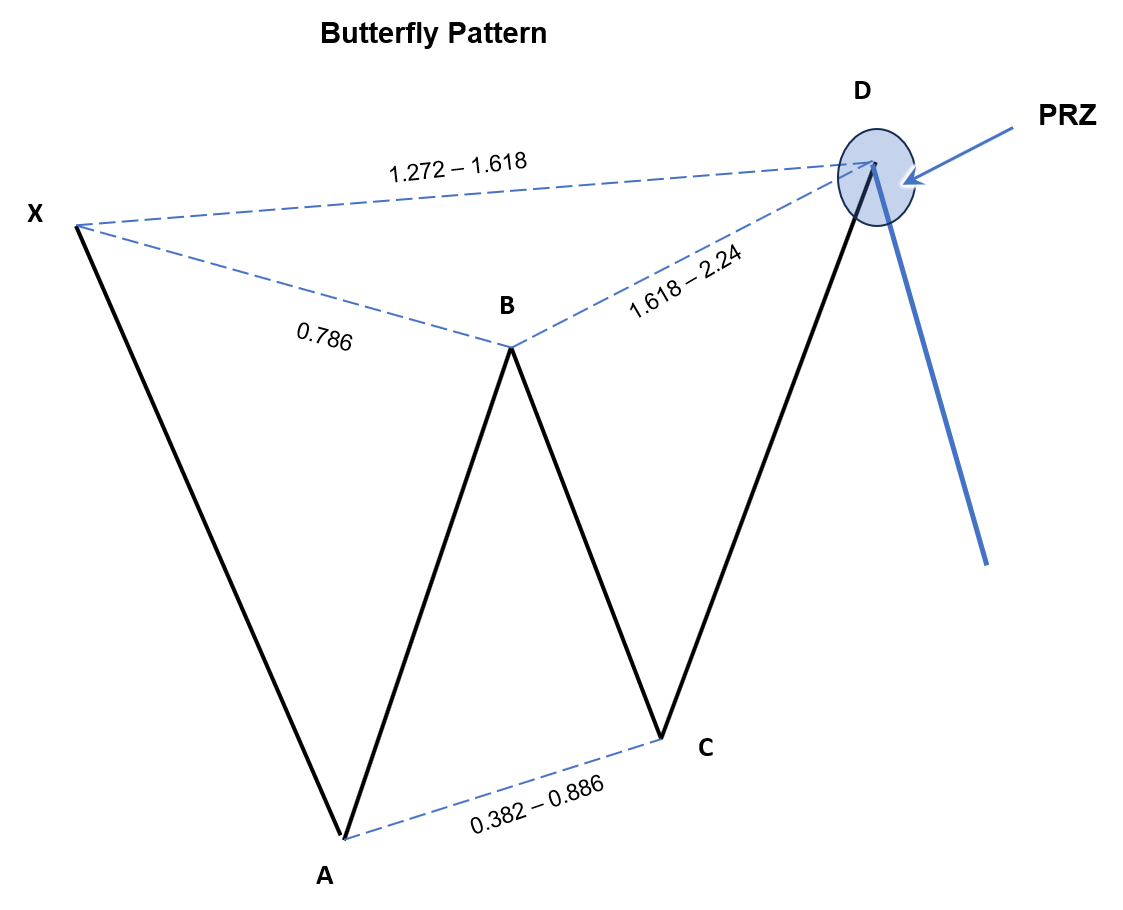
The Butterfly pattern is another reversal pattern that extends beyond the starting point of the initial price move.
Unlike the Gartley pattern, its final point often extends beyond the original XA leg, allowing traders to identify potential reversals after stronger price movements. The Butterfly pattern is commonly used to identify trend exhaustion.
Bat pattern
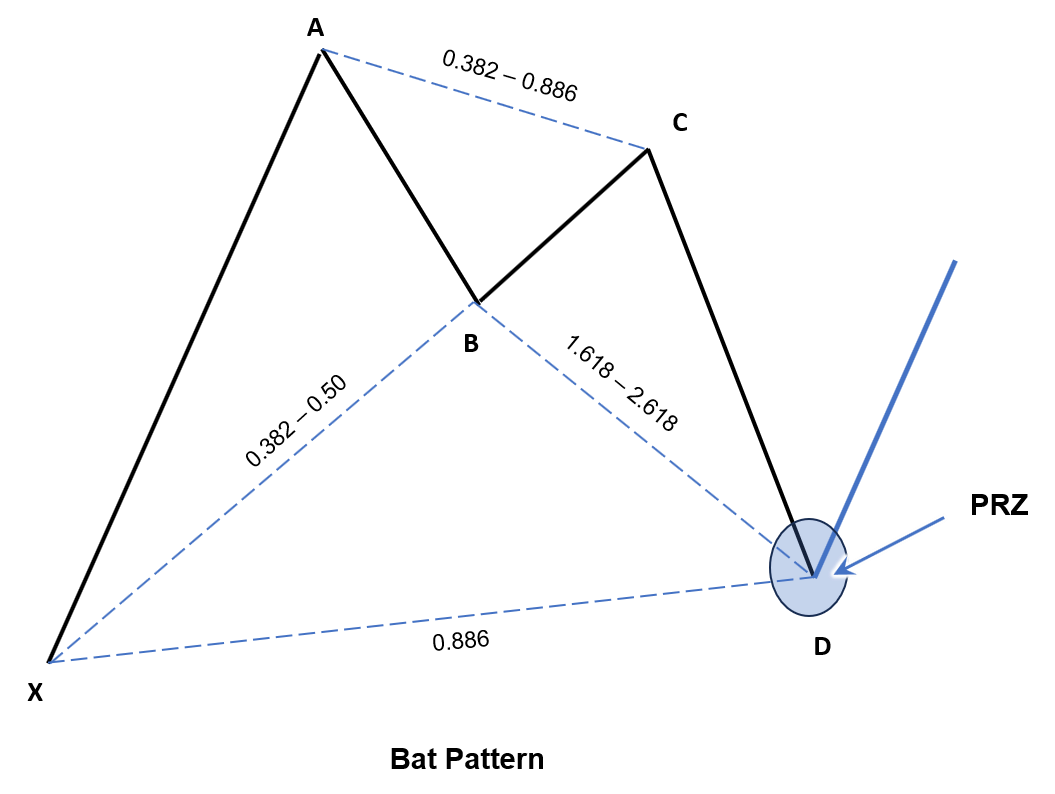
The Bat pattern resembles the Gartley pattern but its Fibonacci measurements are different. It generally completes near the 88.6% retracement of the XA leg, producing a relatively deep correction before the expected reversal.
Many traders appreciate the Bat pattern because it often provides favourable risk-reward opportunities due to its precise completion zone.
Crab pattern
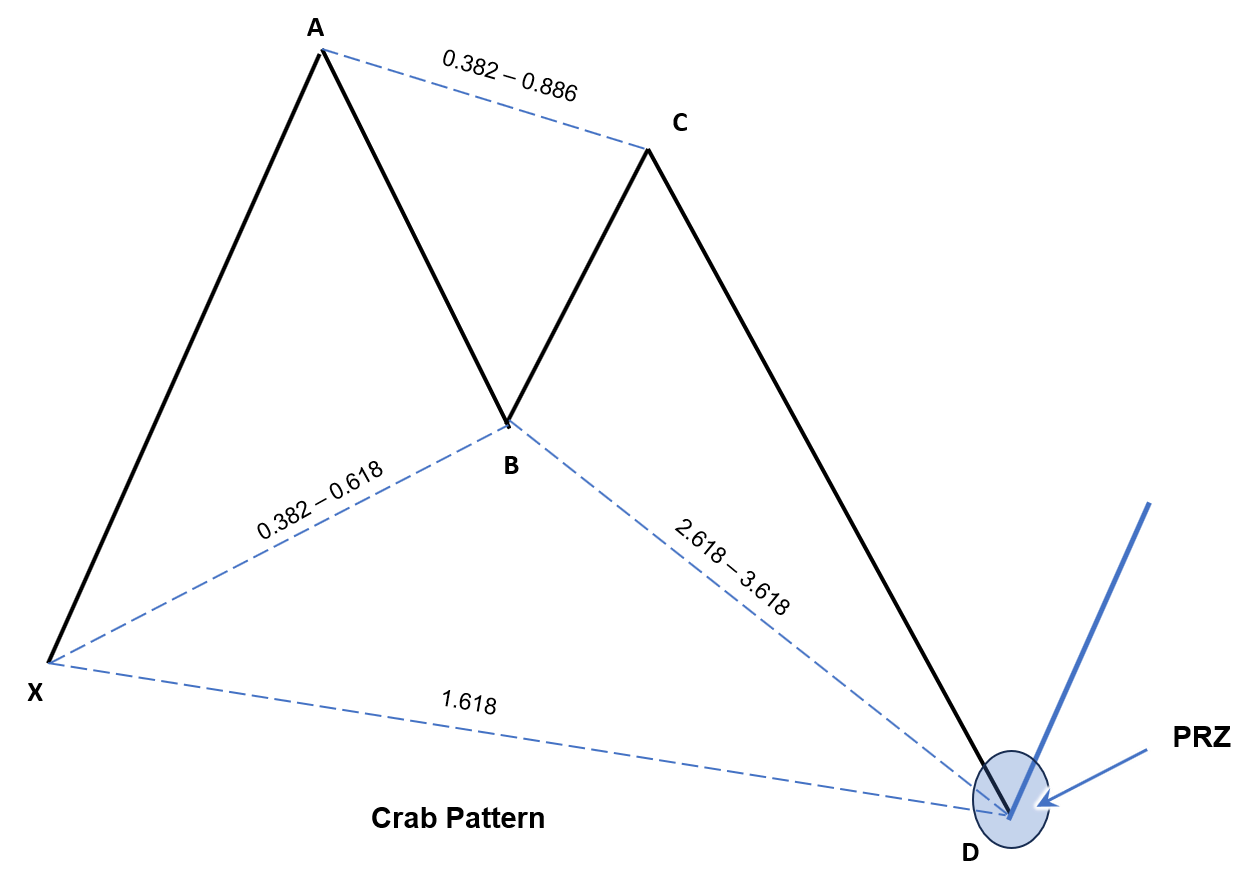
The Crab pattern is known for its deep extension and strong reversal potential. Its defining characteristic is the extended final price leg, which often reaches the 161.8% extension of the XA move.
Although it occurs less frequently than some other harmonic patterns, the Crab can produce significant reversals when confirmed.
Cypher pattern
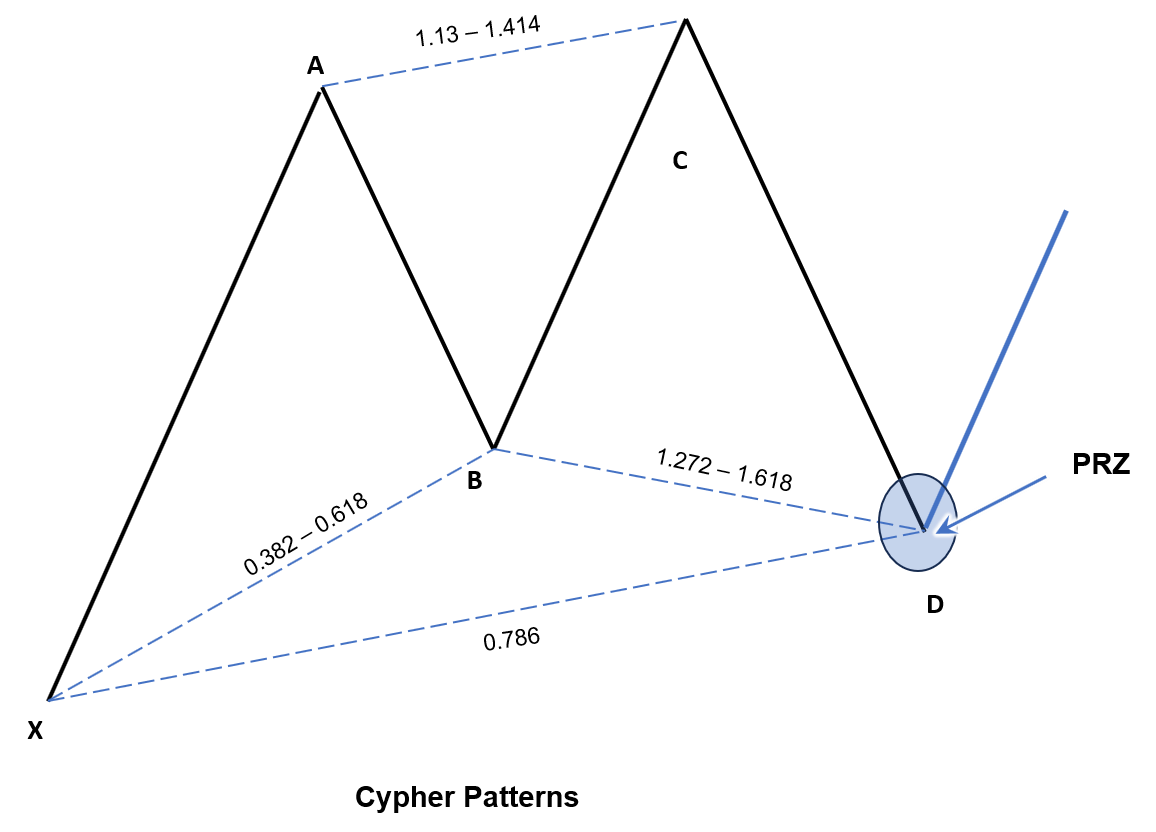
The Cypher pattern combines retracement and extension measurements to identify reversal opportunities after complex price movements. One of its unique characteristics is that the BC leg extends beyond point X before the pattern completes near the 78.6% retracement of the XC leg.
Because of its distinct structure, traders often use the Cypher pattern to identify early trend reversals.
Shark pattern
The Shark pattern differs from traditional harmonic patterns because it follows an OXABC structure instead of the standard XABCD format. It uses a unique combination of Fibonacci retracements and extensions to identify potential reversal zones before the development of a 5-0 pattern.
Its structure makes it particularly useful for traders specialising in advanced harmonic analysis.
How to trade Harmonic Chart Patterns
Identifying a harmonic pattern is only the first step. A successful trade depends on waiting for the pattern to complete, confirming the reversal, and managing risk effectively.
Confirm the pattern
Check to see if the harmonic pattern follows the required Fibonacci ratios before entering a trade. Every price leg should be equal to the exact size of the chosen pattern.
Wait for confirmation
The Potential Reversal Zone (PRZ) indicates where a reversal may occur, but it does not guarantee. Traders generally wait for additional confirmation from other indicators before opening a position.
Enter the trade
After confirmation, traders can consider entering a position in the expected direction. For bullish harmonic patterns, traders generally enter after buyers begin pushing prices higher from the PRZ.
Place a stop-loss
Risk management is essential because even perfectly formed harmonic patterns can fail. For bullish setups, traders usually place the stop-loss slightly below the Potential Reversal Zone. For bearish setups, the stop-loss is commonly placed slightly above the PRZ.
Set a profit target
Profit targets can be determined using several methods. Usually, traders use the following methods to calculate the target price.
- Previous swing highs or swing lows.
- Fibonacci retracement or extension levels.
- Fixed risk-reward ratios such as 1:2 or 1:3.
- Trailing stop-loss strategies to capture larger price movements.
Advantages of Harmonic Chart Patterns
The advantages of harmonic patterns are as follows:
- Harmonic chart patterns provide clearly defined entry, stop-loss, and profit target levels using objective Fibonacci measurements.
- These patterns can identify potential market reversals before they become obvious through traditional chart patterns.
- Harmonic patterns are applicable across various financial markets, including stocks, commodities, forex, indices, and cryptocurrencies.
- Traders usually combine harmonic patterns with technical indicators, trading volume, and support and resistance analysis to increase its reliability.
Limitations of Harmonic Chart Patterns
Along with advantages, the harmonic pattern also has some limitations as follows:
- Harmonic patterns require precise Fibonacci measurements, making them more challenging to identify than conventional chart patterns.
- Some harmonic patterns occur relatively infrequently, requiring traders to analyse multiple charts before finding suitable trading opportunities.
- Even when all Fibonacci ratios align correctly, harmonic patterns can still fail due to unexpected news events, economic announcements, or sudden changes in market sentiment.
- It can be difficult to understand harmonic trading as a beginner, because you have to accurately measure multiple Fibonacci retracement and extension levels.
To wrap up
Harmonic chart patterns combine price action with Fibonacci analysis to help traders identify potential market reversals in a structured and objective manner. Each pattern has its own set of price structures, but they all are used for the same basic purpose of locating places where buying or selling pressure may begin to change.
Harmonic trading is a patient and accurate Fibonacci measuring process, but it also gives the trader clearly defined entry, stop-loss and target levels.
FAQs
What are harmonic chart patterns?
Harmonic chart patterns are advanced technical analysis patterns that use specific Fibonacci retracement and extension ratios to identify potential bullish or bearish market reversals.
Which are the most popular harmonic chart patterns?
Some of the most widely used harmonic patterns include the Gartley, Butterfly, Bat, Crab, Cypher, and Shark patterns.
Are harmonic chart patterns can be used by beginners?
Yes, but they should learn Fibonacci retracement and extension tools first, before harmonic patterns.
Can harmonic chart patterns be used for intraday trading?
Yes. Harmonic patterns can be applied to intraday, swing, and positional trading.
How are harmonic chart patterns different from traditional chart patterns?
Traditional chart patterns primarily focus on price structure and trendlines, while harmonic patterns combine price action with specific Fibonacci ratios.







