



Shark Pattern




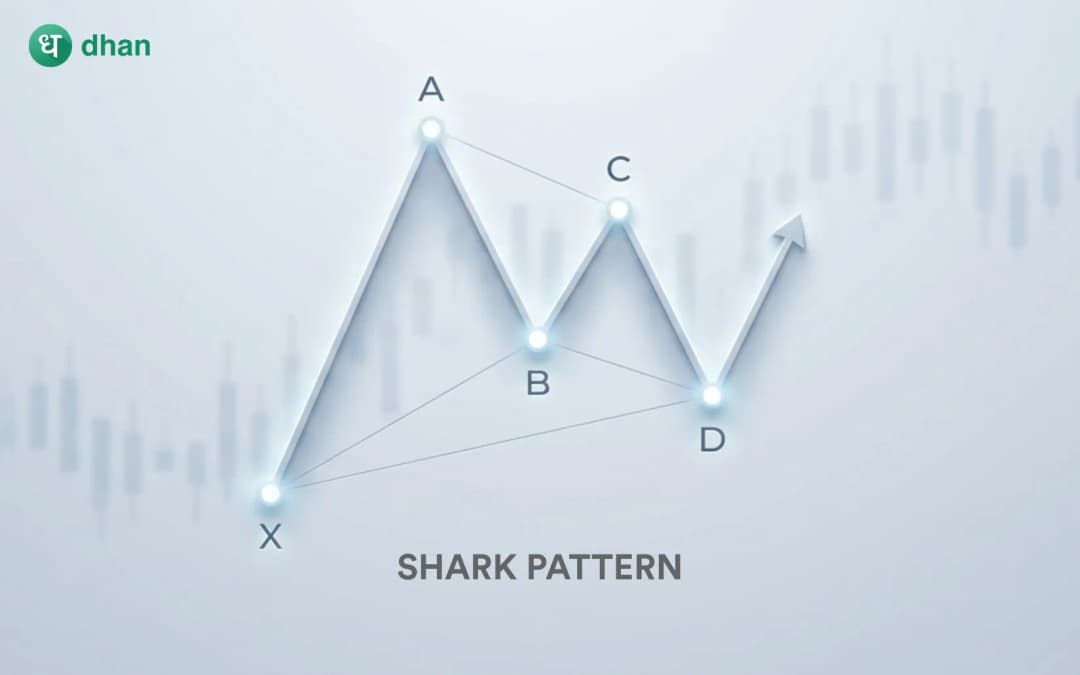




Key takeaways
- The Shark pattern is a harmonic chart pattern that helps traders identify potential bullish and bearish reversals using a specific sequence of price swings and Fibonacci ratios.
- Unlike many harmonic patterns, the Shark pattern completes before the traditional D point, making it unique among Fibonacci-based trading setups.
- The pattern becomes more reliable when combined with technical indicators, support and resistance levels, trading volume, and disciplined risk management.
Financial markets are always swinging between trends and corrections. Some reversals are totally unexpected; others are part of repetitive price structures that traders have seen time after time. Harmonic patterns are one such approach to identifying potential turning points by combining price action with Fibonacci ratios.
Among these harmonic formations, the Shark pattern is one of the most recognised formations. Unlike patterns such as the Gartley, Bat, or Butterfly, the Shark pattern does not complete at the conventional D point. Instead, it finishes at point C, where traders begin looking for signs that the prevailing trend may reverse.
Although the Shark pattern may appear complicated initially, its logic becomes much easier to understand once its structure and Fibonacci relationships are broken down. Rather than predicting market direction with certainty, it helps traders identify areas where a reversal is statistically more likely to occur.
What is a Shark Pattern?
The Shark pattern is a harmonic reversal pattern developed by Scott Carney. It consists of five price points: O, X, A, B, and C, connected by four price legs.
Unlike most harmonic patterns that complete at point D, the Shark pattern reaches completion at point C, which represents the Potential Reversal Zone (PRZ).
The pattern can identify both bullish and bearish reversals:
- A Bullish Shark pattern suggests that a downtrend may be ending and an upward reversal could begin.
- A Bearish Shark pattern indicates that an uptrend may be losing momentum and a downward reversal is possible.
The Shark pattern often appears before the development of another harmonic structure known as the 5-0 Pattern, making it particularly useful for traders who specialise in harmonic trading.
Understanding the structure of a Shark pattern
The Shark pattern consists of four price legs:
- OX
- XA
- AB
- BC
Each leg follows specific Fibonacci relationships that distinguish the Shark pattern from other harmonic formations.
OX leg
The OX leg traces the initial impulsive price movement. It sets the foundation of the pattern and serves as the reference for measuring the remaining price swings.
XA leg
The XA leg moves in the opposite direction to the OX. This correction is more of a temporary profit booking and not a complete reversal.
AB leg
The AB leg extends beyond point X. This is one of the defining characteristics of the Shark pattern because the price moves beyond the previous swing, creating the impression that the existing trend will continue. However, this extension usually attracts late buyers or sellers before the market begins reversing.
BC leg
The BC leg completes the pattern and forms the Potential Reversal Zone.
Once point C is reached, traders begin monitoring the market for confirmation signals that indicate buyers or sellers may be taking control.
Fibonacci ratios used in the Shark pattern
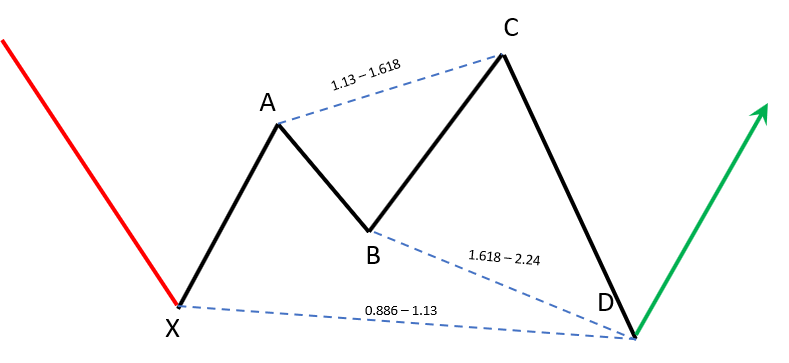
The Shark pattern is based on Fibonacci measurements. This makes the price analysis of the moves an important step in identifying the move. Some of the important Fibonacci relationships are as follows:
- The XA leg generally retraces a portion of the OX leg.
- The AB leg typically extends beyond point X and reaches approximately 113% to 161.8% of the OX leg.
- The BC leg usually completes near the 88.6% retracement of the OX leg while also satisfying Fibonacci projections based on the XA leg.
These measurements help traders determine whether the developing structure qualifies as a valid Shark pattern.
Since minor price variations frequently occur in live markets, traders often allow small deviations instead of expecting perfect Fibonacci precision.
Bullish vs bearish Shark pattern
The Shark pattern can indicate reversals in both rising and falling markets.
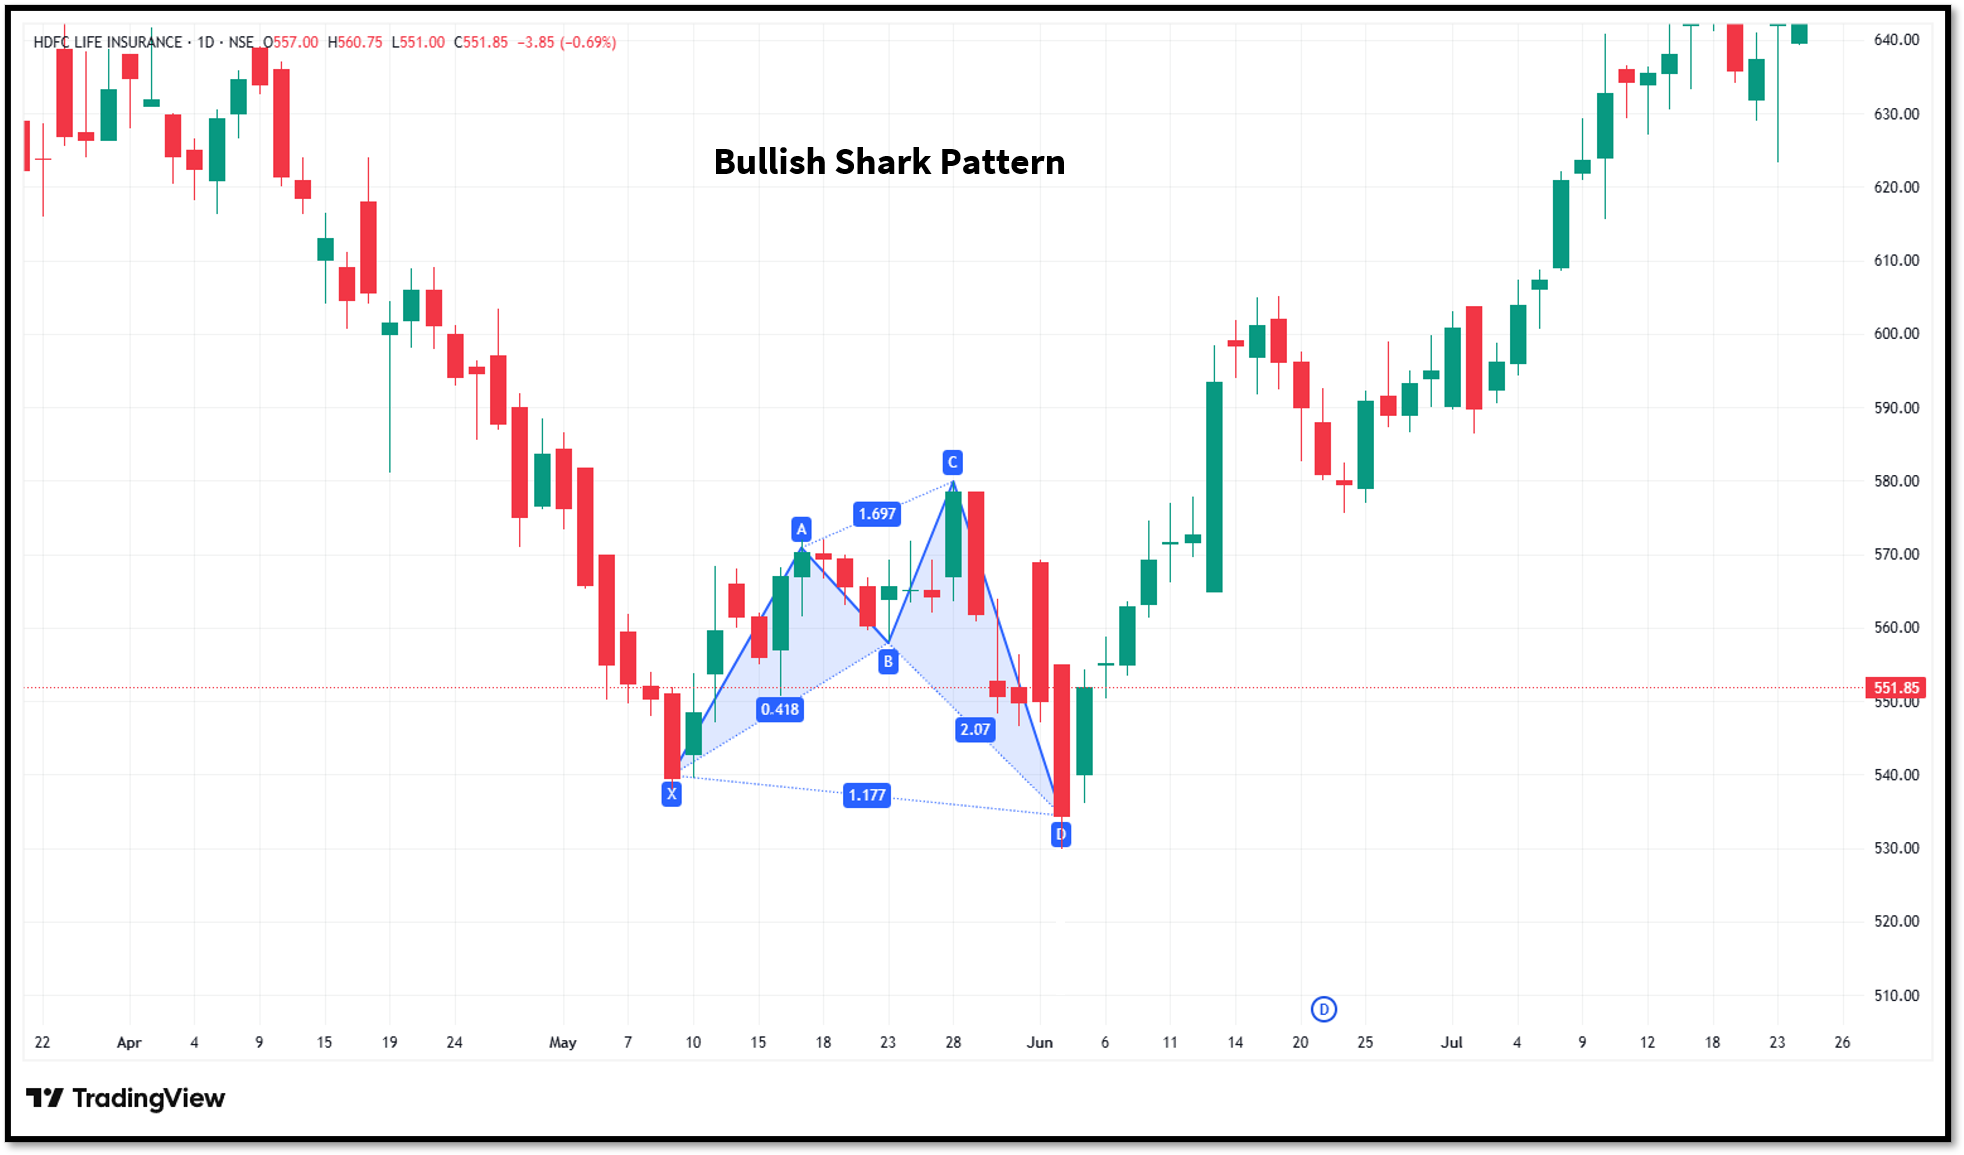
Bullish Shark pattern
A Bullish Shark develops after a downward price movement.
As the market approaches point C, selling pressure gradually weakens. If buyers begin entering near the Potential Reversal Zone, the pattern suggests that an upward reversal may be developing.
Traders often look for bullish candlestick confirmation before considering a long position.
Bearish Shark pattern
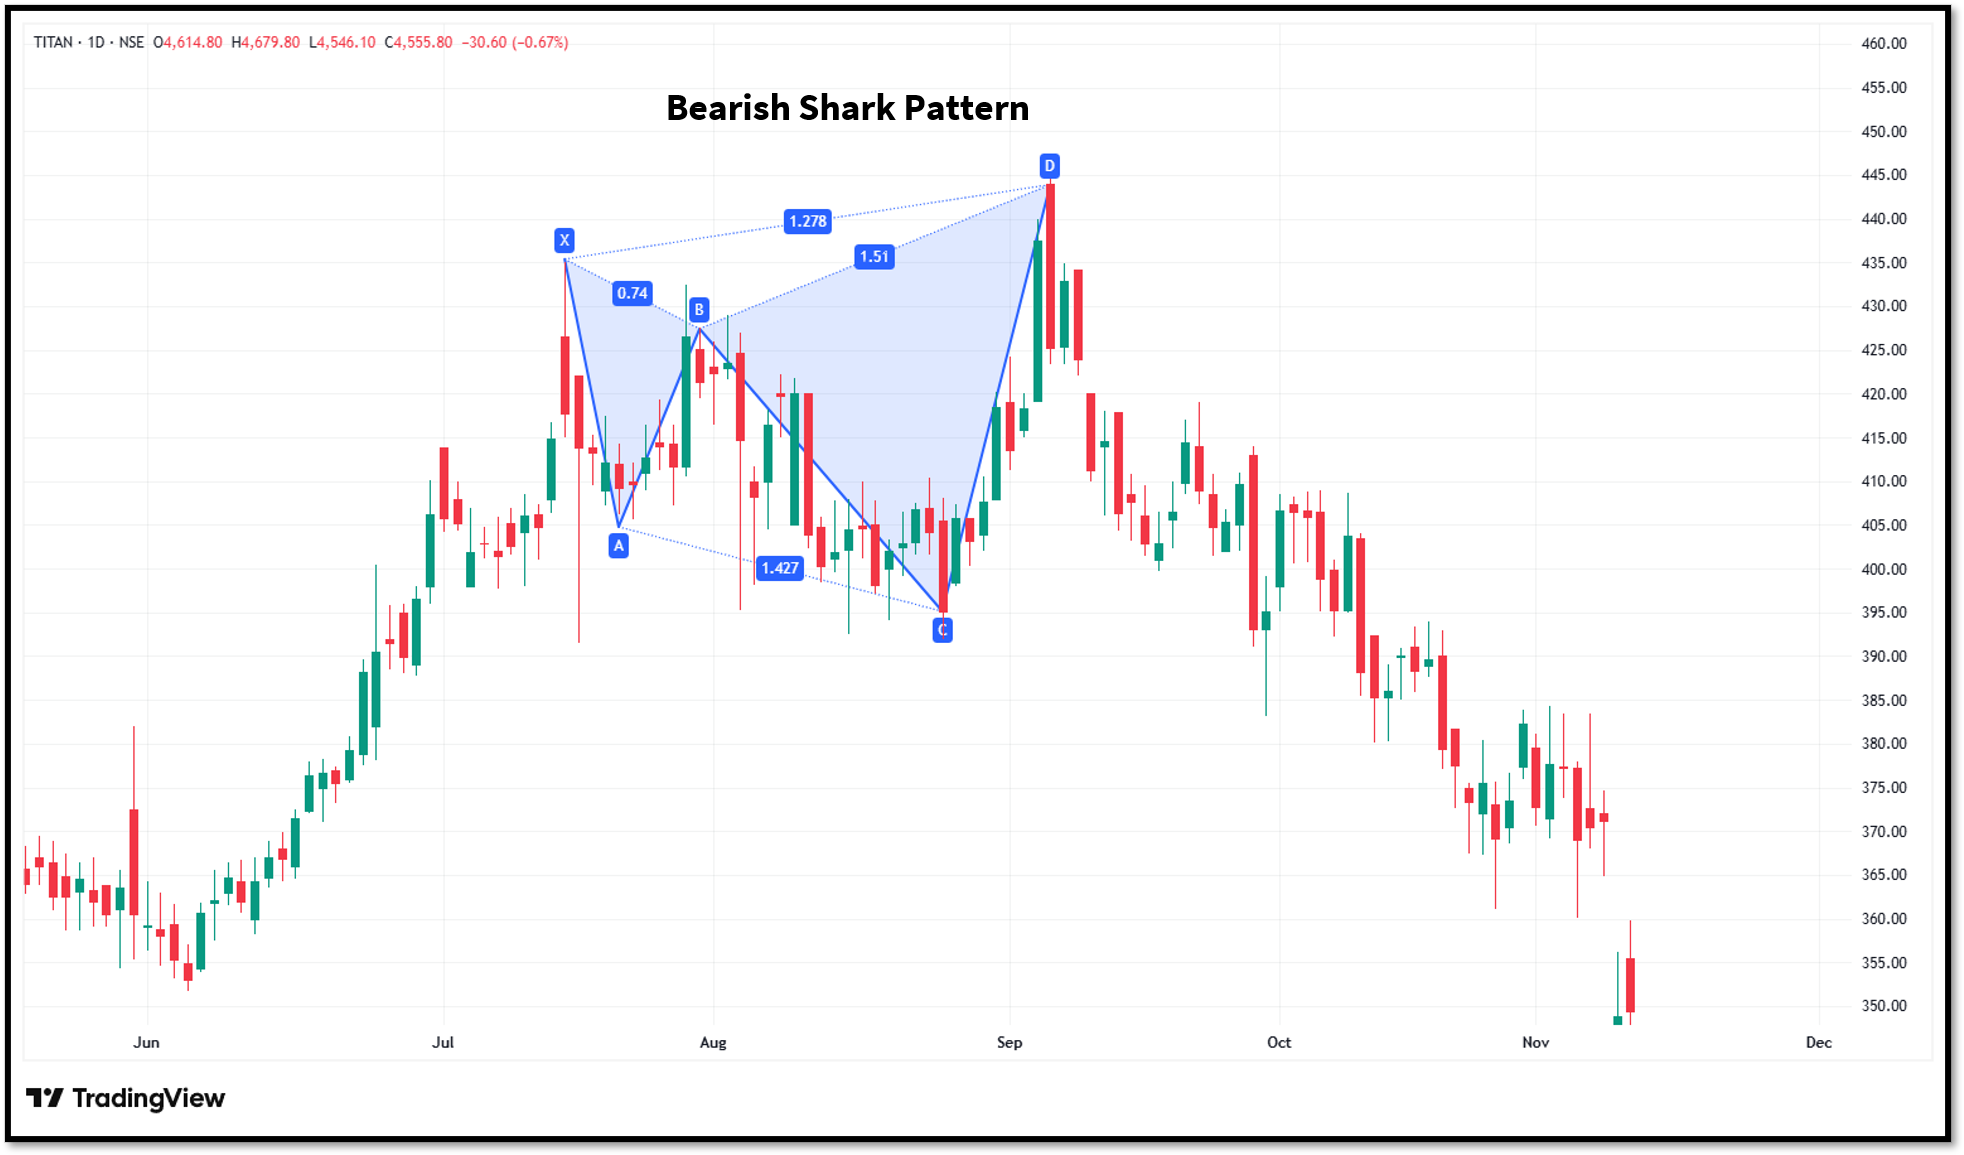
A Bearish Shark appears after an upward price movement.
When prices reach point C, buying momentum begins slowing, increasing the possibility that sellers may regain control. The pattern usually confirms itself with a bearish candle.
Market psychology behind the Shark pattern
The Shark pattern reflects a gradual shift in market sentiment rather than an immediate reversal.
The OX leg demonstrates strong momentum, with either buyers or sellers clearly dominating the market.
During the XA correction, some traders begin booking profits while others view the move as a temporary pullback. At this stage, confidence in the prevailing trend largely remains intact.
The AB leg creates renewed optimism because prices extend beyond point X. Many market participants interpret this move as confirmation that the trend will continue and begin entering positions in the direction of the breakout.
But this enthusiasm usually reaches its peak near point C. As prices approach the Potential Reversal Zone, momentum begins to slow. Early participants start taking profits, while experienced harmonic traders monitor the market for signs that the dominant trend is losing strength.
Once confirmation appears, the balance gradually shifts toward the opposite side of the market, increasing the possibility of a reversal.
How to trade a Shark Pattern
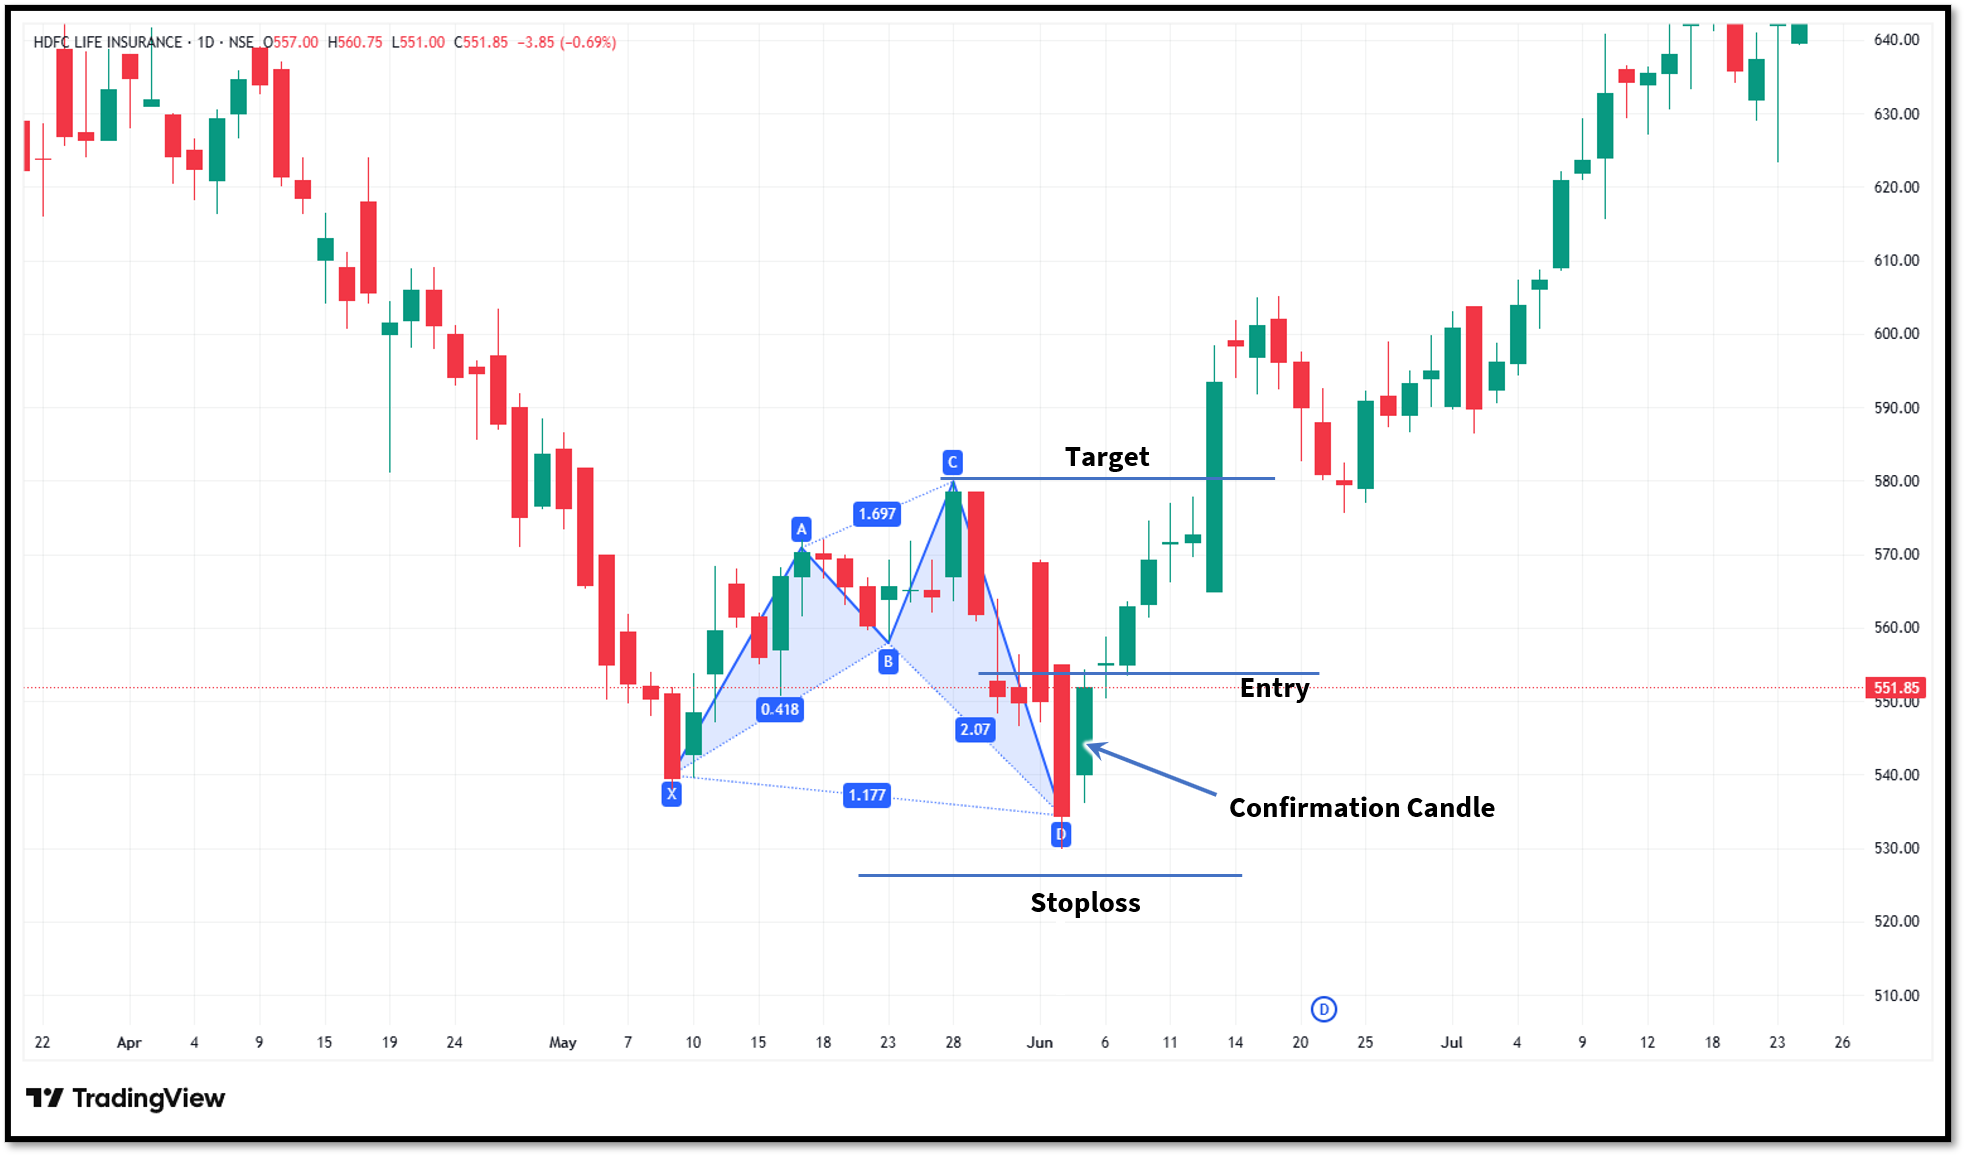
Once a Shark pattern has been identified, the next step is to wait for confirmation before entering a trade. You may use the following approach while trading the shark pattern.
Verify the Fibonacci ratios
Before considering a trade, confirm that all price legs satisfy the required Fibonacci relationships.
Ensure the following:
- The XA leg extends 113% to 161.8% of the OX leg.
- The AB leg extends 161.8% to 224% of the XA leg.
- Point B forms near the 88.6% retracement of the OX leg, creating the Potential Reversal Zone (PRZ).
Wait for confirmation and Entry
Reaching the PRZ does not automatically mean the market will reverse. Traders should wait for confirmation before entering a position. Some commonly used confirmation signals include:
- Bullish or bearish candlestick reversal patterns.
- A noticeable increase in trading volume.
- RSI divergence indicates weakening momentum.
- A MACD crossover supporting a potential reversal.
- A break of a short-term trendline after the reversal begins.
Once confirmation appears, traders can consider entering a position in the direction of the expected reversal.
Place a stop-loss
For a Bullish Shark, the stop-loss is commonly placed slightly below the PRZ. For a Bearish Shark, it is generally placed just above the PRZ.
Set a profit target
Profit targets can be planned using different approaches depending on market conditions. Many traders use one or more of the following methods:
- Previous swing highs or swing lows.
- Fibonacci retracement levels of the reversal move.
- Fixed risk-reward ratios such as 1:2 or 1:3.
- Trailing stop-loss techniques to capture larger trends
Advantages of the Shark Pattern
The advantages of the shark pattern are as follows:
- The shark pattern is based on the Fibonacci pattern and offers well-defined entry, stop-loss and target levels. This gives traders the chance to develop a systematic trading plan before they place a position.
- The pattern can help traders to identify the reversal in its early stages, which provides traders with the advantage of early entry.
- The pattern can be applied across different financial markets, including stocks, forex, commodities, indices, and cryptocurrencies.
- When combined with technical indicators such as RSI, MACD, trading volume, and support and resistance levels, the Shark pattern can provide stronger confirmation and improve overall trade quality.
Limitations of the Shark pattern
Along with advantages, the Shark pattern has some limitations as well.
- The Shark pattern requires precise Fibonacci measurements, making it more challenging to identify than conventional chart patterns.
- The shark pattern’s appearance is less common than other patterns, like triangles or double tops. Traders may need to analyse several charts before finding a valid opportunity.
- The Shark pattern can also produce false signals, particularly during highly volatile markets or major economic events. Confirmation is essential before taking a trade.
- Beginners often find harmonic trading difficult because several Fibonacci relationships must align simultaneously.
The final verdict
The Shark pattern is a price formation that appears at the end of a trend and signals reversals. The pattern structure is fully based on the Fibonnaci ratios and price action. At first, the pattern may appear complex, but once understood properly, it becomes easy to identify. Although the pattern provides a possible reversal signal, it is not fully reliable. Its reliability increases when used in combination with other indicators and candlestick patterns.
FAQs
What is a Shark pattern in trading?
The Shark formation is a pattern used in trading that can result in both bullish and bearish reversals using a series of Fibonacci retracements and extensions.
Does the Shark pattern work in intraday trading?
Yes. The Shark pattern can be used in intraday, swing, and positional trading. But traders must understand that the shorter timeframes can generate more false signals.
How is the Shark pattern different from the Cypher pattern?
The Shark pattern and Cypher pattern are both harmonic patterns, but they follow different Fibonacci relationships and price structures. Also, the Shark pattern uses the OXABC structure, whereas the Cypher pattern follows the XABCD structure.
Is the Shark pattern suitable for beginners?
Yes, but especially for those who have just started using Shark patterns, the Fibonacci retracement and extension tools must be learned.
What are the best indicators to use with the Shark pattern?
The Shark pattern typically works well with RSI, MACD, trading volume and support and resistance analysis for better confirmation before entering a trade.







