



Inverted Hammer vs Shooting Star








Key takeaways
- The inverted hammer and shooting star look almost the same, but their meanings are opposite, as they appear in different market trends.
- The inverted hammer is a pattern that can form after a downtrend and indicates a potential bullish reversal.
- The shooting star pattern occurs after an uptrend and signals a potential bearish reversal.
- Always verify the pattern with the next candlestick prior to making a trade decision.
- Both reversal patterns are more reliable when there is higher trading volume.
Ever look at a candlestick chart and see two candles that look almost the same but indicate totally opposite market moves?
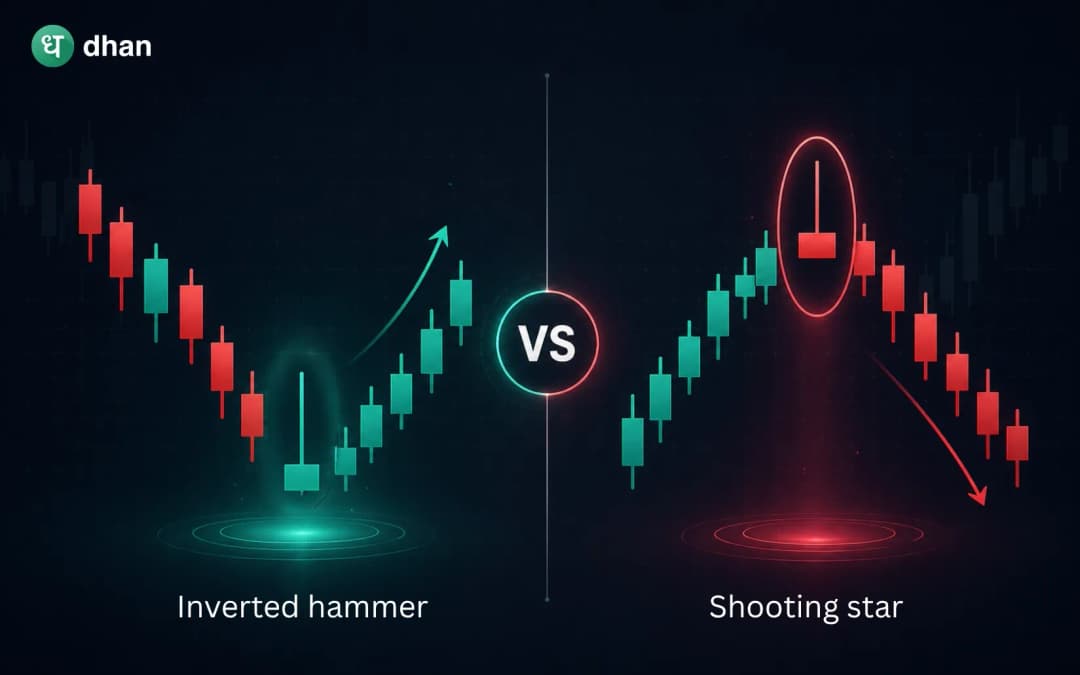
Two such candlestick patterns are the inverted hammer and the shooting star. At first glance, they have the same shape: a small real body with a long upper shadow and little or no lower shadow. But the trend in which they appear changes their meaning completely.
Many newbie traders confuse the two and make the wrong trading decisions. It’s important to know the difference, because if you’re getting into a trade based on the wrong interpretation, you may actually be increasing your risk instead of increasing your chances of success.
In this guide, you will learn what these patterns mean, how they are formed, the psychology behind them and the key differences so you can identify them correctly.
What is an Inverted Hammer?
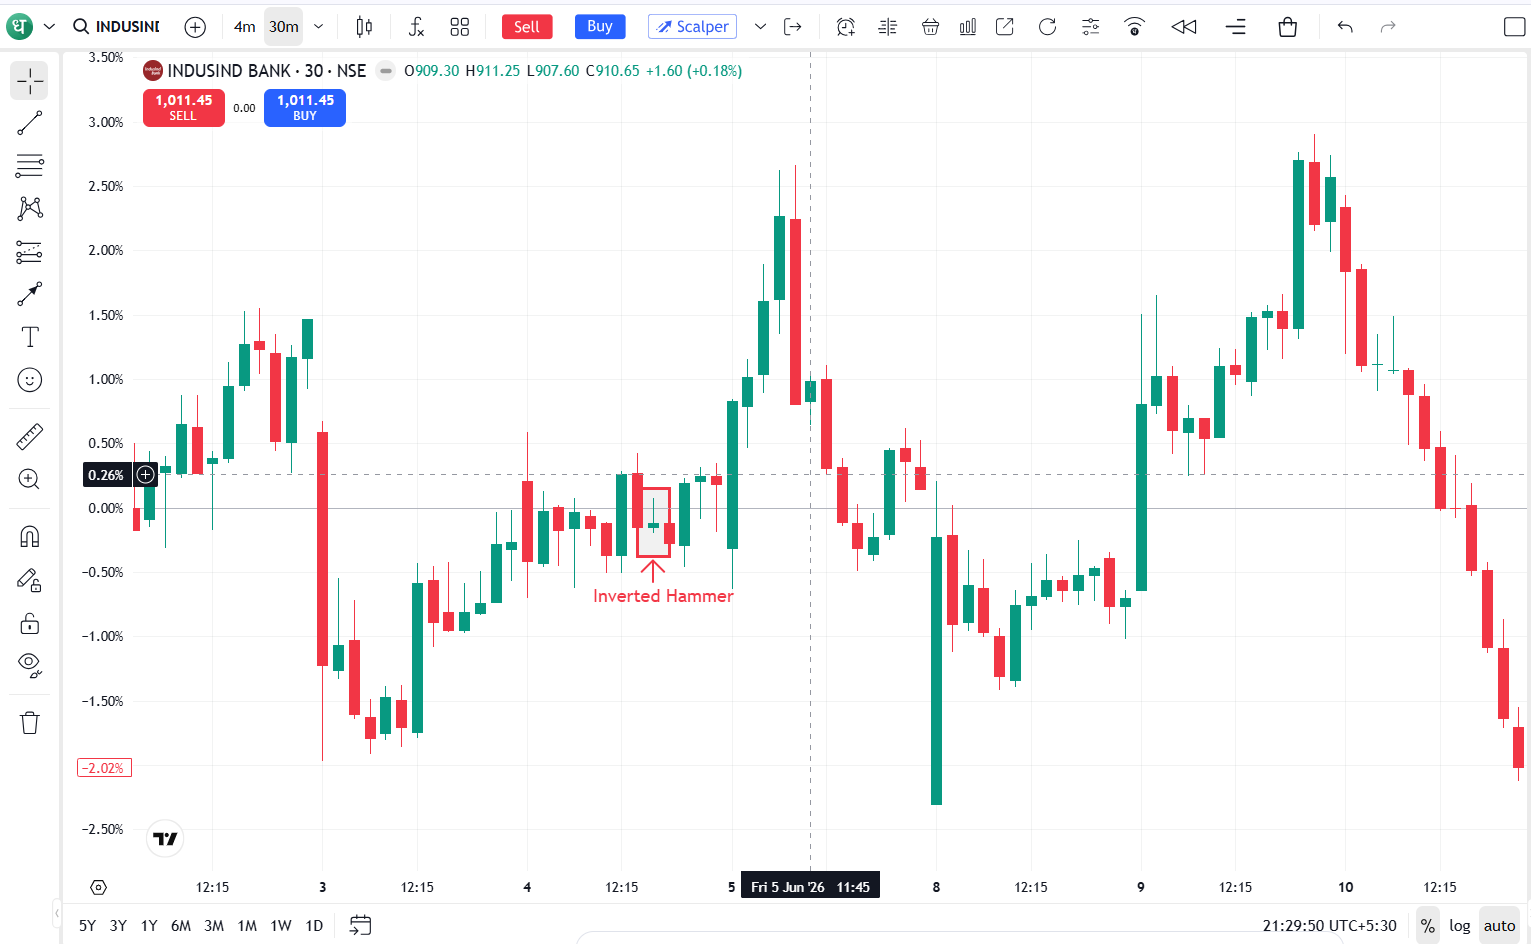
The inverted hammer is a bullish candlestick reversal pattern that is observed after a downtrend. This indicates that the selling pressure might be subsiding and buyers are starting to come in.
The candle finishes near the opening price, but the long upper shadow indicates that buyers in the trading session were able to push the price significantly higher. Sellers pushed the price back before the close, but the buying interest is an early indication that the market sentiment could be changing.
The inverted hammer alone does not confirm a trend reversal. Usually, traders wait for a bullish candle in the next session and then consider a long position.
Why does an inverted hammer form?
Each candle is a story of the struggle between buyers and sellers.
If it is an inverted hammer:
- Sellers resume the existing downtrend at the opening.
- Buyers become more confident and bid prices higher.
- Selling pressure returns before the market closes.
- The candle closes near its opening price, with a long upper wick.
The sellers try to push the price back, but the buyers show enough strength to challenge the prevailing downtrend.
This momentum shift often attracts traders looking for an early reversal play.
What is a shooting star?
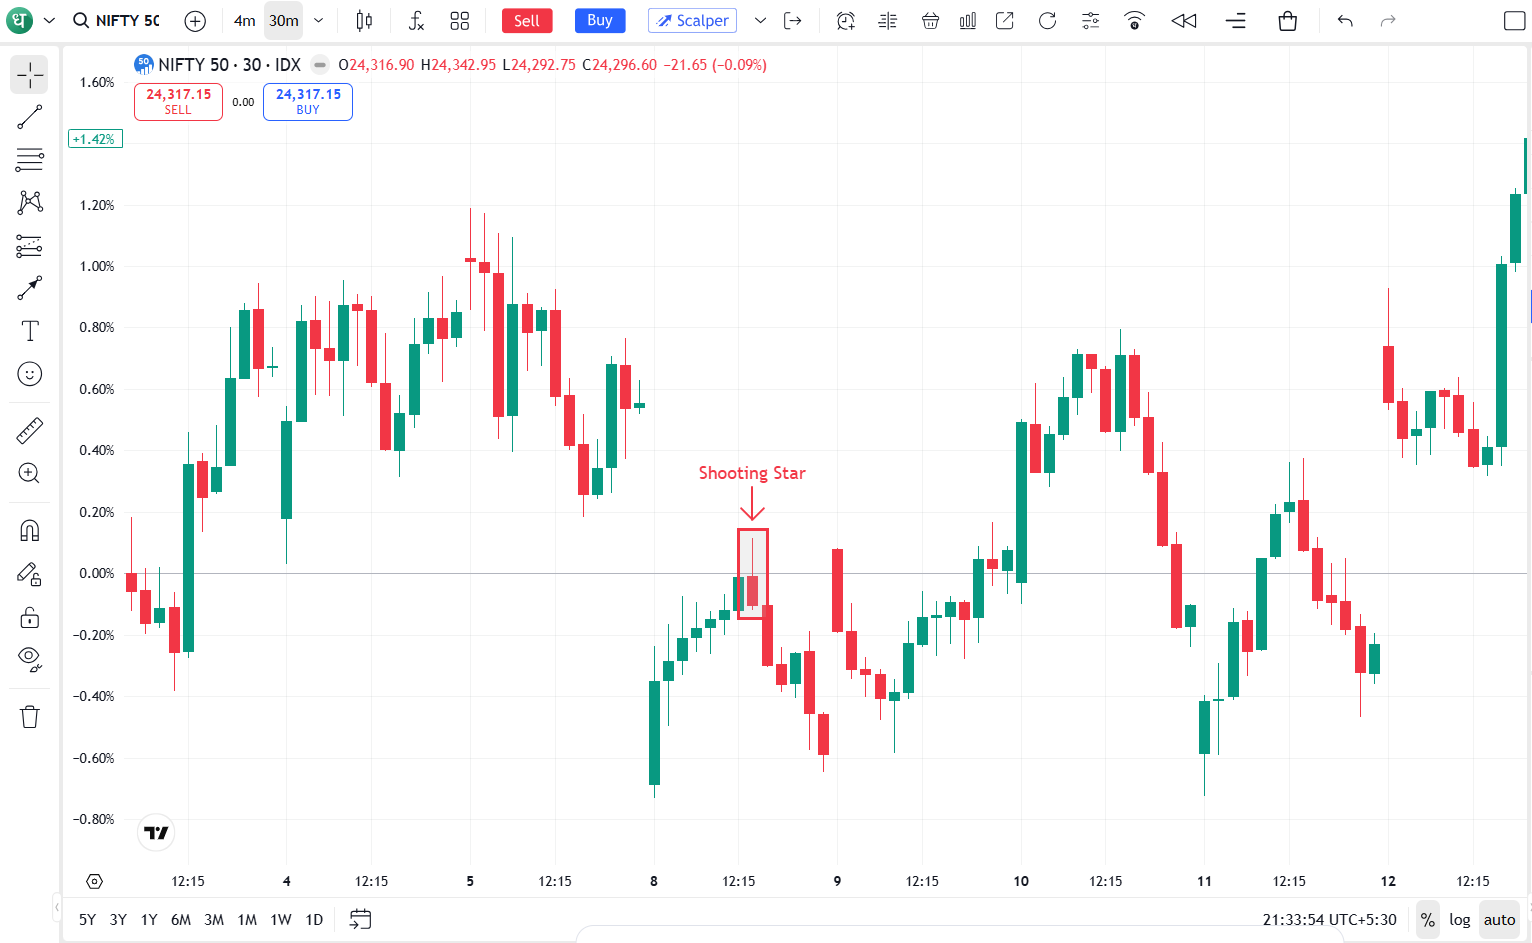
A shooting star is a bearish candlestick reversal pattern that happens after an uptrend. Buyers might be losing control, and sellers are beginning to take over.
The shooting Star is similar to the inverted hammer in that it has a small real body and a long upper shadow. But it has a very different significance because it takes place after a price rise.
The pattern implies buyers tried to prolong the uptrend, but sellers stepped in and rejected the higher prices before the close of the session.
Most traders wait for a bearish confirmation candle before entering a short trade or closing long positions.
Why does a shooting star form?
Maybe the market psychology behind this pattern is a change of control.
This is what happens:
- Buyers continue pushing prices up.
- Profit booking pulls new highs.
- Sellers are more active and outperform buyers.
- Prices crash just before the market closes.
The long upper shadow indicates rejection of higher prices by the market.
Inverted hammer vs shooting star: Key differences
The biggest reason traders confuse these two candlestick patterns is that they are almost identical in appearance. But the market trend before they come changes their interpretation completely.
Why do these patterns look so similar?
Both patterns are with.
- Small real body
- Long upper shadow
- Lower shadow small or none
The similarities are such that many traders base their decision on the candle appearance alone, ignoring the market context.
This is where mistakes are made.
That same candlestick shape might be a buy signal in one situation and a sell signal in another.
The only thing that changes is the location of the candle.
- When the pattern occurs after a downtrend, it is called an inverted hammer and signals a possible bullish reversal.
- After an uptrend, the same shape becomes a shooting star, a possible bearish reversal.
This difference is significant for traders because it allows them to avoid taking positions against the prevailing market sentiment.
Market psychology behind both patterns
Learning candlestick patterns becomes much easier when you focus on the emotions behind the market rather than trying to memorise the shapes.
Market psychology of an inverted hammer
An inverted hammer indicates the first signs of buyers returning after a long decline.
This is what a typical trading session looks like:
- Sellers are still forcing prices lower. The downtrend remains in place.
- Lower prices are attractive to buyers, and they start buying.
- Buying momentum pushes the price higher during the session.
- Sellers try to regain control near the close.
- Although the candle closes near its opening level, buyers have shown renewed strength.
The shift in buying interest suggests that bearish momentum might be weakening.
Traders, however, should wait to see a bullish confirmation candle before assuming the trend is reversed.
Market psychology of a shooting star
A shooting star has a very different story.
This is the typical development of the trading session:
- Buyers continue the current uptrend with confidence.
- Prices reach new highs during the session.
- Sellers start to take profits or short the market.
- The price is pushed back down by selling pressure before the close.
- The long upper shadow indicates that the market rejected higher prices.
This pattern suggests that bullish momentum may be waning.
A lower close of the following candle increases the odds of a bearish reversal.
How to trade an inverted hammer vs shooting star
Both these candlestick patterns point to a possible trend reversal, but the trading strategy adopted will depend on the already existing trend in the market. The major differences are highlighted in the table below.
Common mistakes traders make when trading inverted hammer and shooting star
Even experienced traders can misinterpret the candlestick pattern.
By recognising these common mistakes, you can make better decisions and protect your capital.
Trading without considering the trend
Many traders look at the shape of the candle and ignore the trend. And this tends to result in wrong decisions. An inverted hammer appears after a downtrend, and a shooting star appears after an uptrend. If the trend is not consistent with the pattern, the signal is less reliable.
Ignoring confirmation
Don’t jump into the trade as soon as the pattern appears. Wait for the next candle to confirm the reversal. This confirmation candle helps to weed out false signals and improves the odds of a successful trade.
Ignoring volume
Volume shows the power behind a price move. If a reversal pattern occurs on high volume, it is generally more reliable than if it occurs on low volume. Always check the volume before you make a trade decision.
Trading against support or resistance
Support and resistance levels can make the price move after a reversal pattern. Check if the stock is near a key support or resistance level before getting into a trade. These areas can slow down or reverse the price action.
Risking too much on a single trade
No candlestick pattern works all the time. Use a stop-loss and trade with an appropriate position size to manage your risk. This will help protect your capital if the trade does not go your way.
Depending on one indicator alone
Don’t just look at an inverted hammer or shooting star. Combine them with other indicators such as RSI, MACD, moving averages, and support and resistance levels to make better trade decisions.
Wrapping up
In technical analysis, some of the most well-known candlestick patterns are the inverted hammer and shooting star. They look almost identical, but they represent opposite market sentiments because they appear in different trends.
An inverted hammer appears after a downtrend and suggests that buyers may be entering. A shooting star appears after an uptrend and suggests that sellers may be taking control.
However, no candlestick pattern can guarantee a successful trade. The best trading decisions are made by combining candlestick analysis with confirmation signals, technical indicators, volume analysis and sound risk management.
FAQs
1. What is the main difference between an inverted hammer and a shooting star?
The key difference is the market trend in which they appear. An inverted hammer is formed after a downtrend and signals a potential bullish reversal. A shooting star is formed after an uptrend and signals a potential bearish reversal.
2. Are inverted hammer and shooting star patterns reliable?
These patterns can be reliable when confirmed with confirmation candles, trading volume, technical indicators and key support or resistance levels. Generally, they are more effective when used within a larger trading strategy.
3. Should I trade immediately after spotting these patterns?
No. It is best to wait for the next candle to confirm the reversal before taking a trade. This helps reduce the probability of acting on false signals.
4. Do these patterns work in all market conditions?
No. They perform better when the market is trending, as a reversal is more likely. False signals can be more common in sideways or very volatile markets.
5. Can these patterns be used for intraday trading?
Yes. Both of these patterns can be used on a variety of time frames, including intraday charts. But always check if it is confirmed and also check the overall market conditions before taking a trade.







