



Bearish Chart Patterns








Key takeaways
- These bearish chart patterns can indicate when the momentum ends before a big drop in price begins.
- Head and shoulders, double top, and triple top patterns are often signs of buyers losing control at key resistance levels.
- Waiting for a confirmed breakdown helps traders avoid false signals and premature entries.
- Combining chart patterns with volume analysis and risk management can improve trading decisions.
The stock market is dynamic. As bullish patterns can help traders find buying opportunities, bearish chart patterns can help traders identify potential price declines. These patterns are very popular in technical analysis to get a sense of when the selling pressure is increasing and when a stock may be about to enter a downtrend.
By understanding bearish chart patterns, traders and investors in India can protect profits, avoid weak stocks, and make more informed trading decisions.
What are Bearish Chart Patterns?
Bearish chart patterns are price patterns that indicate a stock’s price may drop. These typically show up after a period of uptrend or during consolidation and suggest the sellers might take over the market soon.
These patterns are created because of the change in market sentiment. Buyers start to lose their strength, and sellers start to become more active. You can get certain structures forming on the chart.
But bearish patterns should not be used exclusively. They work best when used together with volume analysis, support and resistance levels and other technical indicators.
Why are Bearish Chart Patterns important?
Bearish chart patterns assist traders to:
- Identify possible trend reversal
- Lock in profits ahead of market dips
- Search for short opportunities in the market
- Enhance risk management
- Avoid buying stocks at the top
The aim is not to predict every market move but to improve the probability of making better trading decisions.
Popular Bearish Chart Patterns
Popular bearish chart patterns are useful for traders to recognise possible trend reversals and continuation signals. They offer useful insight into market sentiment, selling pressure, and potential downside price action.
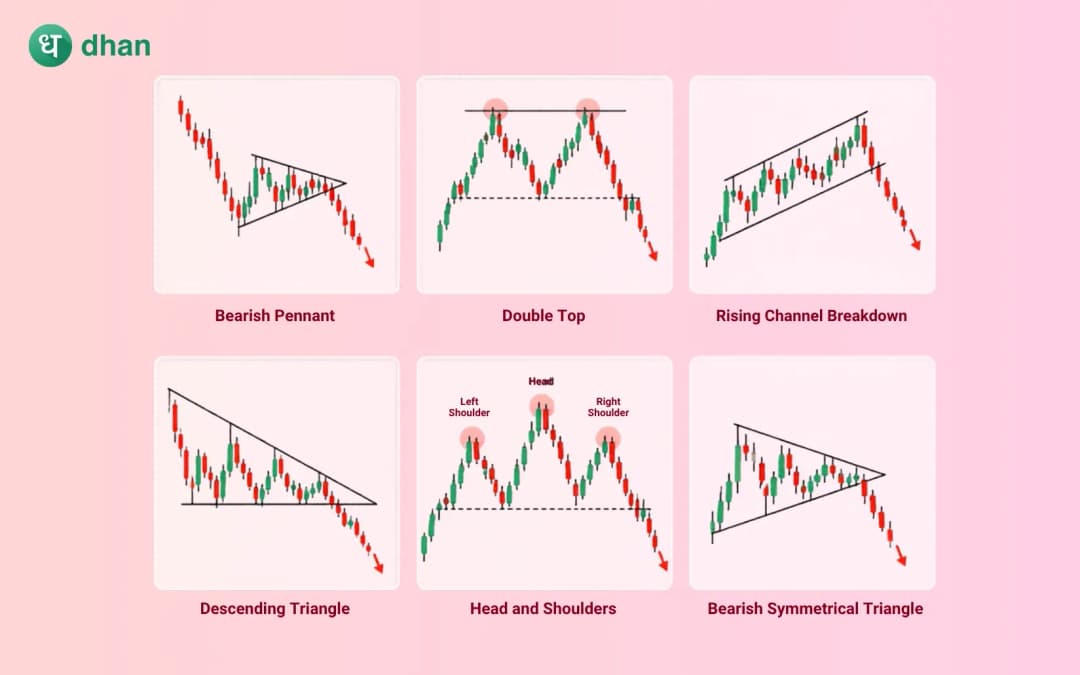
1. Head and shoulders pattern
The head and shoulder pattern usually forms after a strong uptrend and indicates that the buying momentum is slowly fading away.
It resembles a human head between two shoulders and typically suggests a change in the market sentiment from positive to negative.
- The pattern has three peaks, with the middle peak (head) higher than the left and right shoulders, with a neckline connecting the support levels between the shoulders.
- The formation of the right shoulder is characterised by buyers' inability to push the price above the previous high, which suggests a decline in bullish strength and an increase in selling momentum.
- The signal to confirm is a breakdown below the neckline support level and often marks the beginning of a potential downtrend.
- This pattern is monitored closely by traders as it often appears near market tops and can be an early warning of a major trend reversal if it occurs with heavy volume.
2. Double top pattern
One of the most common bearish reversal patterns in technical analysis is the Double Top, which is easily identified by its “M” shape on the chart.
- The pattern evolves with a first peak, then a pullback and then a second peak around the same resistance level.
- Buyers are not able to push prices above the previous high, which indicates weakening bullish strength and growing hesitation in the market.
- The support level between the two peaks is very important because it creates the confirmation zone of the pattern.
- Traders do not consider the pattern complete until the price breaks and closes below this support level, signalling a possible reversal of the trend.
3. Triple top pattern
A Triple Top is a bearish reversal pattern that happens when the price tries to break above a resistance level three times but fails each time.
- There are three peaks at roughly the same price level, creating a strong resistance zone.
- Each failed attempt to move higher chips away at buyer confidence and invites more traders to take profits.
- Repeated rejection at resistance indicates active seller defence of that price area.
- Confirmation of the bearish reversal signal is a breakdown below the support level with higher volume of trading.
4. Descending triangle
The Descending Triangle is a bearish continuation pattern, and it often occurs within an existing downtrend.
This happens when the price prints a series of lower highs and keeps getting support on the same level. It shows increasing selling pressure and decreasing buying interest over time.
- The pattern is characterised by a flat support line and a downward resistance trendline comprising lower highs.
- This rally is weaker than the last one, which means sellers are getting more aggressive.
- Buyers continue to defend the support zone, but the ability of the buyers to push prices higher is slowly decreasing.
- The primary trading signal is a breakdown below the support level, which is usually followed by more downside movement.
5. Rising wedge pattern
The rising wedge is a bearish pattern that forms when prices continue to move higher between two trendlines that converge.
The stock seems to be trending up, but the tightening price range suggests the bullish momentum is slowly fading.
- The pattern is created by ascending support and resistance lines that come together over time.
- Prices continue making higher highs and higher lows, but each spike is weaker than the last.
- The closing of the range indicates that the buyers are losing their strength despite the prevailing upward movement.
- The pattern is confirmed with a close below the lower trendline, and it usually signals the start of a move to the downside.
6. Bearish flag pattern
The Bearish Flag is a continuation pattern that forms after a large downward move in price.
After the sharp drop, the market enters a short consolidation phase where prices move sideways or slightly up before continuing in the direction of the original trend.
- The pattern consists of a sharp fall called the flagpole, followed by a small upward or sideways channel called the flag.
- Some traders take profits while others try to buy cheaper during the consolidation phase.
- The recovery within the flag is usually weak and lacks enough momentum to reverse the overall downtrend.
- A break below the lower boundary of the flag pattern confirms the pattern and suggests a continuation of the bearish trend.
7. Bearish pennant
The Bearish Pennant is a common continuation pattern that develops after a significant drop in price. Looks like a little symmetrical triangle and a little bit of consolidation before the market goes lower.
- The pattern starts with a sharp drop in price and then a short consolidation between converging trend lines.
- Compared to the Bearish Flag, the consolidation is a small triangle rather than a parallel channel.
- The pause is short-term and is a sign of the balancing of buyers and sellers until the market direction is clearer again.
- A break below the lower trendline confirms the pattern and often ends in another wave of selling pressure.
8. Inverse cup and handle pattern
The Inverse Cup and Handle is a bearish continuation pattern that develops during a downtrend and indicates potential for further price decline.
As the name suggests, it resembles an upside-down cup with a small consolidation phase, which forms the handle.
- The pattern is initiated with a rounded decline, forming an upside-down “U” shape, followed by a short rise or sideways movement that constitutes the handle.
- Buyers attempt to push the price higher during the handle formation, but the bounce is usually weak and fails to break through significant resistance levels.
- The pattern shows increasing selling pressure as each recovery attempt is fulfilled with more sellers coming into the market.
- The confirmation signal is a breakdown below the handle support, and it usually leads to a continuation of the existing downtrend.
How traders use Bearish Chart Patterns in practice
Most traders have a systematic way of finding, confirming and trading such patterns, while controlling their risk.
Here's a typical step-by-step process that is used when trading bearish chart patterns.
Step 1: Identify the current market trend
Traders first check the overall trend of the stock, then look for any bearish pattern. They look at whether the price is making higher highs and higher lows, is moving sideways, or is already showing signs of weakness.
A bearish pattern is more reliable if it appears after a strong uptrend or in an existing downtrend.
Step 2: Look for bearish chart patterns
Once the trend has been identified, traders start to look for recognisable bearish formations on the chart. These patterns tend to signal the possibility of increasing selling pressure and a potential move lower.
Step 3: Wait for confirmation
Experienced traders don't just jump into a trade because a pattern looks like it is forming. Instead, they wait for confirmation with a breakdown below a key support level, neckline or trendline.
A confirmed breakdown shows that the sellers have taken control and improved the odds of the pattern working as expected. Traders also look for higher trading volume at the breakdown to confirm the move.
Step 4: Plan the entry point
Traders then decide upon their entry point after confirmation. The approach they take is usually determined by their risk profile and trading style.
- Aggressive traders get in as soon as the breakdown candle closes below support.
- Conservative traders wait for the price to re-test the broken support level and enter only if the stock doesn’t move back above it.
- Some traders will use price action and indicators like RSI or moving averages to decide on a position.
- Good entry planning reduces emotional decision-making and enhances trade execution.
Step 5: Place a stop-loss and manage risk
Risk management is one of the most important aspects of trading bearish chart patterns. Even the best patterns can fail, and that is why a stop-loss is essential.
- In the head and shoulders pattern, the stop loss is usually placed above the right shoulder.
- In a Double Top or a Triple Top, it is usually above the resistance line.
- In a Descending Triangle, traders may place it above the last lower high.
- The size of the position should always be adjusted so that a single trade does not lead to significant losses.
Finding a bearish chart pattern is just the first step. Confirmation, trade planning and risk management are just as important and often have a deeper impact on the long-term results than the pattern itself.
Final thoughts
Bearish chart patterns are key tools for traders to identify potential market weakness and trend reversals. Head and Shoulders, Double Top, Triple Top, Descending Triangle, Rising Wedge, Bearish Flag, Bearish Pennant, etc, are all patterns that give important clues as to changing market sentiment.
The trick for the Indian stock market traders is not just to spot these patterns but to wait for the right confirmation and follow disciplined risk management. Used correctly, along with volume analysis and technical indicators, bearish chart patterns can be an important part of a successful trading strategy.
FAQs
1. Which bearish chart pattern is considered the most reliable?
The Head and Shoulders pattern is one of the most reliable bearish chart patterns, as it is a clear indication of a shift from buyer dominance to seller control. But always make sure you wait for confirmation before you commit to any trading decisions.
2. Can bearish chart patterns be used for long-term investing?
Yes, long-term investors can use bearish chart patterns to spot potential market tops and avoid buying stocks at the wrong price.
3. How important is volume when trading bearish chart patterns?
Volume is a key factor in confirming bearish chart patterns. High trading volume also contributes to the reliability of the pattern and generally reflects greater selling pressure in the breakdown.
4. Do bearish chart patterns work in all market conditions?
No, bearish chart patterns tend to work better in weak or declining markets. In strong bull trends, some patterns may fail or produce false signals, and that is why traders use other indicators to confirm.
5. What should traders do if a bearish chart pattern fails?
If a bearish pattern does not work out, traders should follow their risk management plan and exit the trade with a stop-loss. But it is important to remember that no chart pattern is a guarantee for success, so risk management is as important as the pattern.







