



Bullish Chart Patterns








Key takeaways
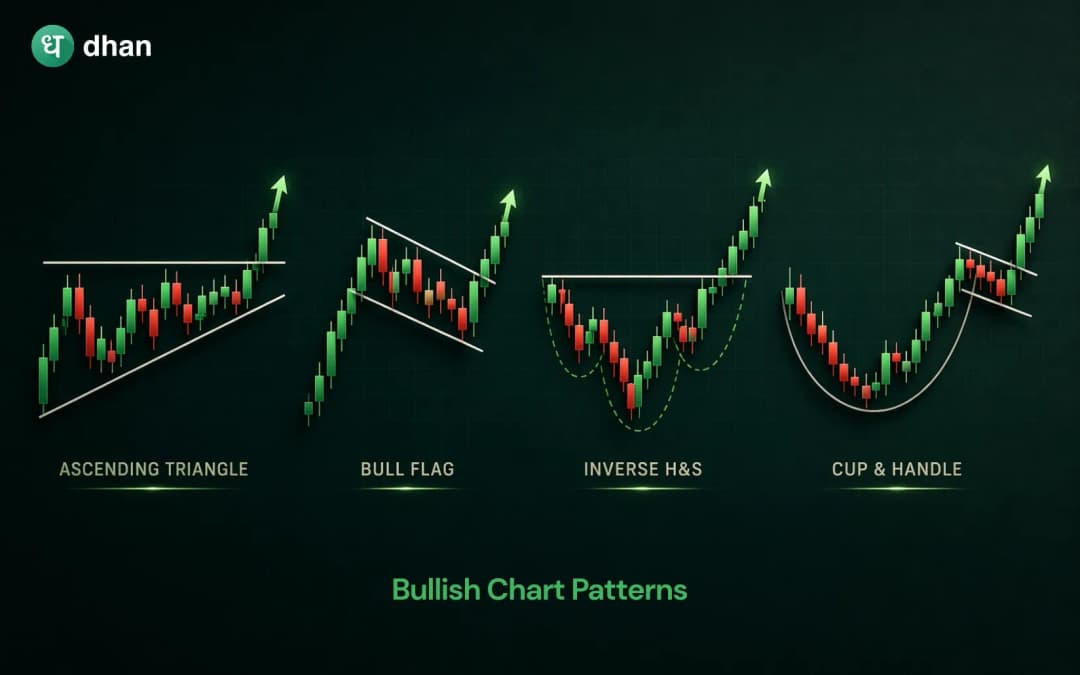
- Bullish chart patterns help traders identify potential upward price movements and trend reversals.
- Some bullish patterns indicate the continuation of an existing uptrend and some indicate a potential reversal from a downtrend.
- Popular bullish chart patterns include the Double Bottom, Triple Bottom, Ascending Triangle, Cup and Handle, and Inverse Head and Shoulders.
Financial markets are driven by the constant interaction between buyers and sellers. While news, earnings reports, economic data, and market sentiment influence prices. Traders usually use chart patterns to anticipate potential price moves.
Bullish chart patterns help traders identify situations where buying pressure may be increasing, and prices may move higher. These patterns do not predict the future price movement, but they represent recurring behaviour of the market when such a pattern appears.
By recognising such formations, traders can better understand market psychology and identify potential trading opportunities.
What are Bullish Chart Patterns?
Bullish chart patterns are price formations that suggest the possibility of an upward price move.
These patterns typically form when buyers gradually gain control over sellers. There are two types of bullish chart patterns. The patterns which form after a downtrend and indicate a possible reversal are known as bullish reversal patterns, while others form during an uptrend and suggest the trend may continue are bullish continuation patterns.
The main objective of identifying bullish patterns is to recognise situations where demand is strengthening and market sentiment is becoming more positive.
However, traders should remember that patterns provide probabilities rather than guarantees.
Why Chart Patterns Matter?
Chart patterns help traders to see the market behaviour. Patterns allow traders to study the real interaction between supply and demand. They typically offer clear entry points, stop-loss levels, and potential price targets.
More importantly, chart patterns can help traders develop a structured approach rather than making decisions based purely on emotion.
List of Bullish Chart Patterns
Here are some of the popular bullish chart patterns.
Double Bottom Pattern
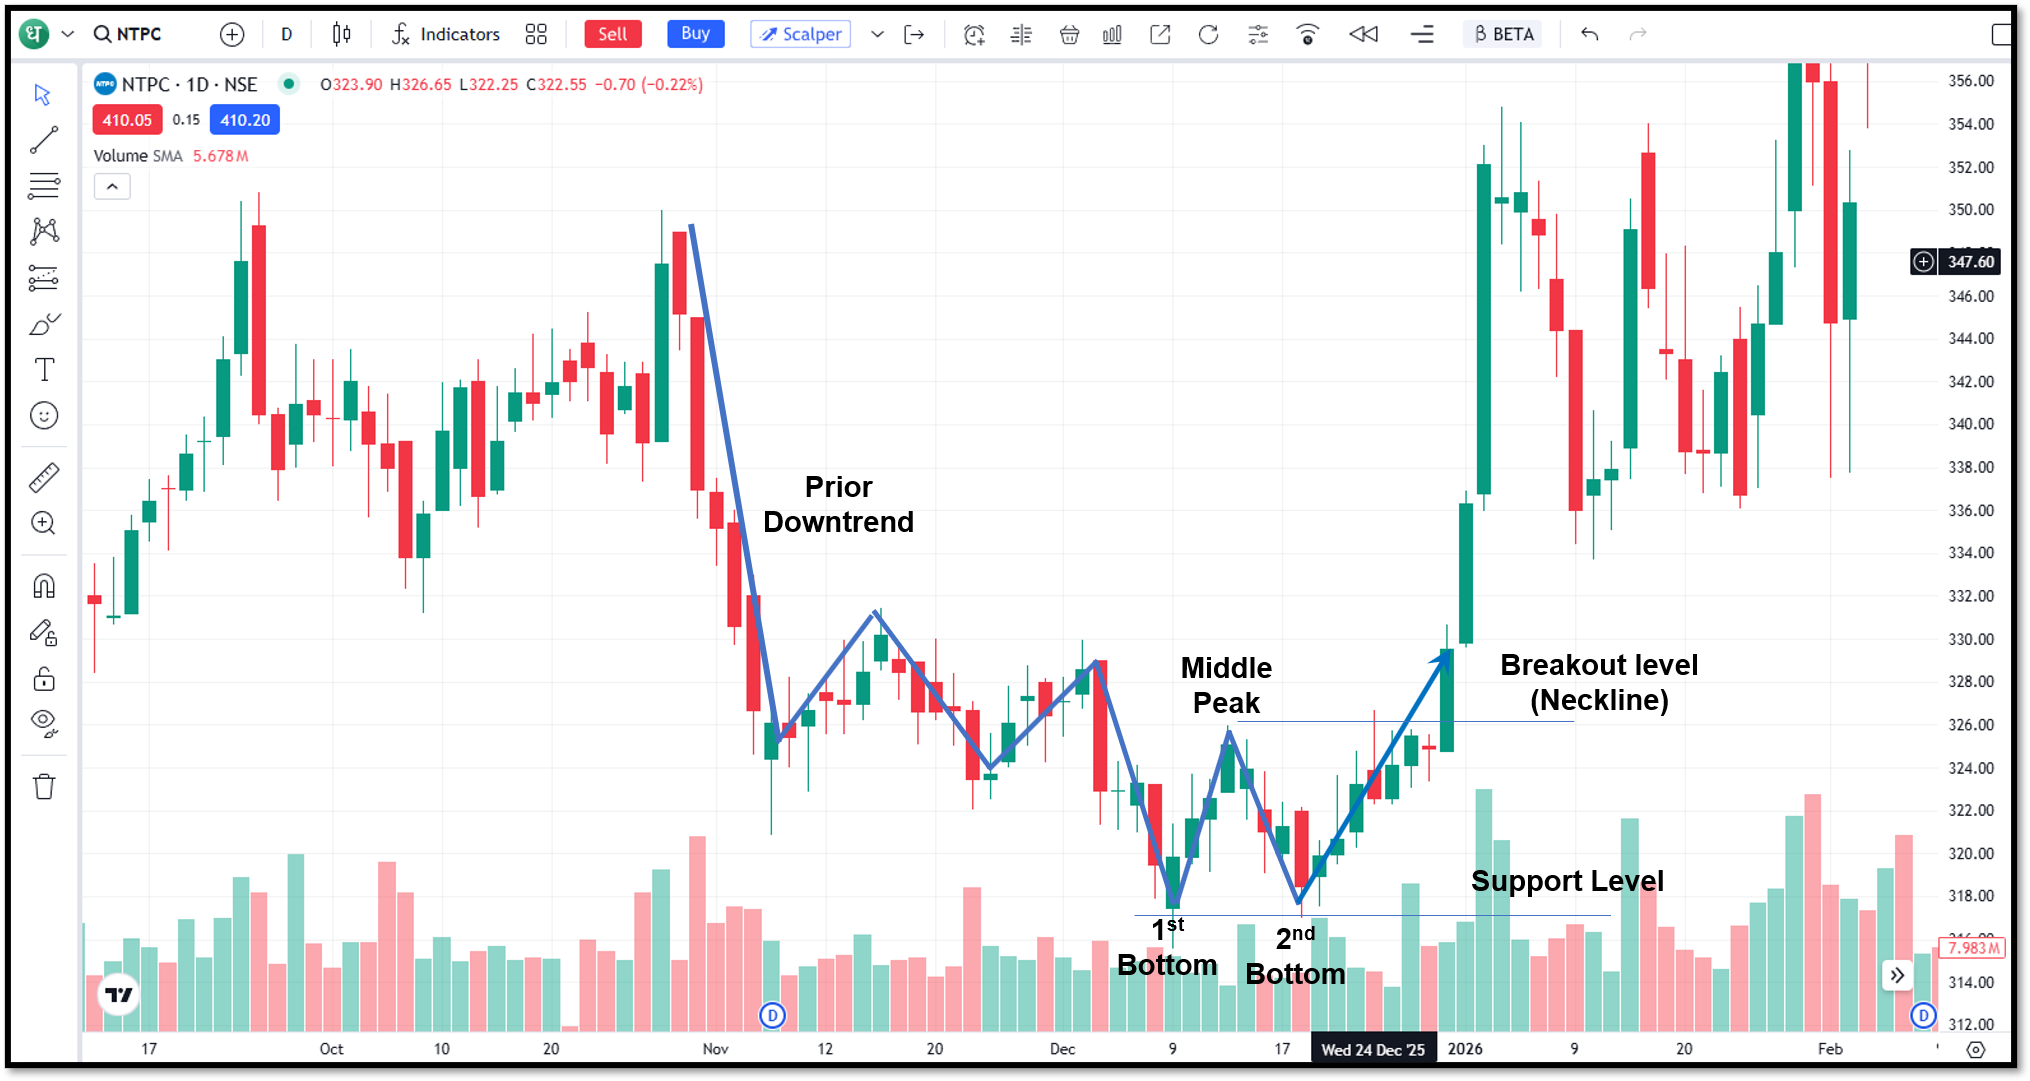
The double bottom pattern is one of the most well-known bullish reversal patterns. It forms after a downtrend and consists of two significant lows occurring near the same price level. Between these lows, the market experiences a temporary rally.
The pattern is confirmed when the price breaks above the resistance level created between the two bottoms.
The psychology behind the pattern is that sellers attempt to push prices lower twice but fail to break support. This repeated failure indicates that bearish momentum is weakening.
Triple Bottom Pattern
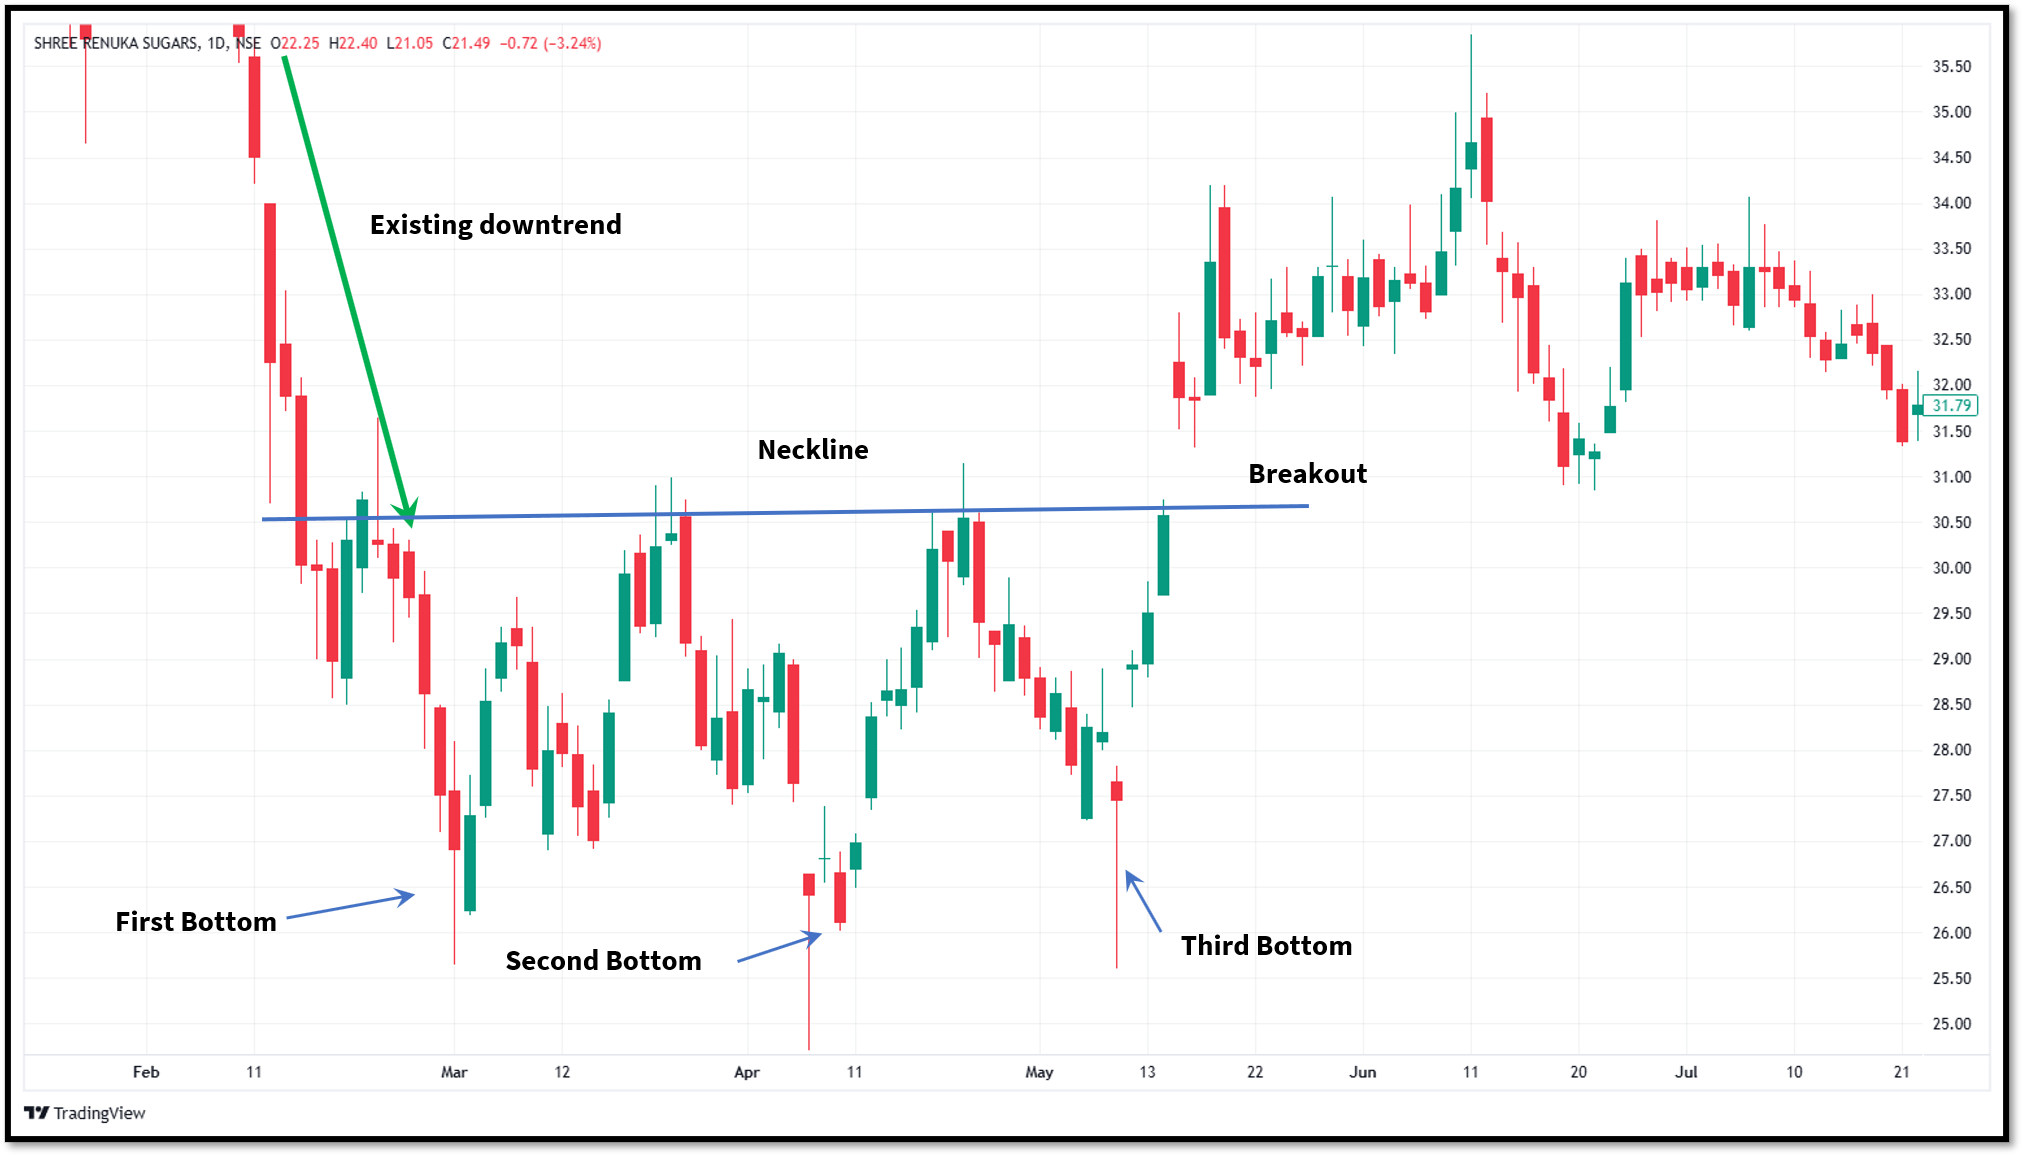
The triple bottom pattern is similar to the double bottom but involves three tests of the same support area. Each unsuccessful attempt to break lower, strengthens the importance of the support level.
When the market finally breaks above resistance, traders interpret it as a stronger bullish signal because buyers have defended support multiple times.
Although the pattern usually takes longer to develop than a double bottom, many traders view the additional confirmation positively.
Ascending Triangle Pattern
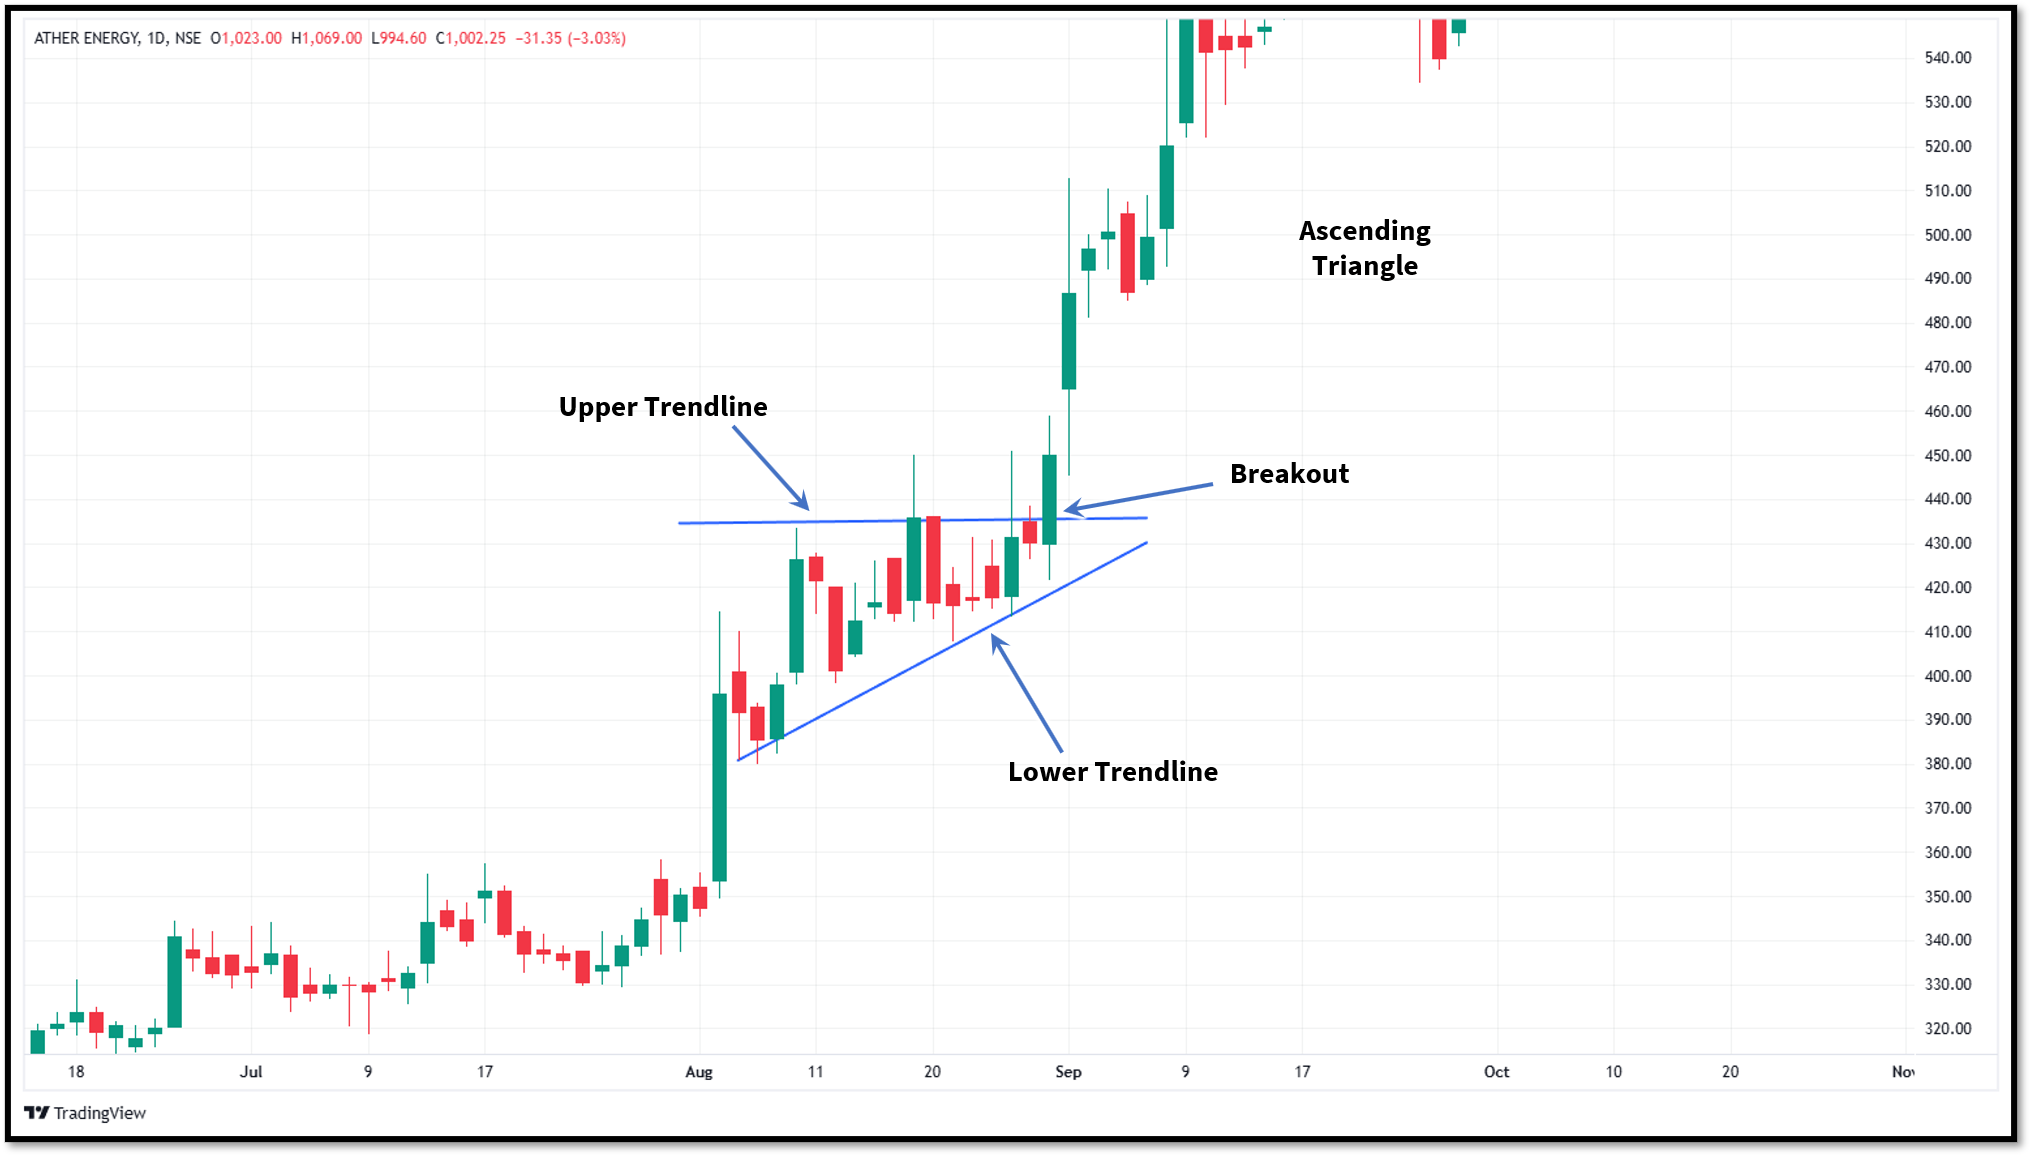
The ascending triangle pattern is a bullish continuation pattern that appears during an uptrend. The pattern consists of:
- A horizontal resistance line
- A rising support trendline
- Multiple higher lows
The price continues to compress near resistance as buyers become more active. At a certain point, the demand may become strong enough to break through the resistance level. Once the price closes above the resistance level, then the pattern is confirmed.
The ascending triangle indicates gradually increasing buying pressure and growing confidence among market participants.
Cup and Handle Pattern
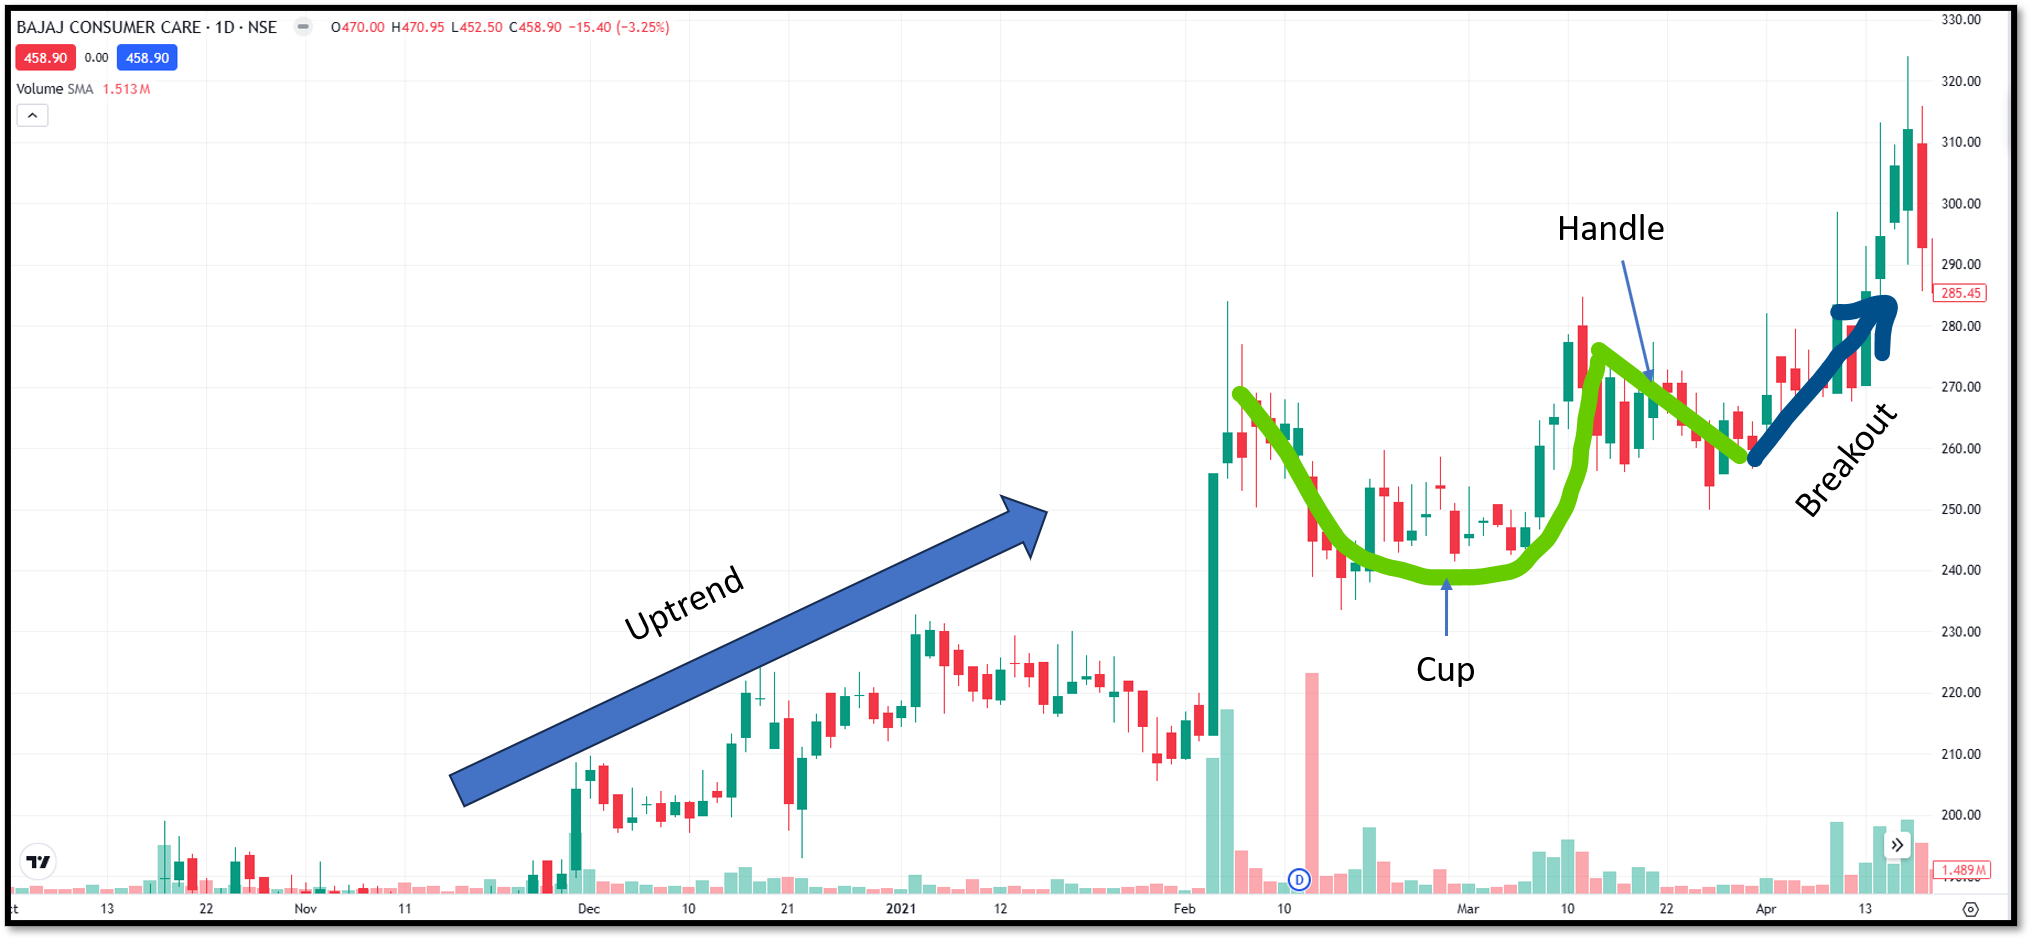
The cup and handle pattern is another trusted bullish pattern that forms over a relatively longer duration. The pattern is a bullish continuation pattern that forms a rounding bottom shape, the ‘cup’, after a strong rally. This gradual decline and recovery show that the market is consolidating. After reaching the previous high, the market again enters a short consolidation period, forming the handle.
A breakout above the handle resistance confirms the pattern. The cup and handle suggests that buyers have absorbed selling pressure and are preparing for another upward move.
Because the formation develops over an extended period, many traders consider it a relatively strong bullish setup.
Inverse Head and Shoulders Pattern
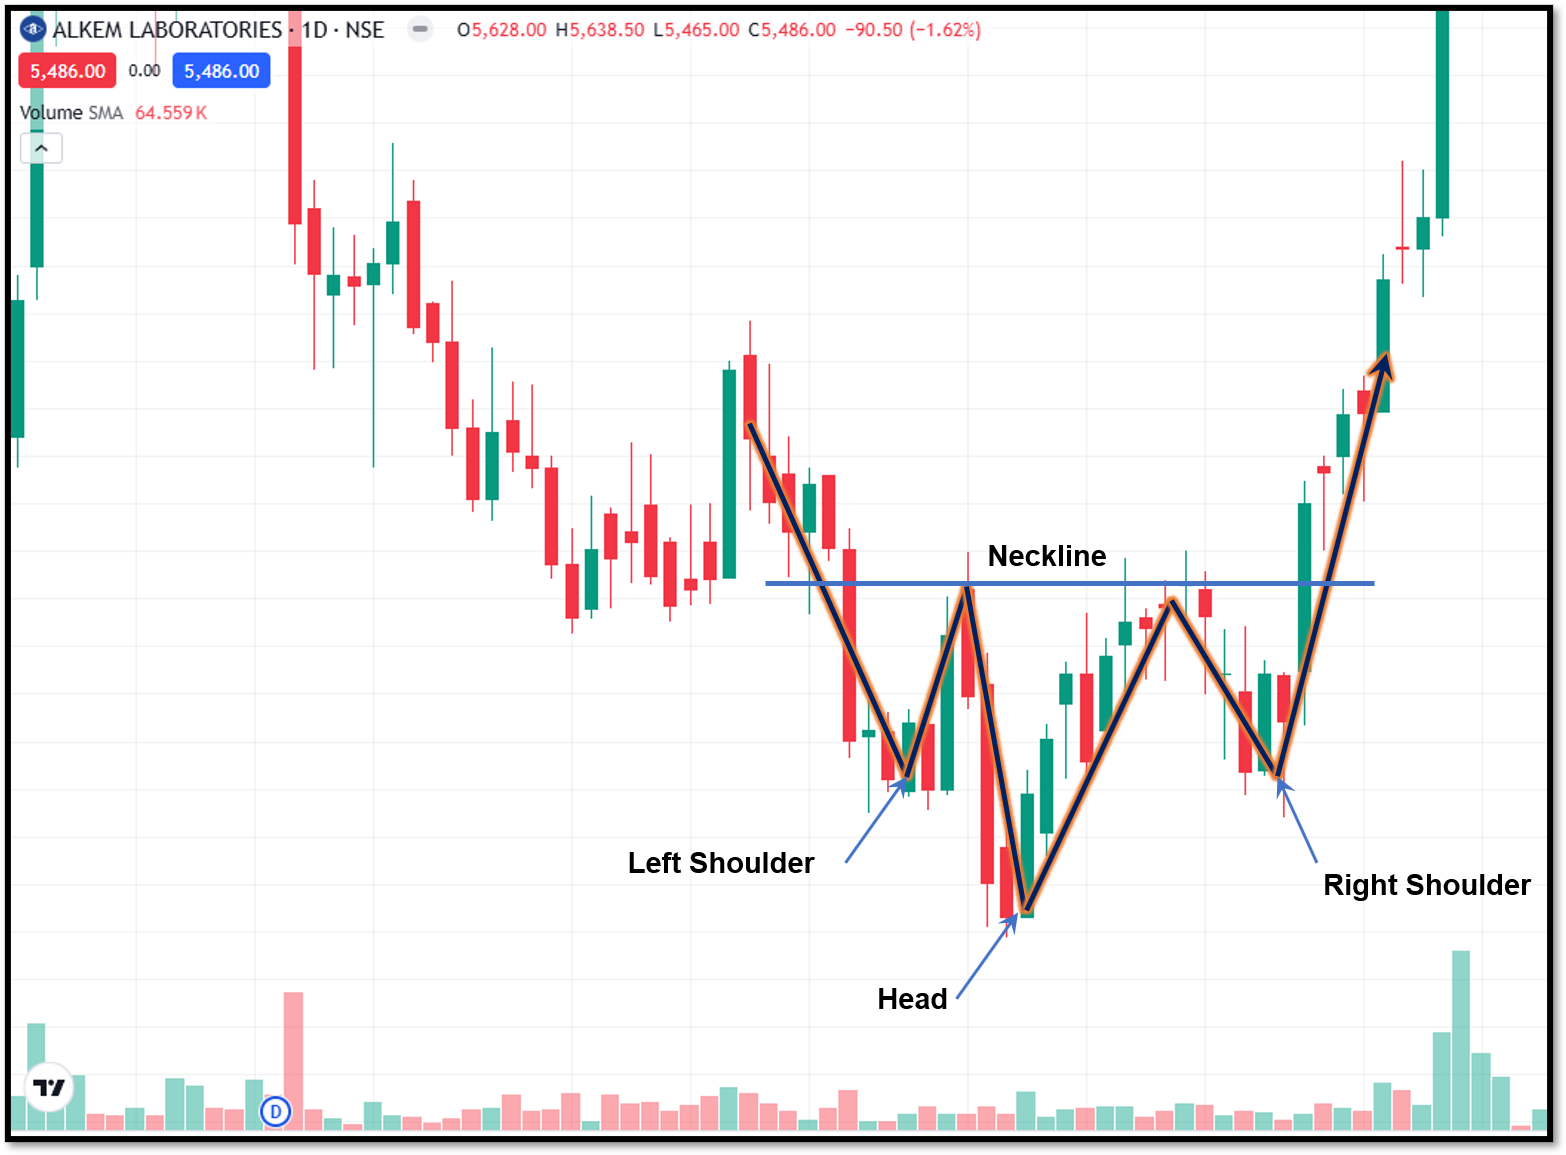
The inverse head and shoulders is a bullish reversal pattern. Its structure consists of:
- A left shoulder
- A lower low known as the head
- A right shoulder
The neckline is a resistance level formed by the highs in between these lows. When the price validates itself, the pattern is confirmed. The pattern is often used to spot significant trend reversals and shows a slow transition from seller dominance to buying power.
Bull Flag Pattern
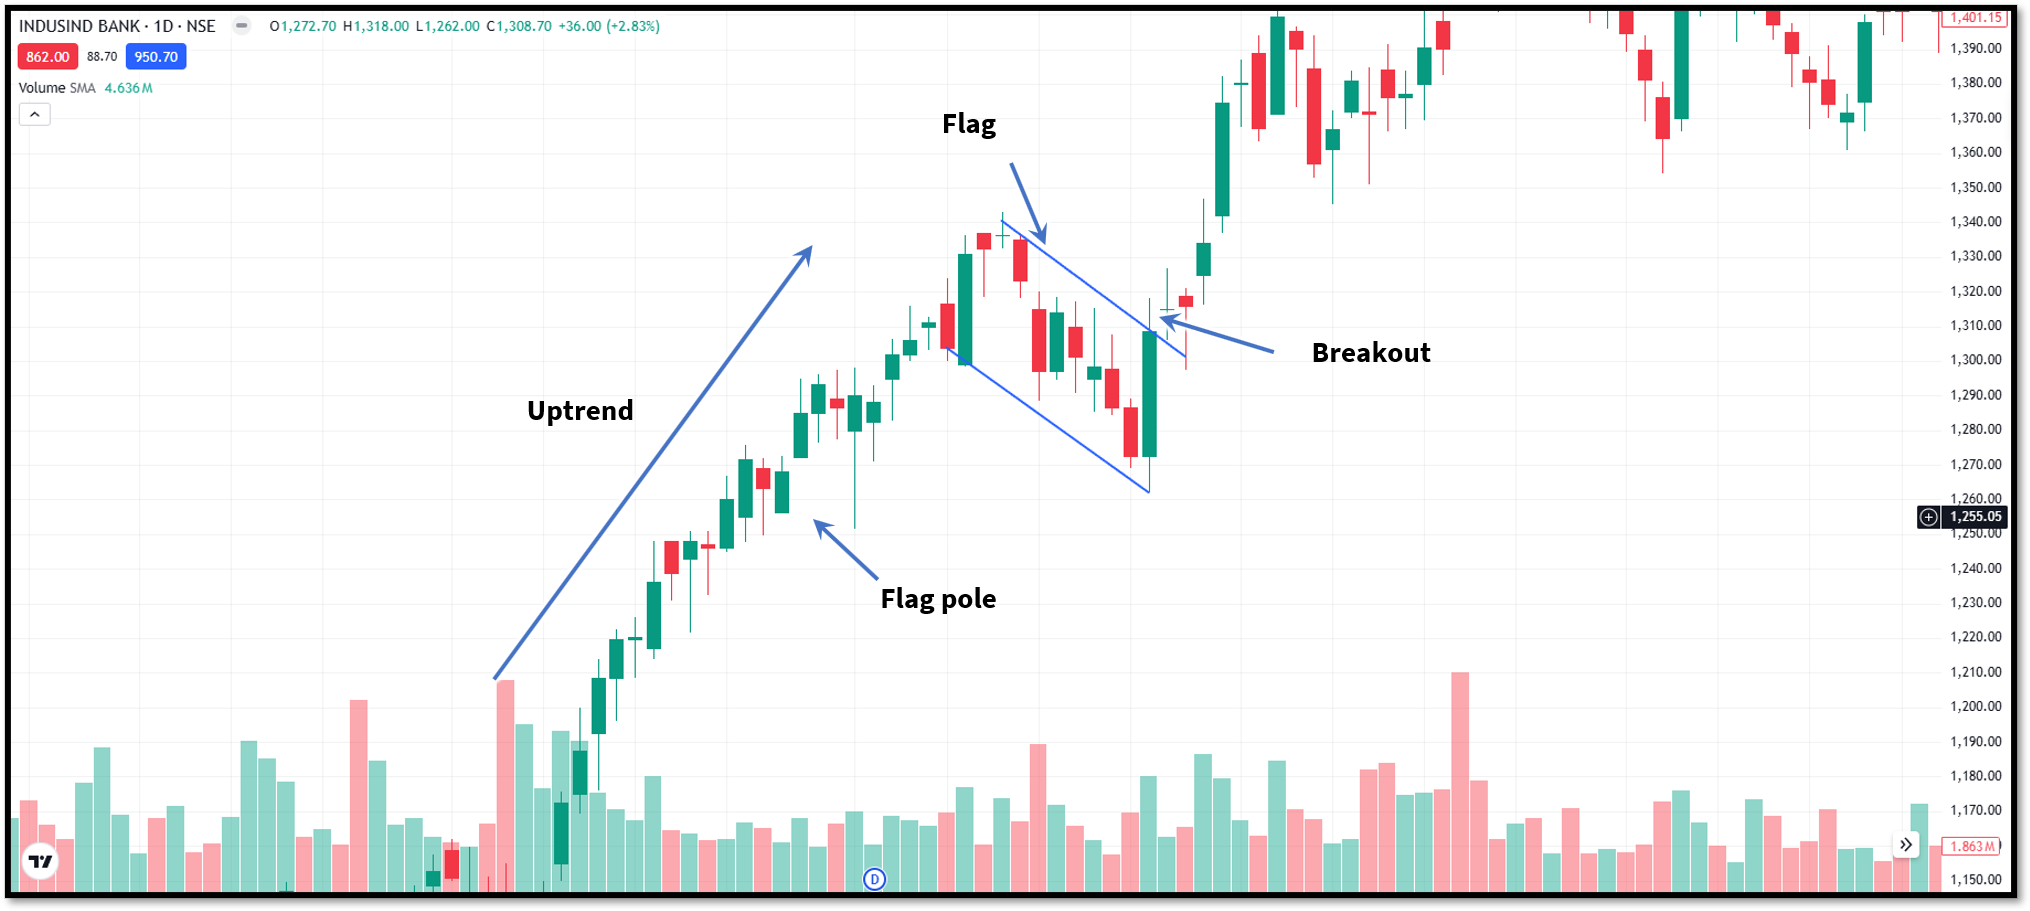
The bull flag pattern is a continuation pattern which forms after a strong uptrend. After a strong rally, the market starts to consolidate with prices moving slightly lower or sideways in a narrow channel after an initial rally.
This pause allows the market to absorb gains before continuing its rally upward. A breakout above the flag signals the continuation of the original uptrend.
Importance of volume in Bullish Patterns
Volume plays a crucial role in confirming chart patterns. During the formation stage, volume may decline as the market consolidates.
However, many traders look for an increase in volume during the breakout. Higher participation suggests stronger conviction behind the move and improves confidence in the signal.
A breakout occurring on weak volume may be more susceptible to failure.
How traders use Bullish Chart Patterns
Most traders avoid entering trades simply because a pattern appears on the chart. They typically wait for confirmation. Confirmation may include any of the following:
- A breakout above resistance
- Increased volume
- Positive momentum indicators
- Strong bullish price action
Once the pattern is confirmed, traders place the stop-loss by analysing the pattern structure. They can also determine the profit targets. This creates a more disciplined and systematic trading process.
Advantages of Bullish Chart Patterns
The advantages of the bullish chart patterns are as follows:
- Bullish chart patterns help traders identify potential buying opportunities before a significant upward move develops. Traders can get an early signal, and they get time to plan for the trade.
- Most of the bullish patterns provide clear breakout levels. This helps traders to identify the entry, exit and stop-loss levels.
- These patterns generate signals usually before any indicator can identify them. This provides the advantage of early entry.
- The bullish chart patterns are useful in various types of markets, including stocks, commodities, etc.
- They work well alongside other technical analysis tools such as RSI, moving averages, MACD, and volume analysis. Combining multiple forms of analysis can help improve confidence in trading decisions.
- Many bullish chart patterns are relatively easy to recognise once traders understand their structure. This makes them accessible to beginners while still being useful for experienced traders.
Limitations of Bullish Chart Patterns
Although the bullish chart patterns offer advantages, they have some limitations as well.
- No bullish chart pattern guarantees a successful trade. Even well-formed patterns can fail if market sentiment changes unexpectedly or if the breakout lacks sufficient buying interest.
- Different traders may draw trendlines or interpret chart structures differently, which leads to different conclusions for the same pattern.
- False breakouts are common in financial markets. Prices may briefly move above a resistance level and then reverse, causing traders to enter positions based on misleading signals.
- Bullish chart patterns often require confirmation before they become reliable. Waiting for confirmation can sometimes result in entering the trade at a less favourable price.
- External factors such as economic announcements, earnings reports, or geopolitical events can quickly invalidate technical setups. Even strong-looking patterns may fail due to unexpected news.
Conclusion
Bullish chart patterns are among the most trusted patterns that every professional trader looks for. The pattern helps traders to spot the buying opportunities before the indicators trigger. These patterns provide unique insights into the market behaviour.
Although these formations can offer valuable information about potential price movement, you can not solely rely on them. Sometimes they may generate false breakouts. They are most effective when combined with confirmation signals, volume analysis, and sound risk management.
FAQs
What are bullish chart patterns?
Bullish chart patterns are price patterns that indicate a possible upward move in price. They suggest buying pressure may be stronger than selling pressure, and the price will move up.
Are bullish chart patterns suitable for beginners?
Yes. Many bullish patterns are relatively easy to identify and can help beginners understand market psychology and trend development.
Can bullish chart patterns be used in intraday trading?
Yes. These patterns can appear on intraday, daily, weekly, and even monthly charts. However, lower timeframes may produce more false signals.
What is the difference between a bullish continuation pattern and a bullish reversal pattern?
A bullish reversal pattern signals a possible shift from a downward to an upward trend, while a bullish continuation pattern suggests that an existing uptrend may continue after a temporary pause.
How do traders set targets using bullish chart patterns?
Many traders measure the height of the pattern and project that distance from the breakout point to estimate a potential price target.







