



Bearish Harami Cross








Key takeaways
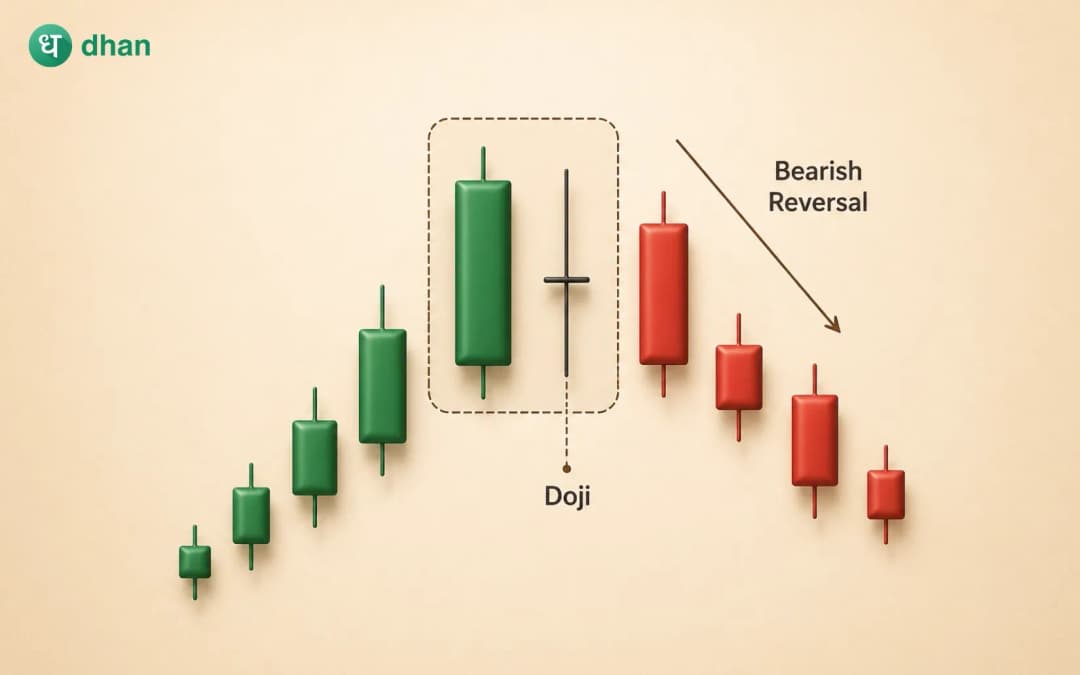
- The bearish harami cross is a two-candlestick reversal pattern that may indicate weakening buying momentum after an uptrend.
- The pattern becomes more reliable when it appears near a resistance level and is confirmed by the following bearish candle.
- Like any candlestick pattern, the bearish harami cross should be combined with volume, technical indicators, and overall market structure before making trading decisions.
Identifying when a trend is losing strength is one of the biggest challenges traders face. Many stocks continue climbing despite appearing overbought, while others reverse suddenly with little warning. This is where candlestick patterns become valuable. Rather than predicting the future, they provide clues about changing market sentiment.
A bearish harami cross is one such pattern that signals to traders that market sentiment is changing and there is a possibility of reversal. Although the pattern does not guarantee a price decline, it signals traders to look more closely for additional evidence before entering short trades or booking profits from long positions.
For beginner traders, the bearish harami cross is relatively easy to identify because it consists of just two candlesticks. However, understanding why it forms, when it works best, and how to confirm it is far more important than simply recognising its shape.
What is a Bearish Harami Cross?
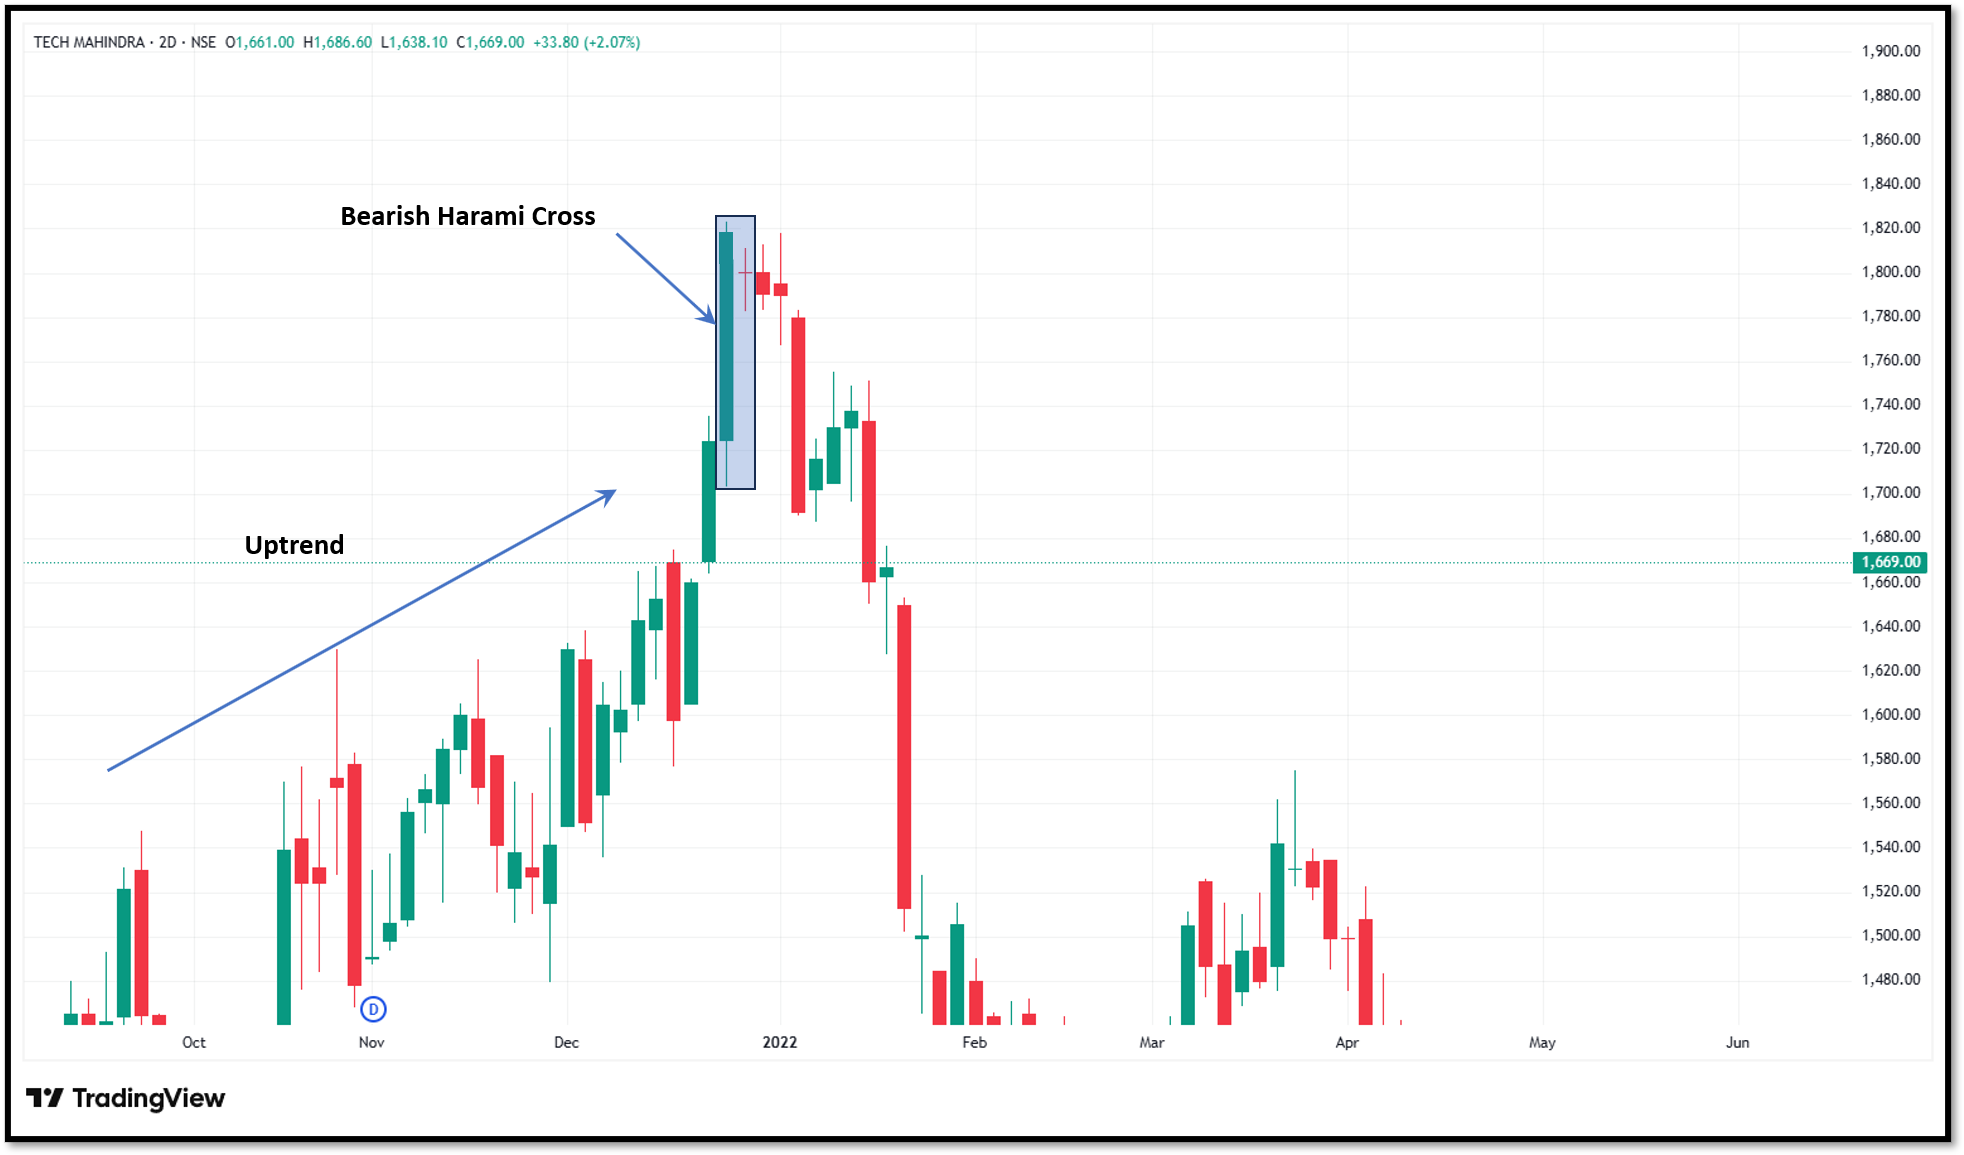
A bearish harami cross is a two-candlestick bearish reversal pattern that usually appears after an established uptrend.
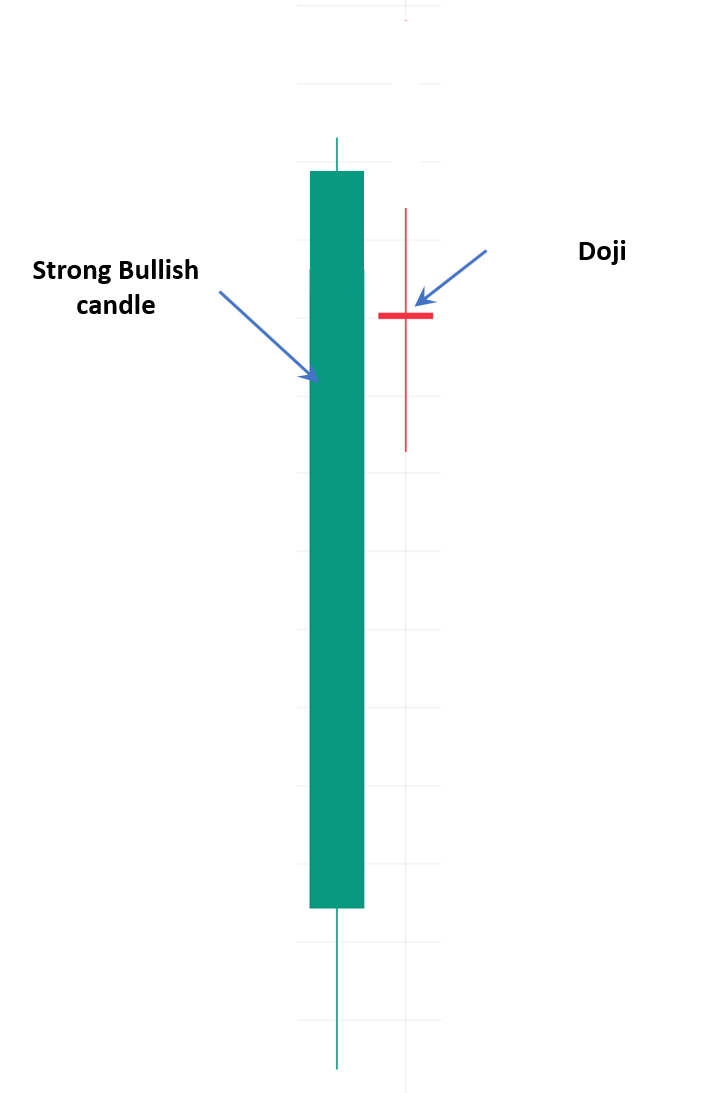
The first candle is a long bullish candle, showing strong buying pressure. The second candle is a Doji, which opens and closes at nearly the same price. Importantly, the entire Doji should remain within the body of the previous bullish candle.
The word Harami comes from a Japanese term meaning "pregnant." In this pattern, the large bullish candle represents the "mother," while the small Doji inside it represents the "baby." The appearance of a Doji instead of a regular small candle makes the pattern a Harami Cross, indicating stronger market indecision.
How does the Bearish Harami Cross form?
The pattern develops in two stages. Before the first candle forms, the market is in a clear uptrend, and buyers remain in control.
The pattern starts with a long bullish candle, reflecting strong buying interest and continued upward momentum.
The next trading session forms a Doji that stays completely inside the body of the previous bullish candle. Since the Doji has almost identical opening and closing prices, it signals indecision between buyers and sellers.
Although buyers are still present, they can no longer push prices significantly higher. Sellers begin matching buying pressure, creating uncertainty about whether the uptrend can continue.
What does the Bearish Harami Cross indicate?
The bearish harami cross reflects a shift in market psychology. During the first candle, buyers dominate the market and push prices higher. This shows that the existing uptrend is likely to continue. This attracts additional buyers.
Despite the previous strength, the market struggles to move decisively in either direction. The Doji reveals that buying enthusiasm has weakened, while sellers have become more active.
This balance between buyers and sellers indicates that upward momentum may be fading. If sellers are able to take control in the next session, the odds of a bearish reversal are higher.
How to trade using the Bearish Harami Cross
Every trader follows a slightly different approach. You may follow the following structured process, which can improve consistency.
Confirm the existing uptrend
The bearish harami cross carries greater significance only after a noticeable upward move. If the market has been moving sideways, the pattern generally loses much of its predictive value.
Wait for confirmation
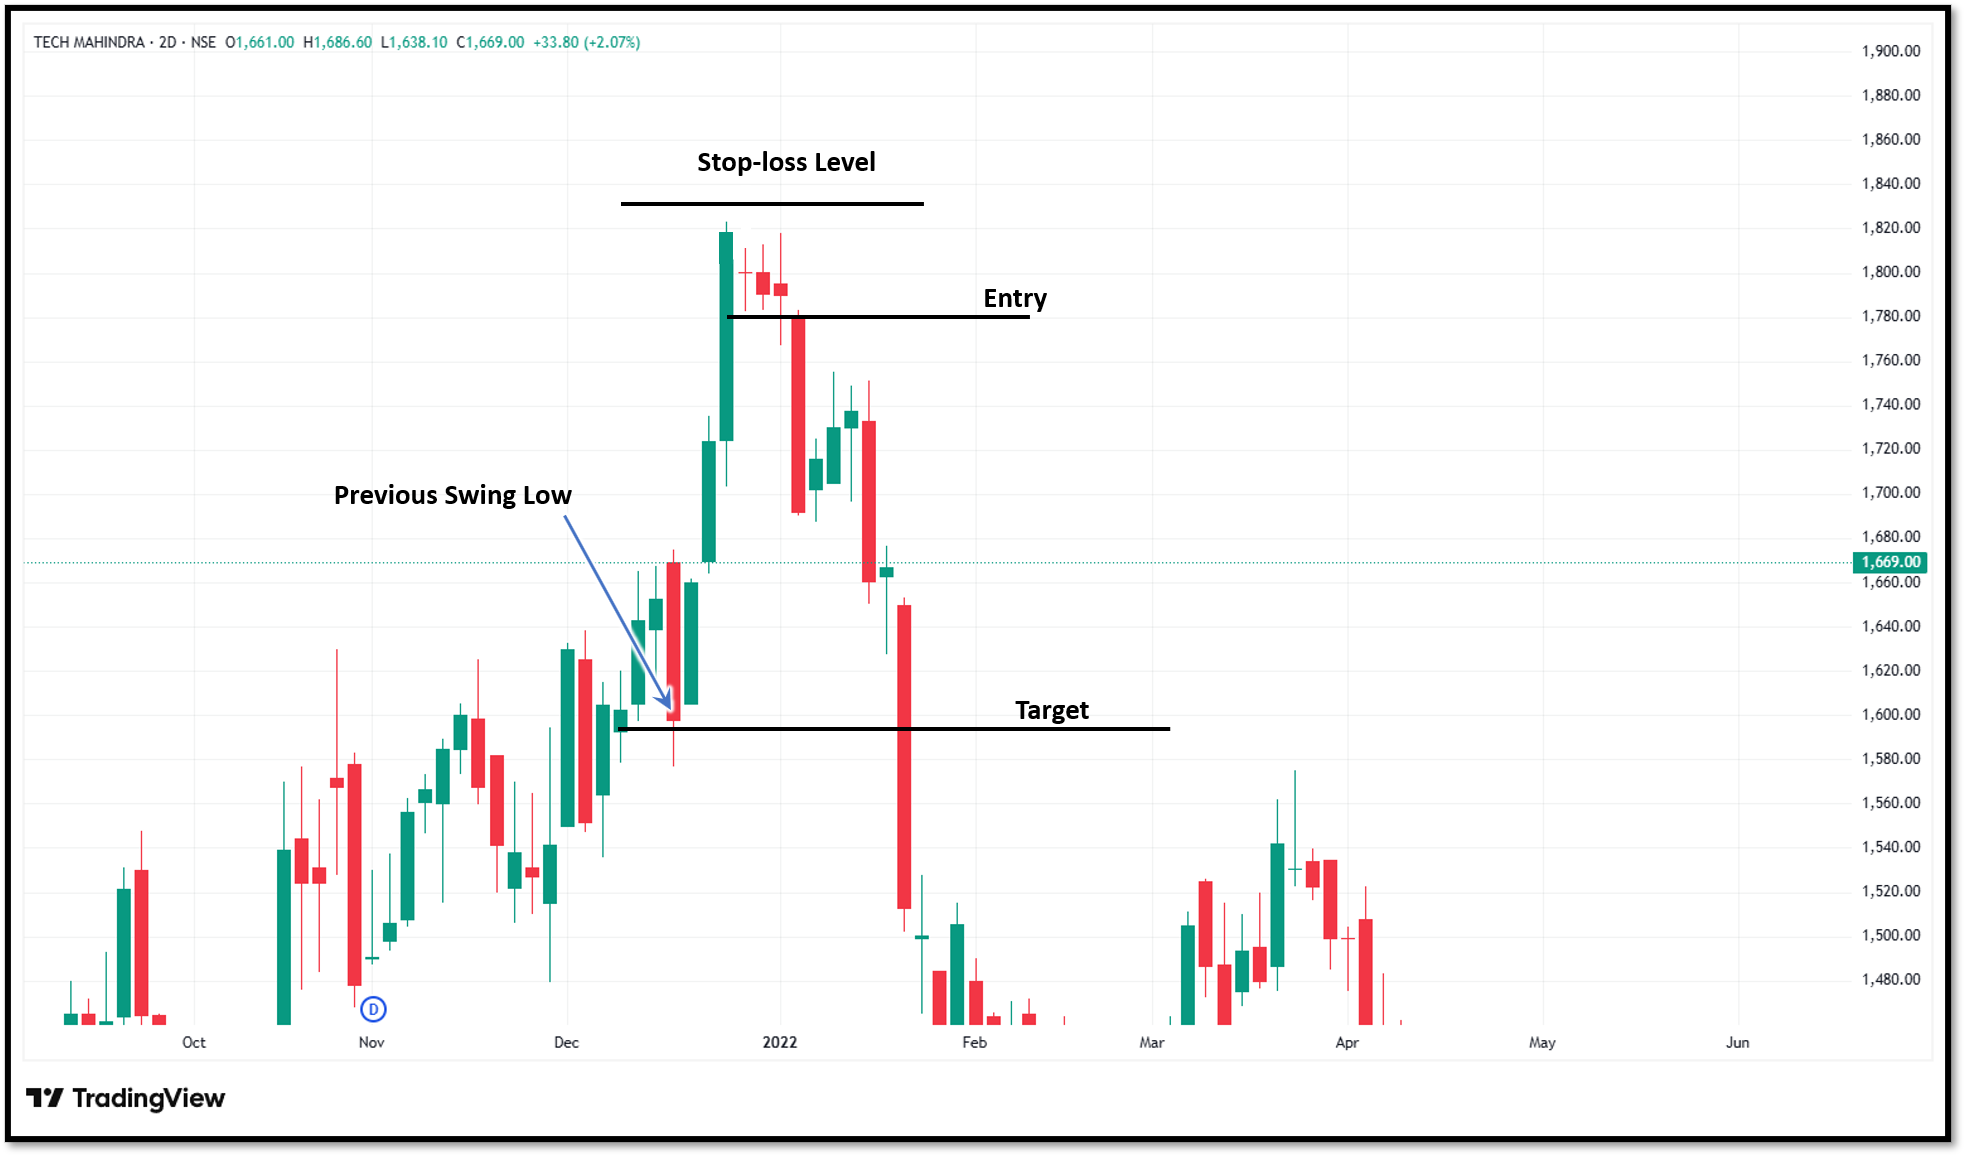
Many traders enter immediately after the formation of Doji. But this increases the risk; hence, wait for the next candle to close lower. This confirms that sellers have actually taken control instead of reacting to temporary market hesitation.
Entry
Some traders enter after the confirmation candle closes, while others wait for a slight pullback to obtain a better entry price.
Stop-loss
A common approach is placing the stop-loss slightly above the high of the bearish harami cross. If the market moves above this level, the bearish setup becomes weaker.
Profit target
You may use one of the following methods to set the target:
- Previous support levels
- Swing lows
- Fibonacci retracement levels
- Risk-reward ratios such as 1:2 or 1:3
Bearish Harami Cross vs Bearish Harami
Although the name of both patterns looks similar, there is one important difference.
Advantages of Bearish Harami Cross
The bearish harami cross pattern has the following advantages:
- The pattern is relatively easy to identify as it consists of only two candles and forms at the end of an uptrend. This makes the pattern relatively easy for beginners to trade.
- The pattern acts as an early warning sign for traders who are in long positions. Many traders usually review their positions before market sentiment changes significantly.
- The bearish harami cross appears in multiple markets like stocks, indices, commodities, forex, and cryptocurrencies. Hence, it can be applied to different trading instruments.
- The bearish harami cross can be even more useful if combined with trendlines, RSI, MACD, moving averages and support-resistance analysis. Combining several signals makes the pattern more reliable.
Limitations of the Bearish Harami Cross
Along with advantages, the pattern has certain limitations as well. These are described as follows:
- Although the pattern provides a strong signal for reversal, it is not guaranteed. It always needs confirmation.
- The pattern may produce misleading signals during strong trends: Powerful bullish markets sometimes continue higher despite forming bearish harami cross patterns.
- The bearish harami cross pattern works well in trending markets, but in sideways or choppy markets it produces many false signals.
Common mistakes traders should avoid
Several common errors reduce the effectiveness of the bearish harami cross.
One of the biggest mistakes is trading the pattern without confirming that a clear uptrend already exists. Without an established trend, the reversal signal becomes much less meaningful.
Entering immediately after the Doji forms is also a common mistake, usually seen with beginners. Without confirmation from the next candle, entering the trade can be riskier.
Some traders also ignore nearby support levels. If strong support sits directly below the pattern, there may be limited downside despite the bearish signal.
Wrapping up
The bearish harami cross is a bearish reversal pattern that signals a possible reversal. The pattern consists of a strong bullish candle followed by a Doji. The Doji must be contained within the body of the first candle. The pattern suggests that buyers may be losing confidence after an extended uptrend.
But the formation is not a standalone sell signal; traders need to remember. It is important to await confirmation before entering the trade. In addition, to make the pattern more reliable, you should look at nearby resistance levels, volume, and other indicators.
FAQs
What is the difference between a bearish harami and a bearish harami cross?
The second candle is what makes the difference. A bearish harami has a second candle that is small-bodied, while a bearish harami cross uses a Doji.
Can beginners use the bearish harami cross?
Yes. Since it consists of only two candlesticks, beginners can identify it fairly easily. However, they should always confirm the pattern using additional technical tools instead of relying on it alone.
Which indicators work best with the bearish harami cross?
RSI, MACD, moving averages, volume analysis, and support-resistance levels are commonly used indicators along with the bearish harami cross.
Where should traders place a stop-loss when trading this pattern?
A common approach is to place the stop-loss slightly above the high of the bearish harami cross. If the price moves above that level, it may indicate that the bearish setup has failed.
Can the bearish harami cross appear in all financial markets?
Yes. It can be observed in stocks, commodities, forex, cryptocurrencies, and indices, as it reflects changes in buyer and seller sentiment.







