Candlestick Patterns for Beginners








Key takeaways
- Candlestick patterns are formations on a price chart that help first-time traders to understand market sentiment. It helps them identify if a trend is likely to reverse or continue.
- Each candlestick pattern represents four price points, which include the opening, closing, highest and lowest prices. They together provide essential insights into market movements.
- Candlestick patterns are of two types: bullish and bearish. A bullish pattern indicates a possible uptrend, while a bearish pattern suggests a potential downtrend.
- Beginners must always use these patterns along with other technical indicators and market analysis for managing risks and preventing losses.
- Beginners can use candlestick patterns across various financial markets, including stock, forex, and commodities.
Markets are volatile, making it essential for traders to understand market movements. Every trader wants to understand where the market could move next. While chart patterns cannot predict future prices with complete accuracy, they can certainly provide important clues about market sentiment. This is where candlestick patterns become important.
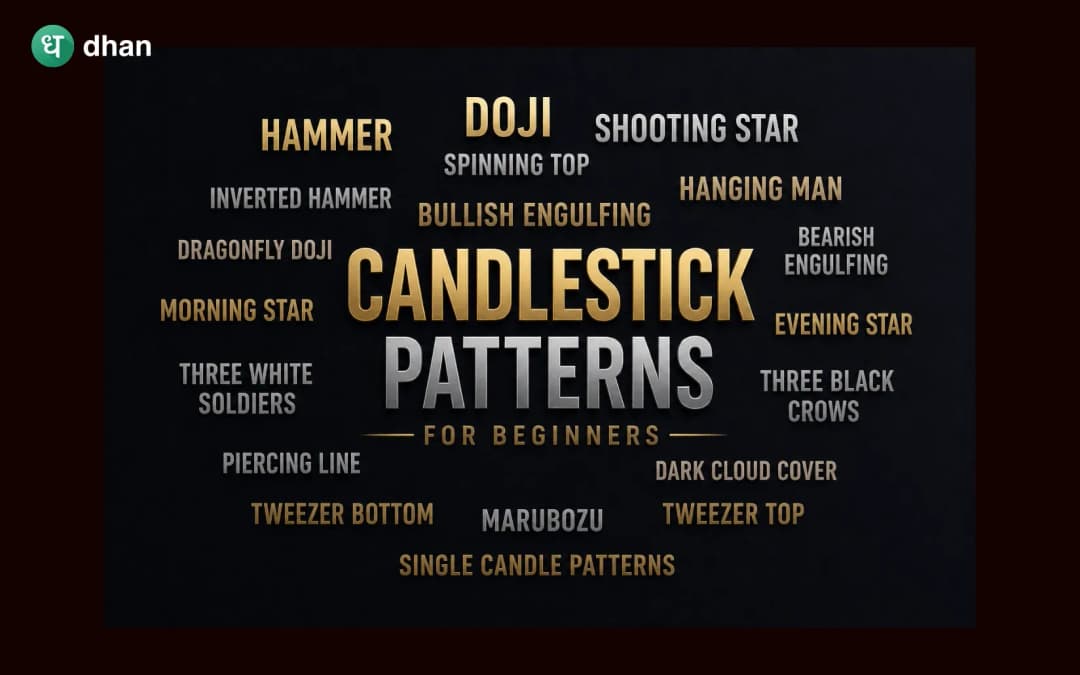
Candlestick patterns are among the most commonly used tools for technical analysis. Traders utilise them to understand market sentiment, analyse buyers and sellers’ behaviour and track if the trend is likely to move upward, downward or reverse. These candlestick patterns can be used in trading stocks, forex, commodities and cryptocurrencies to make informed decisions.
In this article, we will understand what candlestick patterns are, different types of candlestick patterns, why they are important, how beginners can use them wisely and mistakes they should avoid while trading.
What are Candlestick Patterns?
Candlestick patterns are formations on a price chart that are created by one or more candlesticks. Traders often leverage these patterns to understand how a stock price or any other asset is moving during a specific period and what that movement may indicate about the market.
Each pattern represents four integral price points, including the opening price, closing price, highest price, and lowest price. As these candlesticks form different patterns, they provide clues about the ongoing clash between sellers and buyers. While some patterns indicate that buying pressure is increasing, others may suggest that sellers are gaining control.
While candlestick patterns are useful for understanding market sentiment and price fluctuations, they do not guarantee future price movements. Beginners should use them with other technical indicators and market analysis to make informed decisions for trading.
Different types of Candlestick Patterns
Based on the market direction they indicate, candlestick patterns are divided into two categories. Beginners use these categories to understand market movement and identify whether buyers or sellers are likely to dominate the next price movement.
Bullish candlestick pattern
This pattern usually appears after a downward momentum, indicating that buying interest may be increasing. It suggests that sellers are gradually losing control and that the market may be moving upward. Some of the common bullish candlestick patterns are hammer, bullish engulfing, morning star and tweezers bottom.
Bearish candlestick pattern
This pattern usually appears after an upward momentum, indicating that the selling pressure may be increasing. It suggests that buyers are gradually losing control and that the market may be moving downward. Some of the common bearish candlestick patterns include shooting star, bearish engulfing, evening star and hanging man.
Common bullish Candlestick Patterns
Bullish candlestick patterns generally suggest that the market may be preparing for an uptrend and that buying interest is increasing. Some of the common bullish candlestick patterns to understand include:
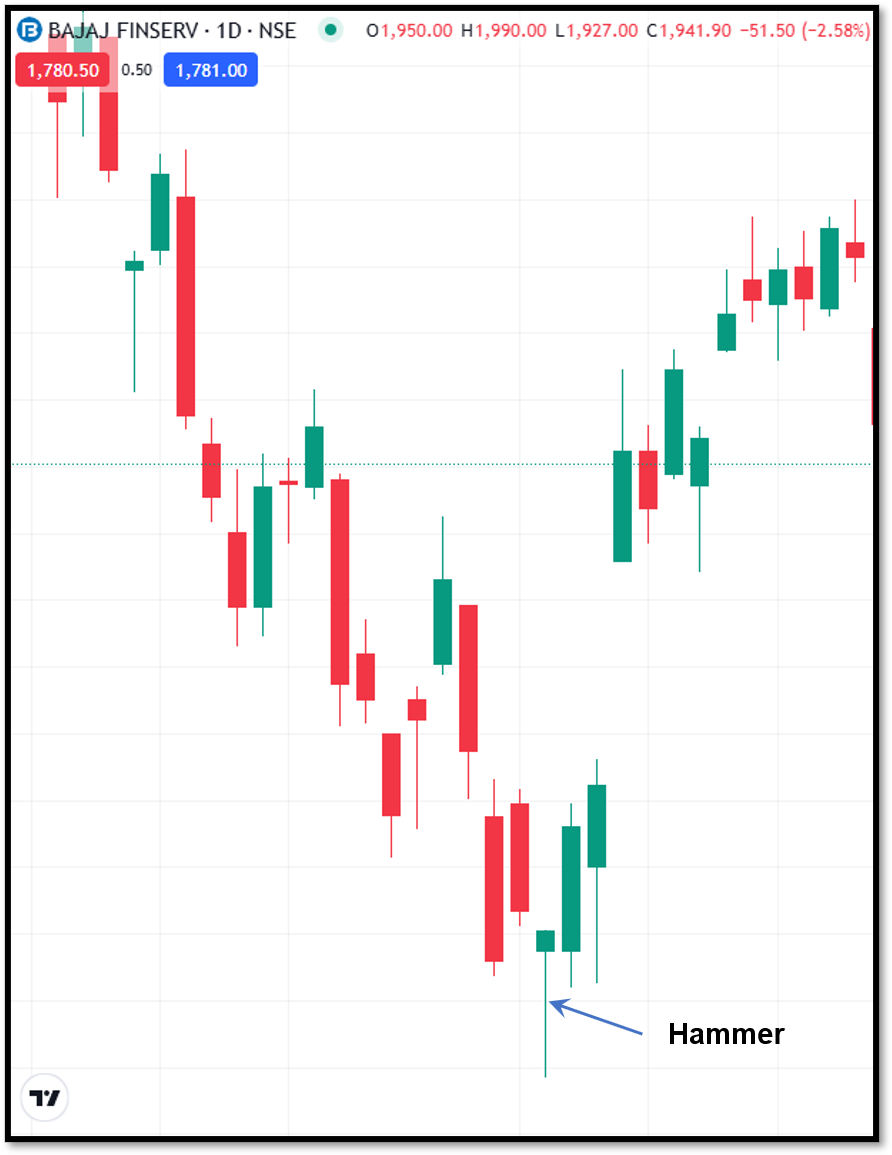
Hammer
Hammer is a single candlestick reversal pattern appears after a downtrend and indicates that buyers are regaining control after strong selling pressure.
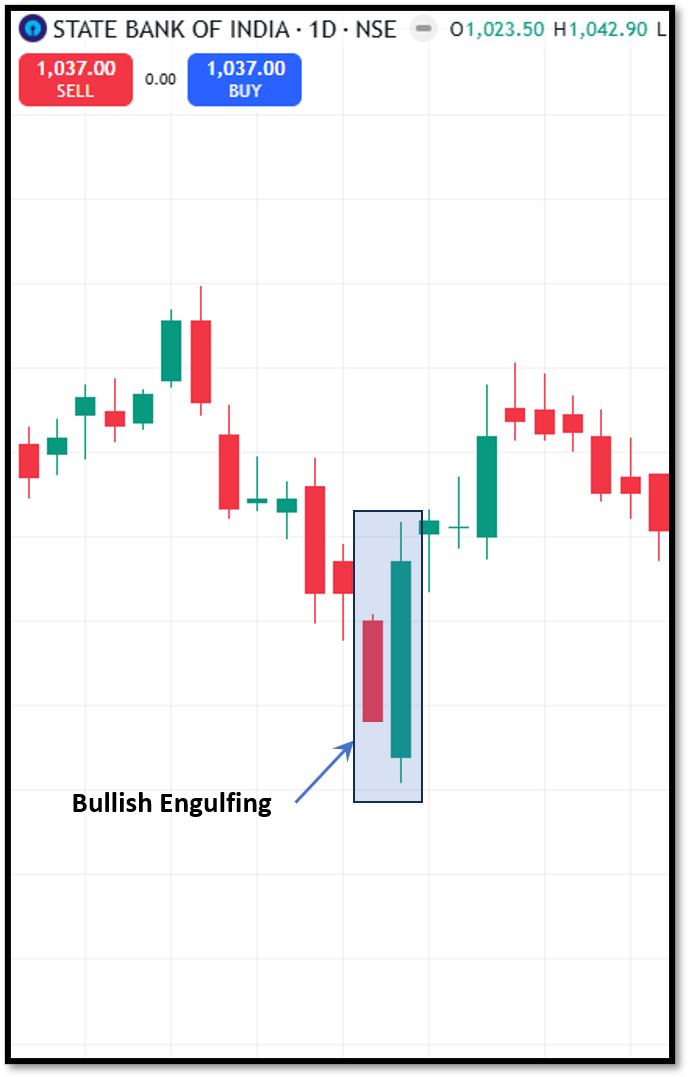
Bullish Engulfing
The pattern appears when a large bullish candle covers a previous bearish candle completely, suggesting possible upward momentum.
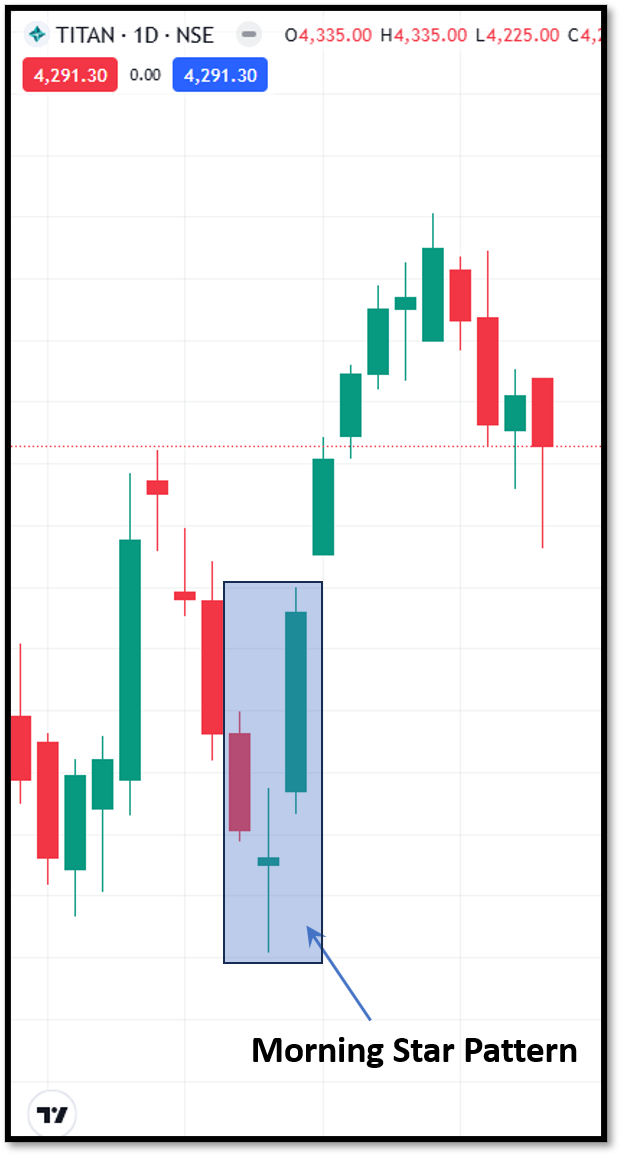
Morning Star
Morning star is an three-candlestick pattern thats suggests the weakening of a downtrend and the beginning of an uptrend.
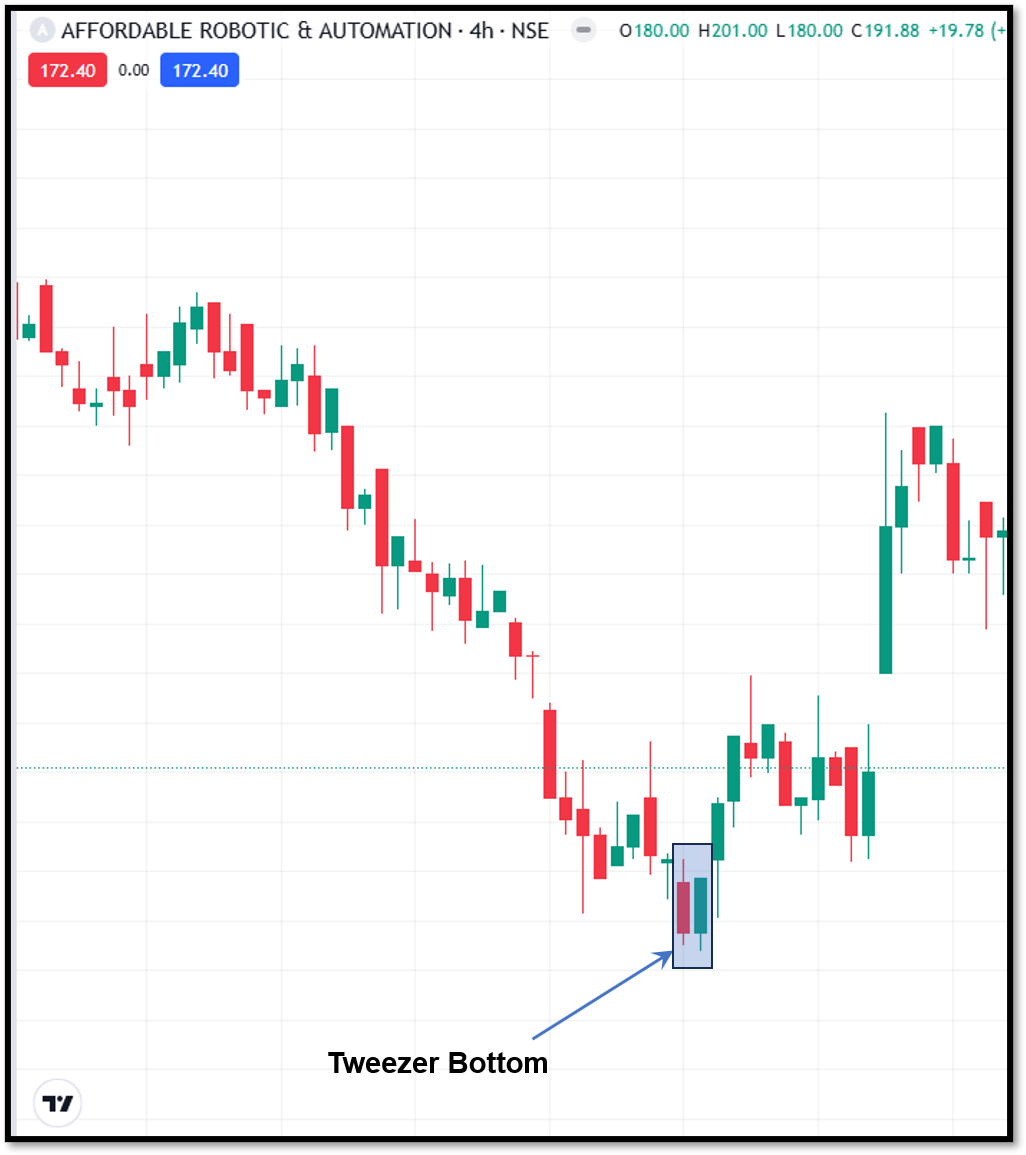
Tweezer bottom
Tweezer bottom pattern is formed when two candlesticks appear consecutively, creating a similar low. It suggests that sellers are struggling to push prices further lower and buyers may be stepping in.
Common Bearish Candlestick Patterns
Bullish candlestick patterns usually suggest that the market may be preparing for a downtrend and that selling pressure may be increasing. Some of the commonly used bearish candlestick patterns include:
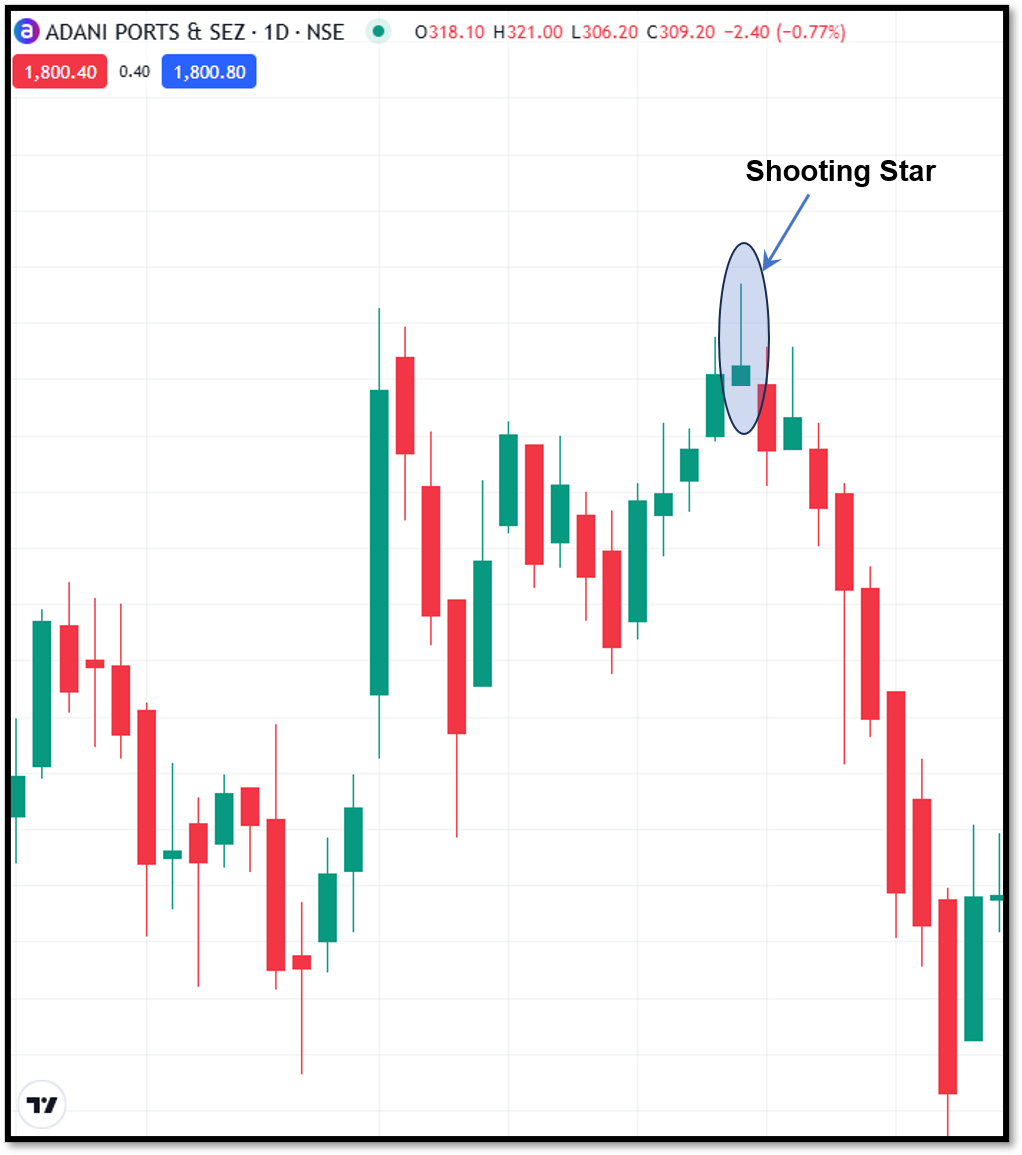
Shooting star
Shooting star is a single candlestick pattern that appears after an uptrend and suggests a potential reversal. It indicates that buyers are losing control while sellers are gaining momentum.
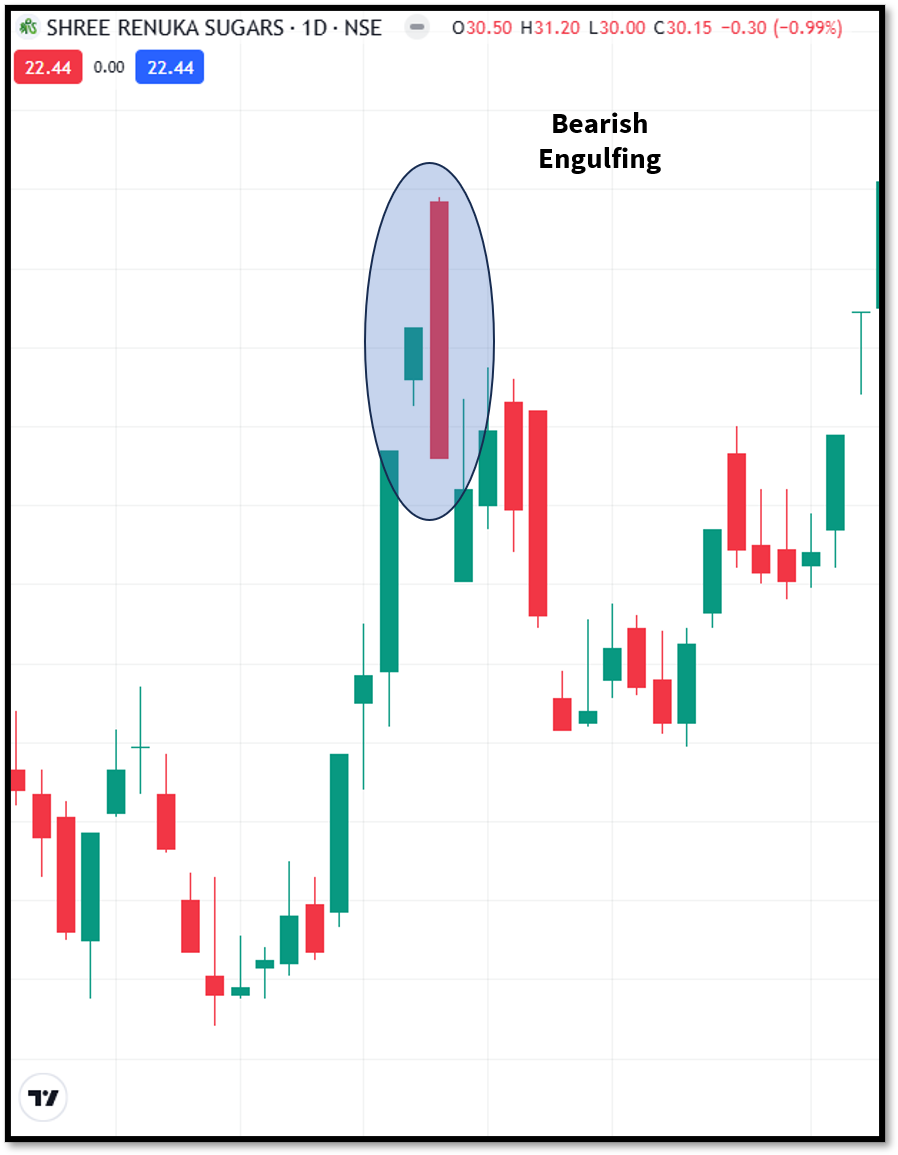
Bearish engulfing
The pattern forms when a large bearish candle covers the previous bullish candle completely, indicating a possible downtrend.
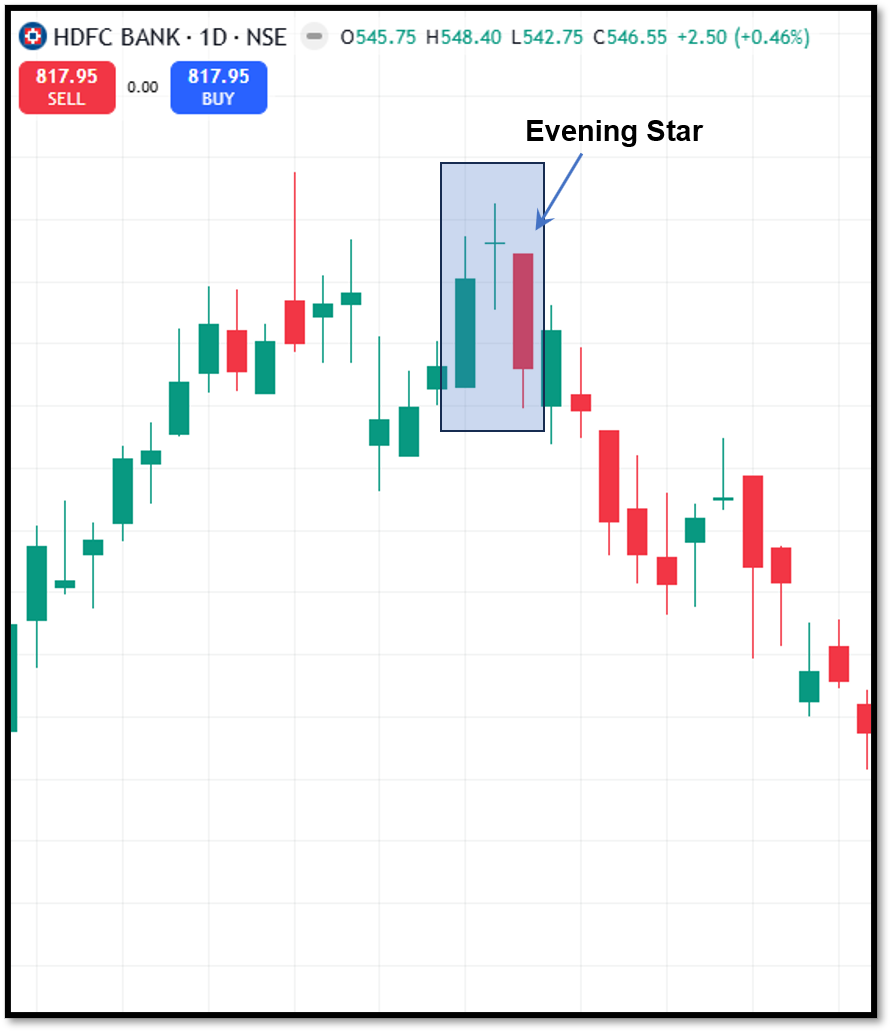
Evening star
The three-candlestick pattern often appears at the end of an uptrend and the beginning of a possible decline.
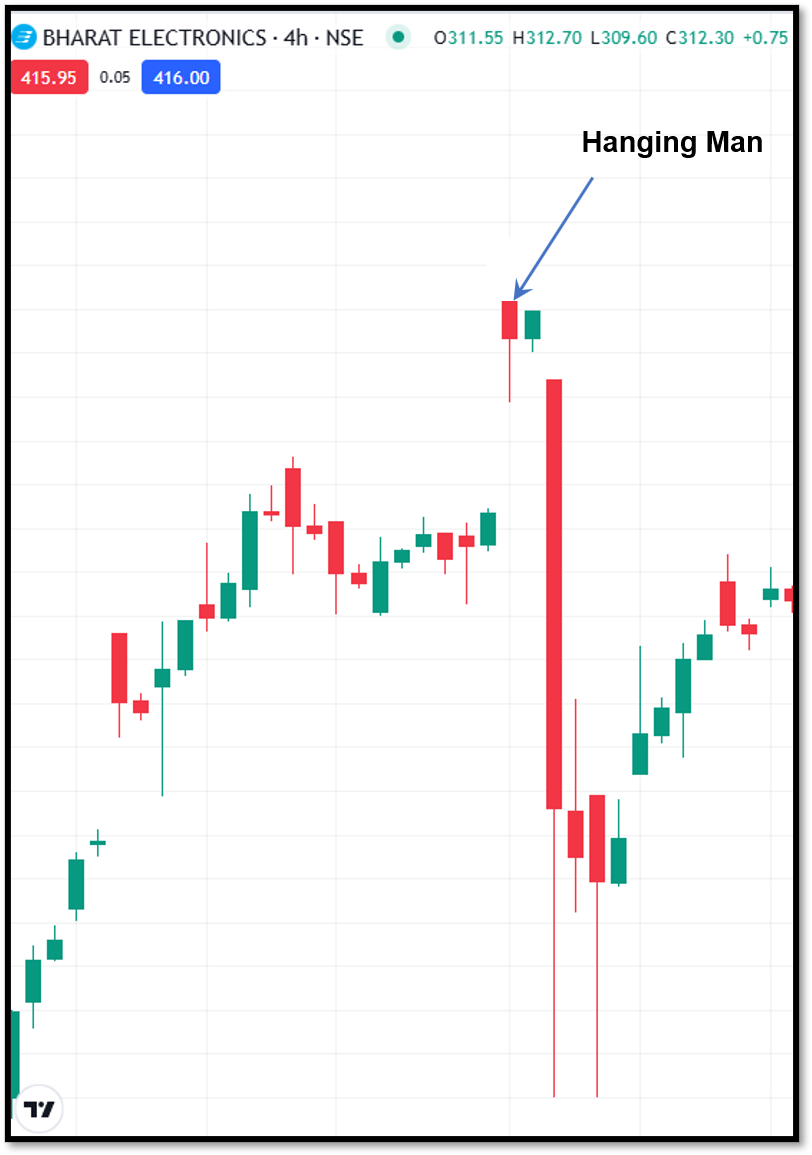
Hanging man
The pattern appears at the top of an uptrend, suggesting that selling pressure is starting to increase. However, a confirmation is required before deciding to trade.
How can beginners use Candlestick Patterns?
Learning candlestick patterns is the first step. Beginners must understand when and how to apply these patterns for an effective outcome. Some of the ways to use candlestick patterns include:
Identify the market trend
Before identifying a candlestick pattern, beginners must focus on understanding if the market is moving upward, downward or sideways. A pattern is highly beneficial when it is viewed in the context of the overall trend.
Look for confirmation
It is important to wait and understand if the expected price movement is actually taking place. Beginners should not enter a trade immediately after spotting a candlestick pattern. Wait for the next candle or breakout for confirmation.
Use other technical indicators
Avoid using candlestick patterns in isolation. Combine them with other technical indicators such as RSI, moving averages and trading volumes for improved reliability and better trading decisions.
Always use a stop-loss
Even seasoned traders use stop loss to prevent losses. As no candlestick pattern can predict future price movements accurately, placing a stop-loss helps to manage risks and limit losses.
Practice before trading in larger amounts
Beginners must spend time observing different candlestick patterns on charts. Understanding how they function and behave, the trends and responses during different market conditions can help improve trading.
Common mistakes beginners should avoid
Candlestick patterns are useful for understanding market movement. Beginners, however, often make mistakes that can affect their trading decisions. Some of these include:
Solely relying on one pattern
Beginners must avoid entering a trade by using only a single candlestick pattern. Combining it with other technical indicators and market analysis is essential for better decision-making.
Trading without confirmation
Beginners should not enter a trade immediately after spotting a pattern. Entering a trade before confirmation can be risky. Looking for a confirmation reduces the chances of false signals.
Ignoring risk management
Every trade is risky. Beginners must be careful, understand the patterns properly, and always use a stop-loss and a proper exit strategy to safeguard losses.
Expecting every pattern to work
Beginners should understand that false signals are a part of trading. No candlestick pattern can guarantee future price movements, and traders must avoid depending on one pattern alone.
Advantages of Candlestick Patterns
Traders widely use candlestick patterns as it helps them understand market sentiment and price movement. Some of the benefits include:
- Candlestick patterns are easy to understand on a price chart.
- Traders can use the patterns to understand the balance between buying and selling pressure.
- They are useful in identifying trend continuation or reversals.
- Candlestick patterns can be across stocks, commodities and cryptocurrencies.
- Beginners must always combine candlestick patterns with other technical indicators and market analysis for better decision-making.
Limitations of Candlestick Patterns
Beginners must spend time properly understanding candlestick patterns. While they are easy to understand, they certainly have several limitations. Some of these include:
- The patterns do not guarantee future price movements.
- False signals may occur during highly volatile market conditions. Entering a trade early without confirmation can be a false signal and be risky.
- They should be combined with other technical indicators and market analysis.
- Beginners may confuse similar-looking patterns. It is significant to understand each pattern and wait for confirmation to avoid making incorrect interpretations.
- Beginners should always understand the overall market trends, understand patterns properly and seek confirmation to make informed decisions.
Wrapping up
Candlestick patterns are one of the most helpful tools for beginners starting their trading journey. It provides them with information about possible market direction, price movement and buying and selling behaviour.
First-time traders must always combine candlestick patterns with other technical indicators and market analysis to make informed decisions. A disciplined approach and consistent practice can help beginners gradually learn and improve trading skills.
FAQs
What are candlestick patterns?
Candlestick patterns are formations of price movements that appear on a trading chart. They help traders to understand if a trend is likely to continue or reverse, enabling them to make informed decisions.
Why are candlestick patterns important?
These patterns are important because they help traders to understand market fluctuations, identify possible price movements and give clues about whether buyers and sellers are gaining control. It helps traders to recognise possible continuation or reversal trends.
Should beginners use candlestick patterns?
Candlestick patterns are one of the most common technical analysis tools that beginners can learn. They are easy to understand and can be used alongside other indicators for optimal trading decisions.
Can candlestick patterns predict future prices?
Beginners should not rely on candlestick patterns for future price movements. They only indicate possible price movements based on past behaviour.
Why should traders use candlestick patterns with other indicators?
Utilising candlestick patterns with other indicators like trading volume, moving averages, and RSI helps beginners to confirm trading signals. It also reduces the chances of making decisions based on false signals.