



Reversal Chart Patterns








Key takeaways
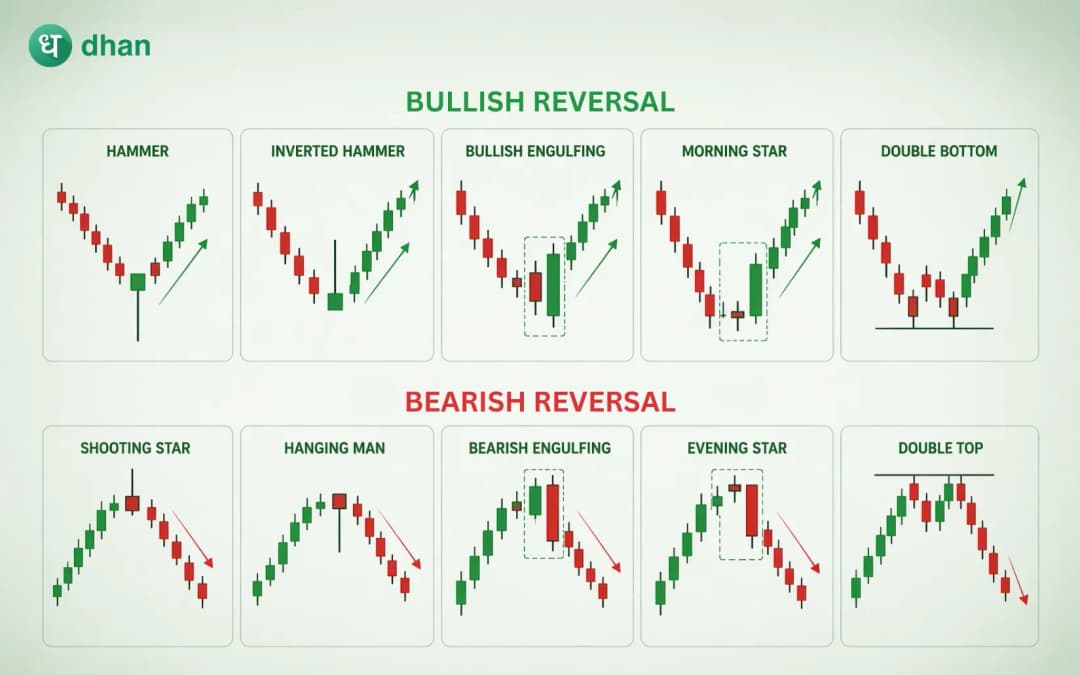
- Reversal chart patterns are technical formations that may signal the end of an existing trend and the beginning of a new one.
- These patterns can appear after both uptrends and downtrends.
- Popular reversal patterns include Head and Shoulders, Inverse Head and Shoulders, Double Top, Double Bottom, Triple Top, Triple Bottom, and Rounding Bottom.
- Confirmation is important because not every pattern leads to a successful reversal.
One of the biggest challenges in trading is determining whether a trend is likely to continue or if it is beginning to lose momentum. Markets constantly move through cycles of optimism, uncertainty, fear, and recovery. As these shifts occur, price charts leave behind recognisable formations that can provide clues about changing market sentiment.
Traders usually look for reversal chart pattern formations. These patterns attract attention because they indicate that buyers or sellers are losing control, and a potential new opportunity is building. For traders, identifying a reversal early can be valuable. It may offer an opportunity to enter a new trend near its beginning.
Understanding how these patterns form and what they reveal about market psychology can help traders make more informed decisions.
What are reversal chart patterns?
Reversal chart patterns are price formations that develop after an established trend and suggest that the prevailing trend may be coming to an end.
These patterns can appear after:
- An uptrend, potentially signalling a bearish reversal
- A downtrend, potentially signalling a bullish reversal
A trend continues as long as one side maintains control. In an uptrend, buyers consistently push prices higher. In a downtrend, sellers dominate and drive prices lower.
A reversal pattern develops when the current trend starts to lose momentum. Once the trader's expectations shift, price action starts reflecting a gradual transfer of control from buyers to sellers or vice versa.
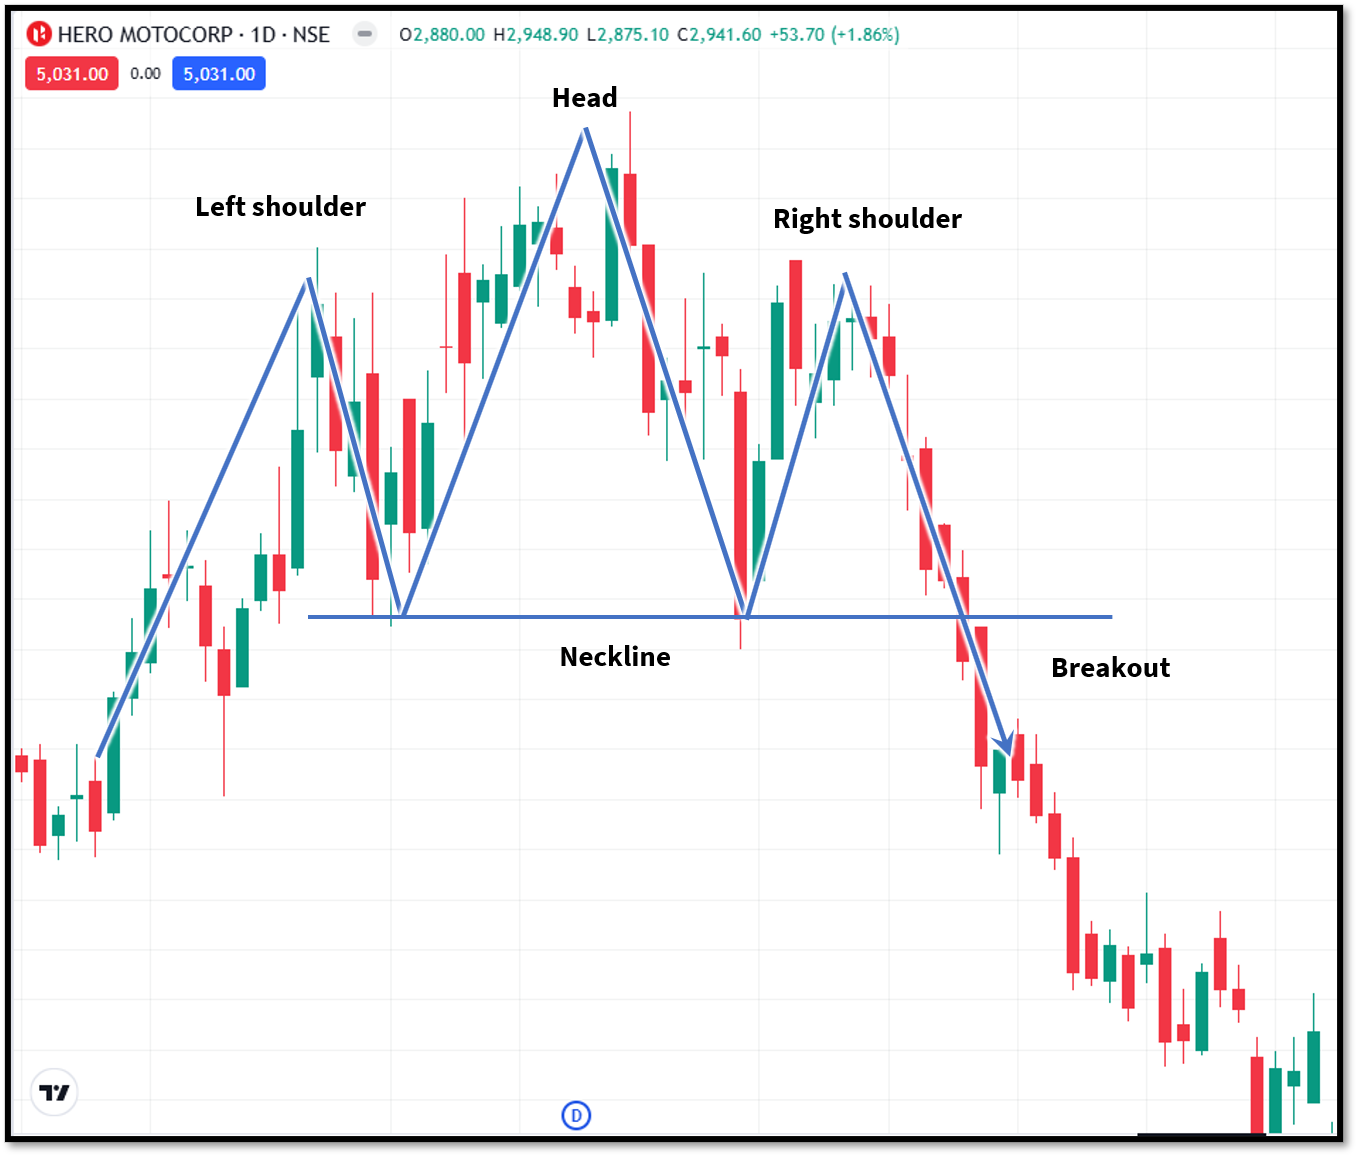
1. Head and shoulders pattern
The Head and Shoulders pattern is one of the most recognised bearish reversal formations.
It consists of:
- A left shoulder
- A higher peak known as the head
- A right shoulder
- A neckline connecting the lows
The pattern typically develops after an uptrend. The head represents a final attempt by buyers to push prices higher. When the right shoulder forms and price breaks below the neckline, it suggests that sellers are beginning to gain control.
Many traders view the neckline break as the confirmation signal.
2. Inverse head and shoulders pattern
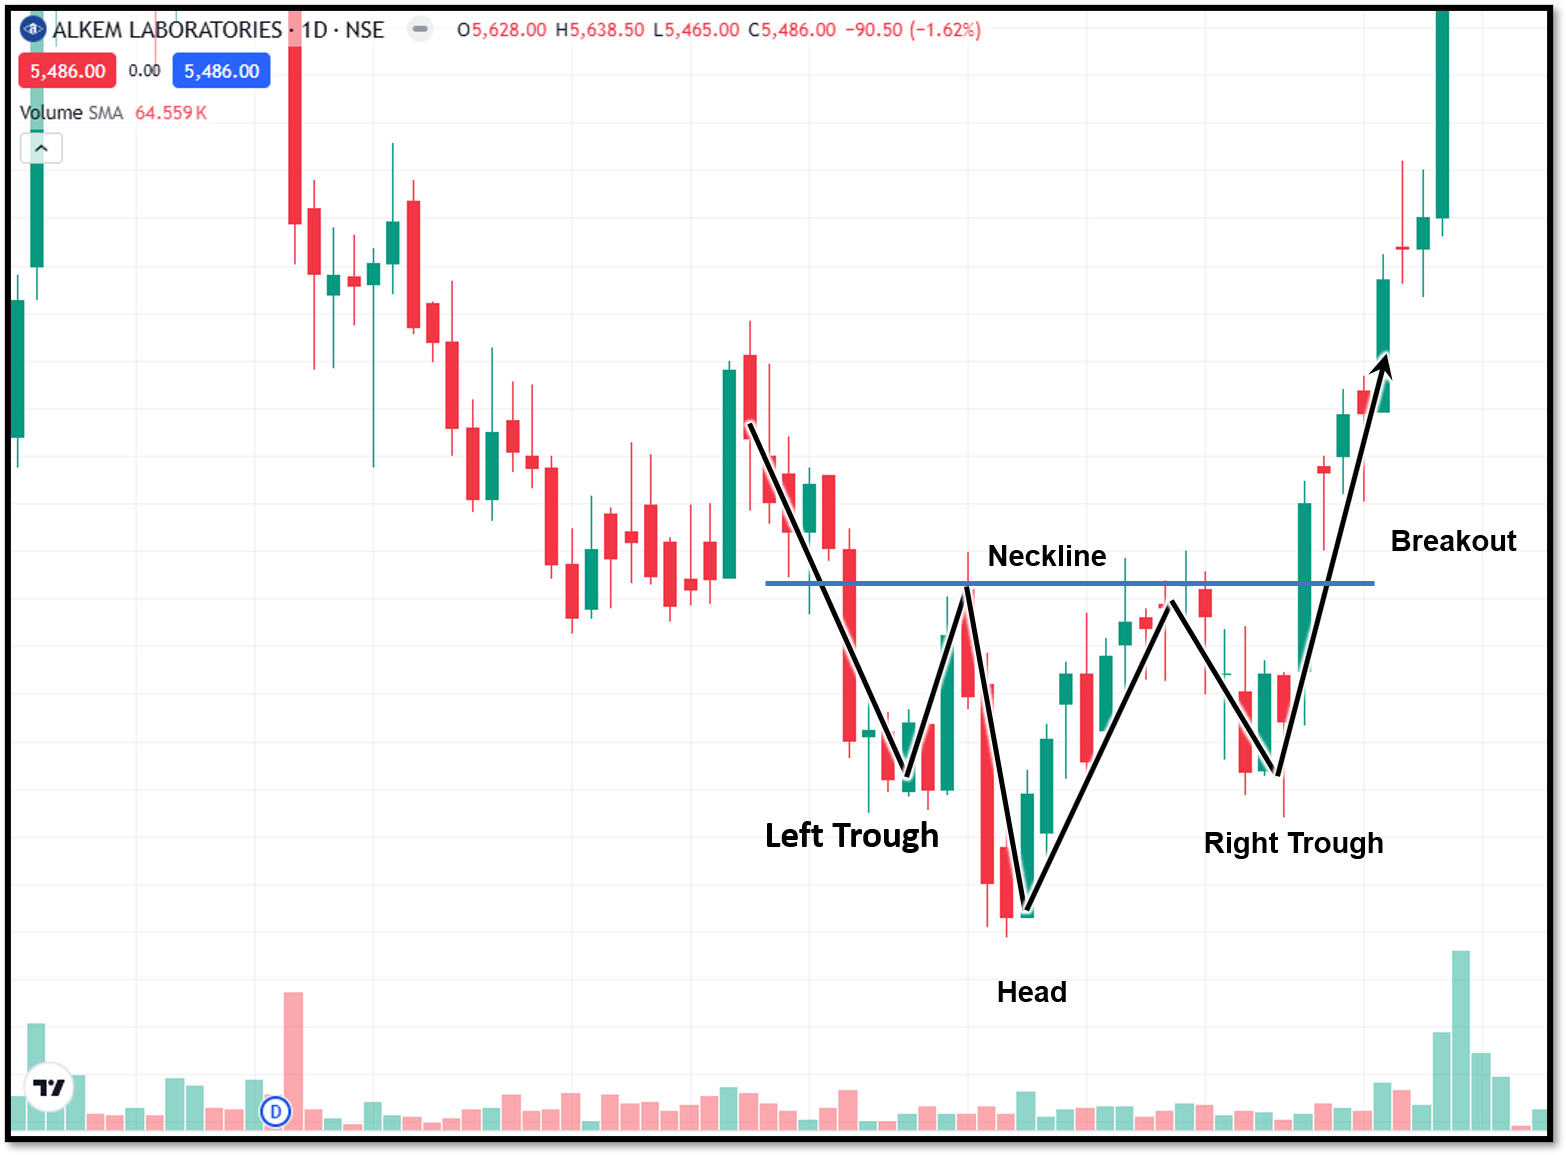
The Inverse Head and Shoulders pattern is the bullish counterpart of the traditional Head and Shoulders. It forms after a downtrend and consists of:
- A left trough
- A deeper trough forms the head
- A right trough
- A neckline connecting the highs
The inverse head and shoulders pattern suggests that selling pressure is weakening. The pattern is confirmed once the price breaks above the neckline. This pattern is commonly used to identify potential trend reversals from bearish to bullish conditions.
3. Double top pattern
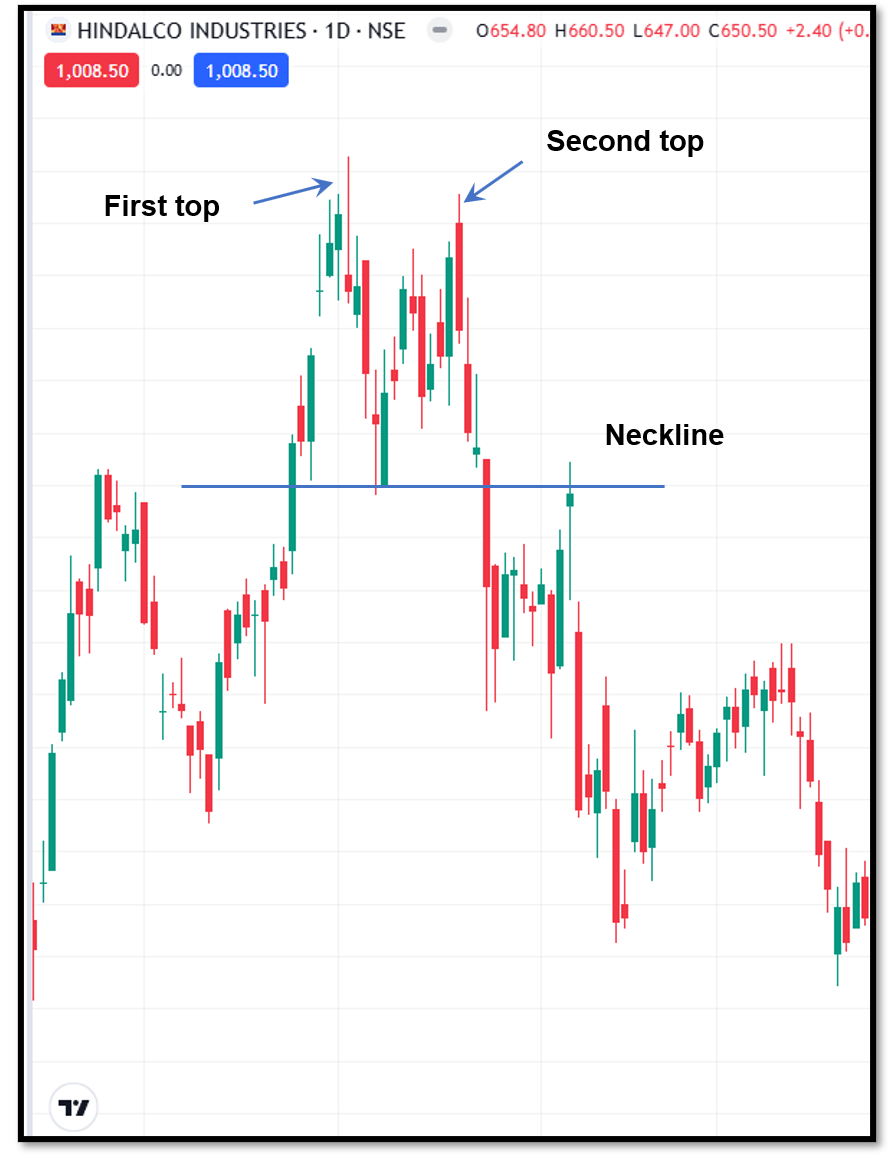
A Double Top is a bearish reversal pattern that forms after an uptrend. The market reaches a peak, declines, and then rallies again to approximately the same level before reversing lower.
This repeated failure to break through resistance can be a sign that the buying pressure is waning. The pattern is usually confirmed when the price breaks through the support level created between the two peaks.
Double Tops are popular because they are relatively easy to identify and often highlight important resistance zones.
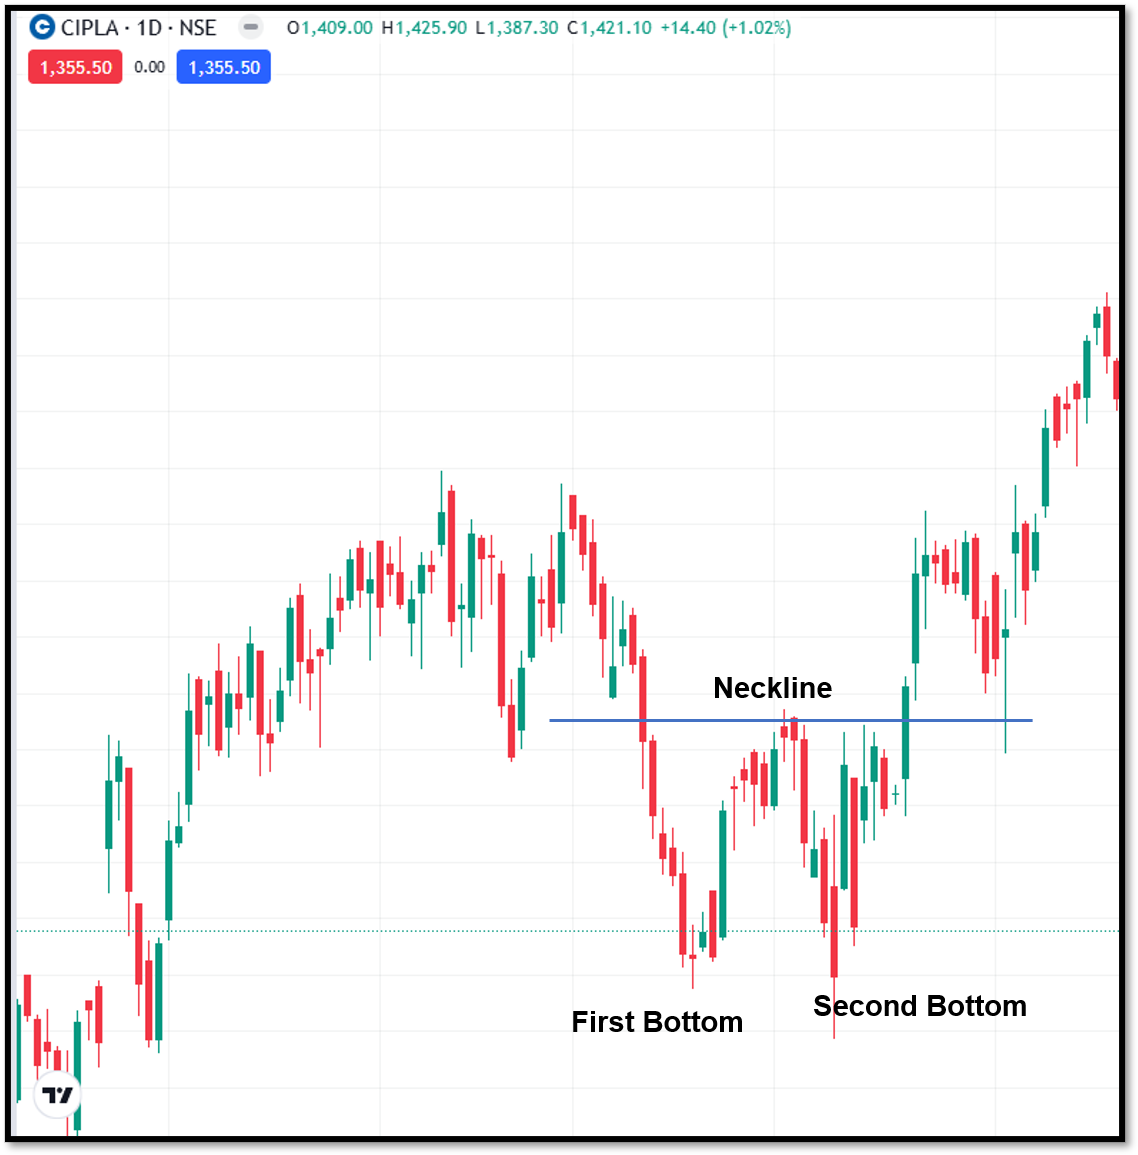
4. Double bottom pattern
The Double Bottom is a bullish reversal pattern that develops after a downtrend. Price falls to a support level, rebounds, and then returns to test the same area before moving higher. This repeated support test suggests that sellers are struggling to push prices lower.
Pattern confirmation occurs when the price breaks above the resistance level between the two bottoms. Many traders view the pattern as a sign that accumulation may be taking place.
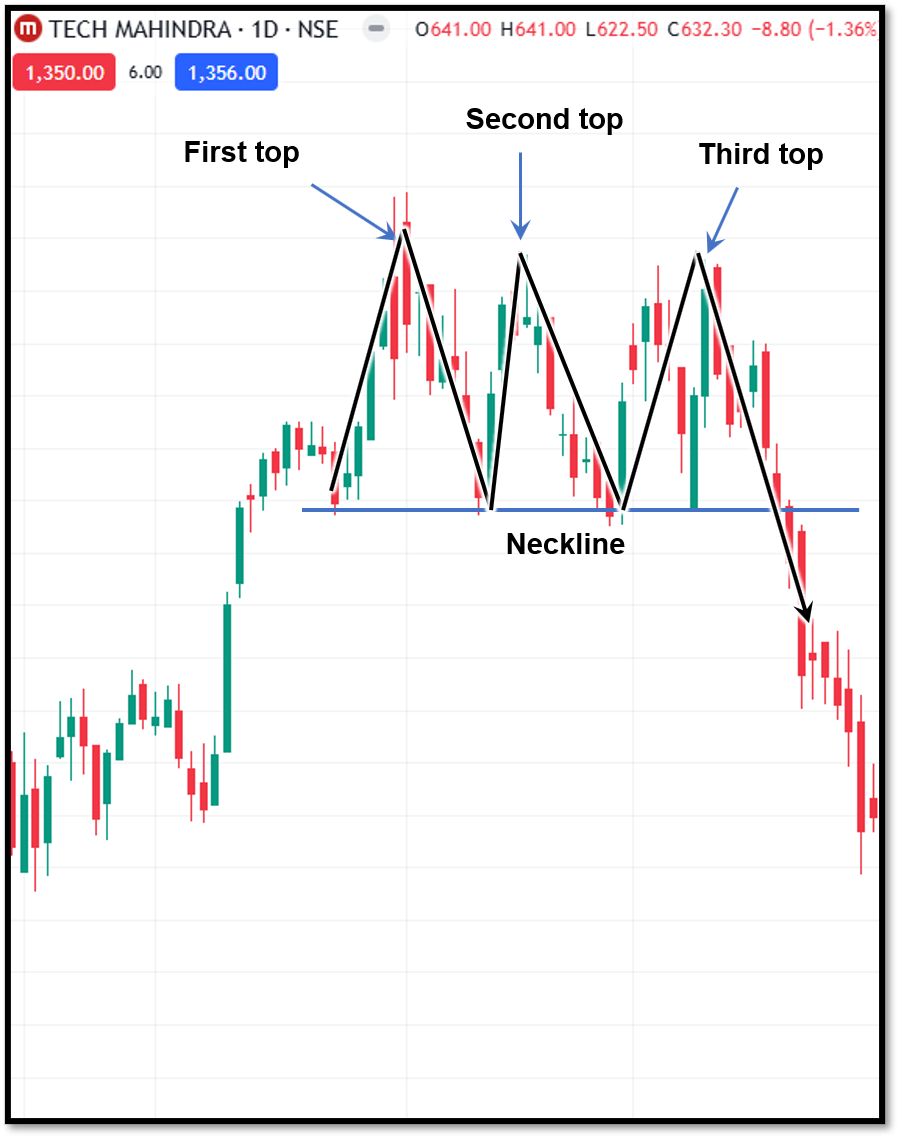
5. Triple top pattern
A Triple Top forms when the price reaches a resistance level three times before reversing lower. The repeated inability to break higher often signals weakening buying pressure.
6. Triple bottom pattern
A Triple Bottom forms when price tests support three times before moving higher. The pattern suggests that sellers have failed repeatedly to push prices below a critical level.
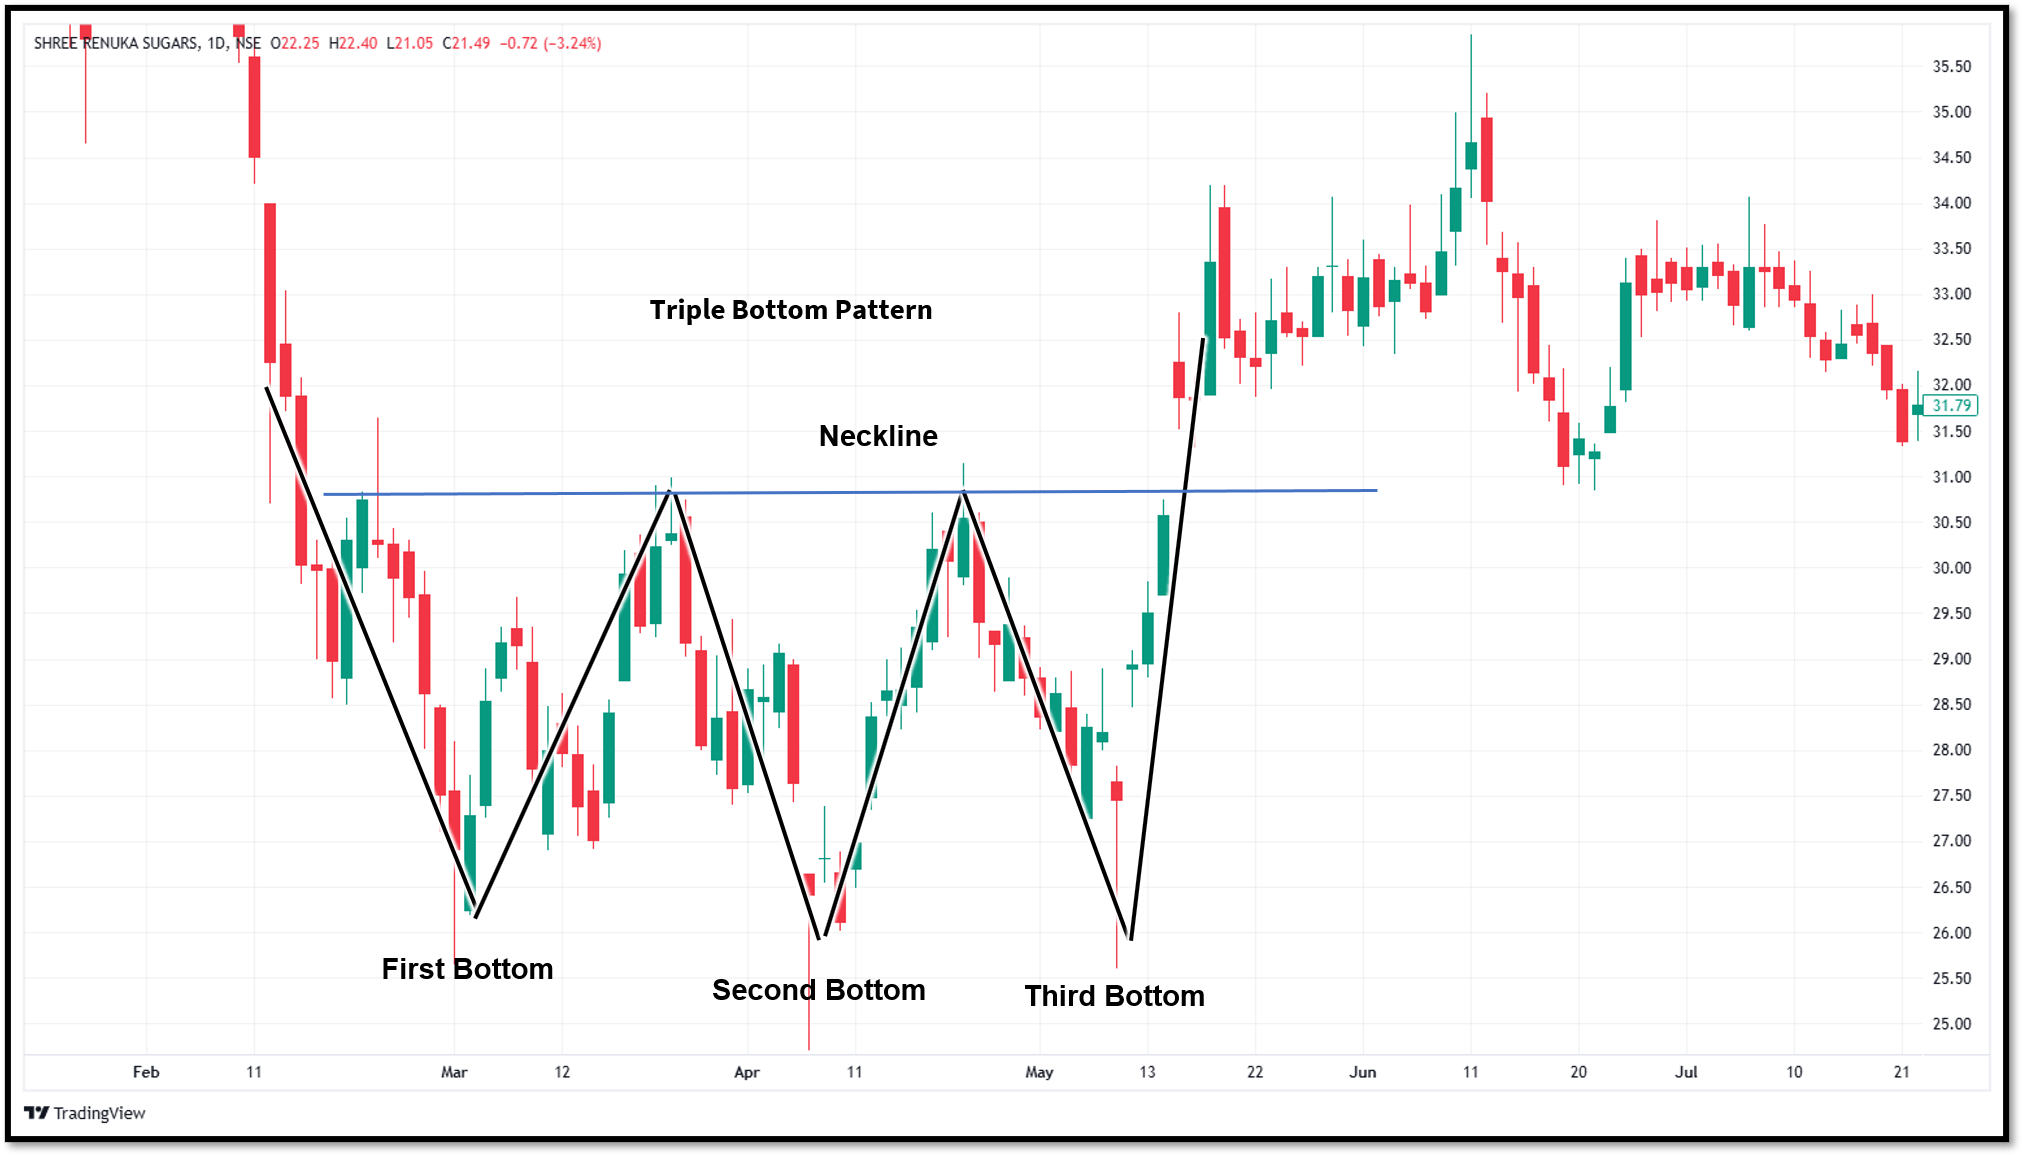
Because these patterns involve multiple tests, some traders consider them more significant than Double Tops and Double Bottoms.
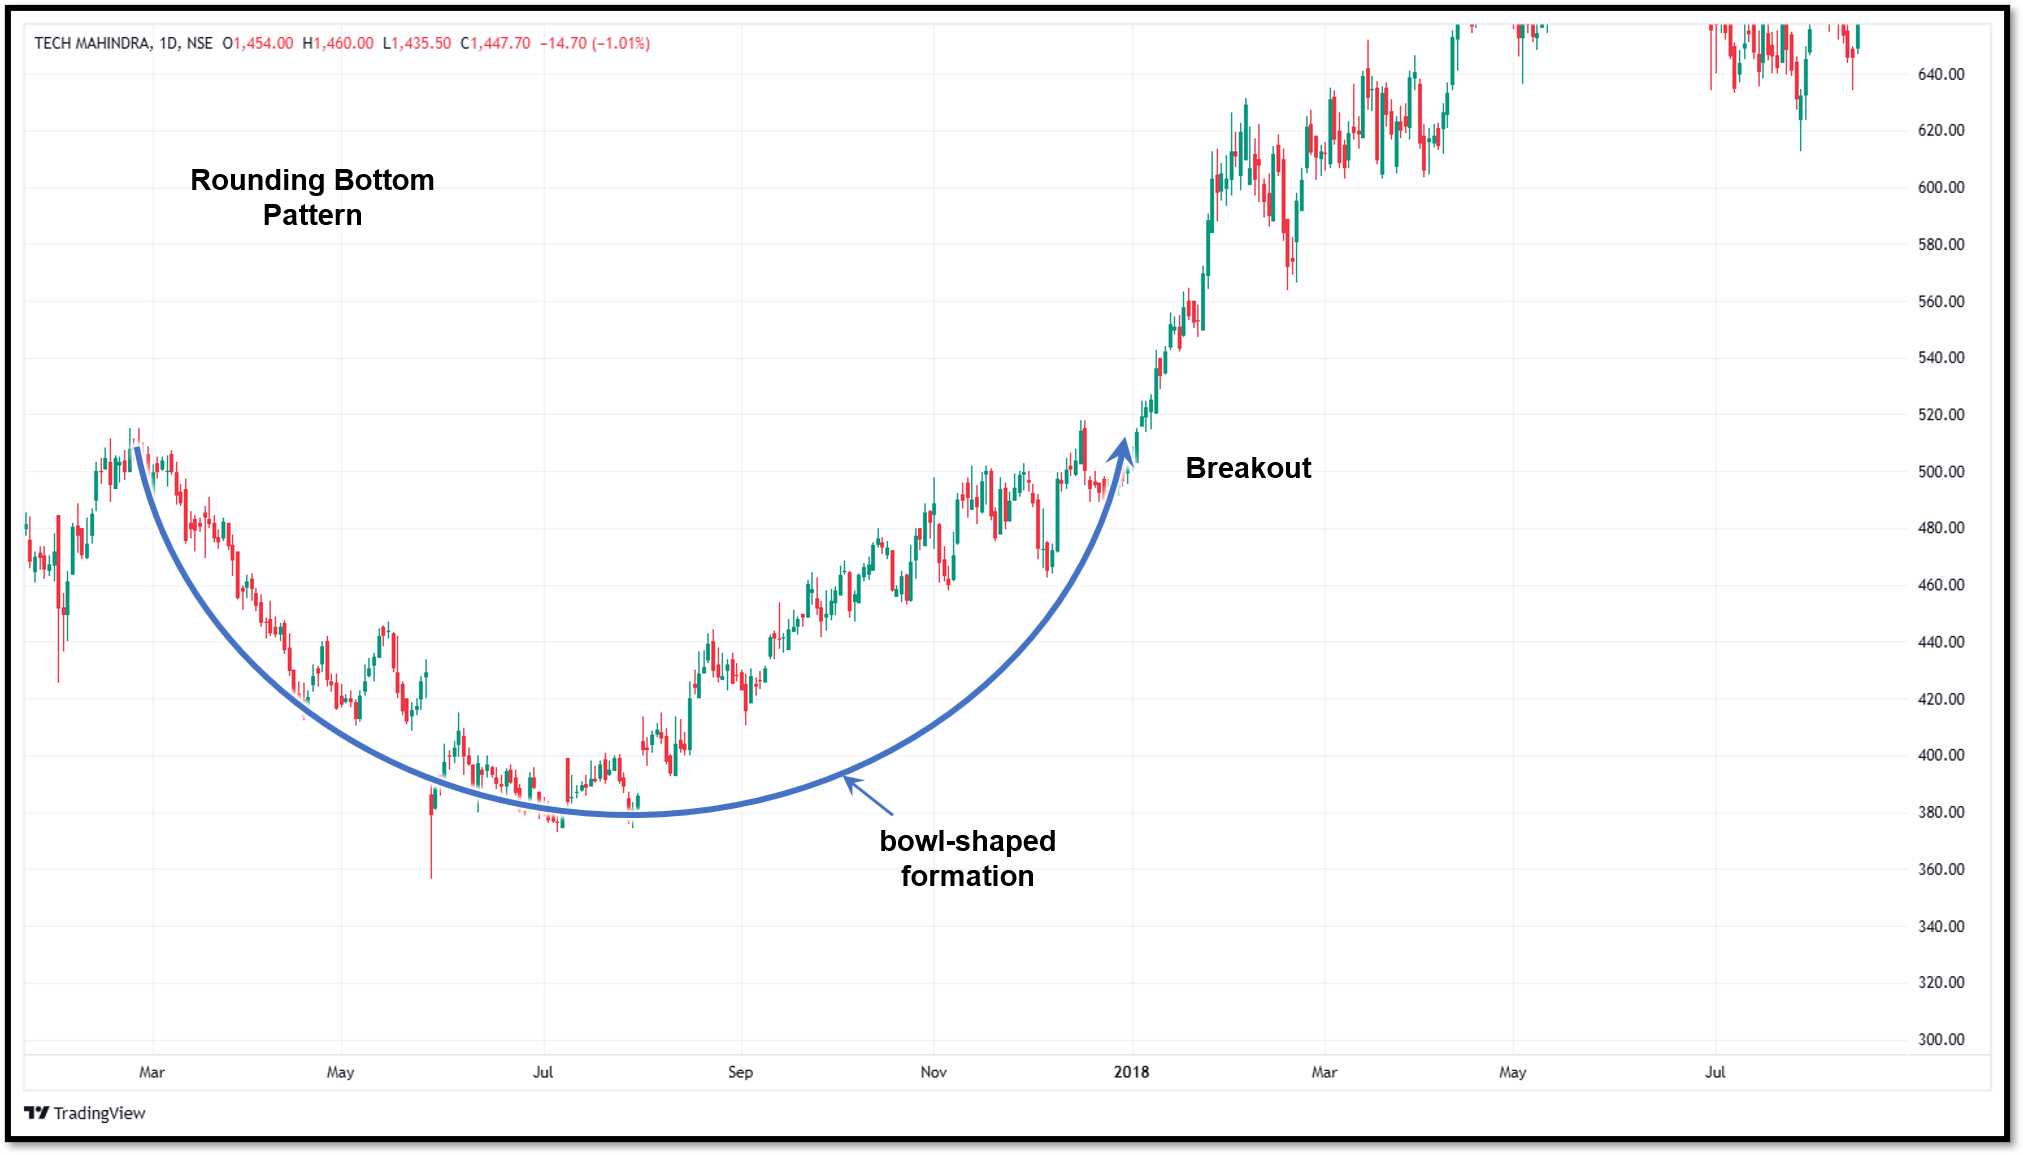
7. Rounding bottom pattern
The Rounding Bottom is a longer-term bullish reversal pattern. Unlike sharp reversal formations, this pattern develops gradually.
Price slowly transitions from a downtrend into a consolidation phase before beginning a new uptrend. The rounded structure reflects a gradual shift in market sentiment.
Initially, the sellers were in control and pushed the prices down, but over time, selling pressure decreased while buying interest steadily increased. Due to this, it forms a smooth curve that resembles a bowl shape. Long-term investors usually monitor this pattern because it can signal major trend changes.
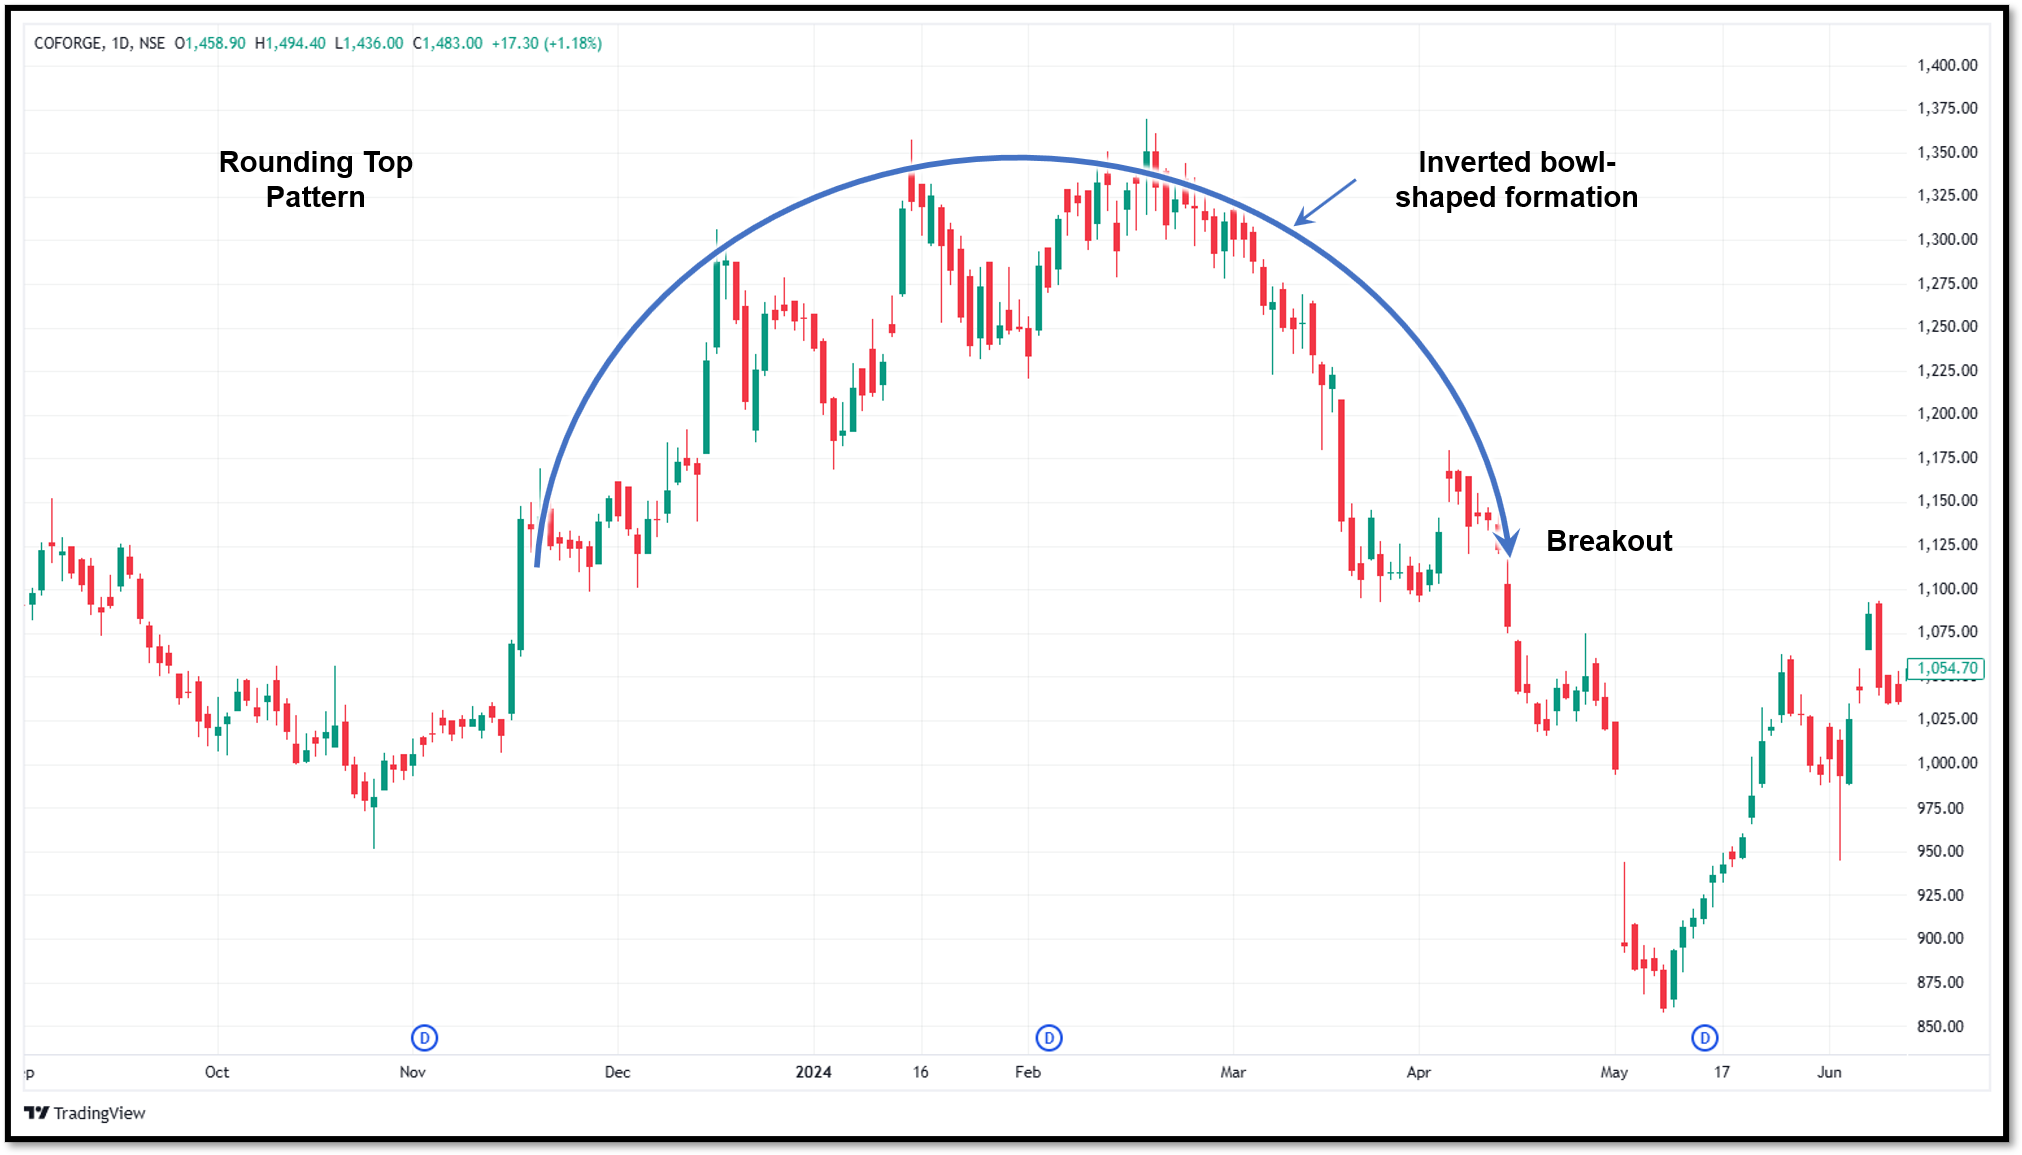
8. Rounding top pattern
The Rounding Top is the bearish counterpart of the Rounding Bottom pattern.
It develops gradually after an uptrend as buying momentum starts fading. Instead of making sharp reversals, the price slowly transitions from a bullish trend into a period of distribution before beginning a downtrend.
The curved structure reflects a gradual shift in market sentiment. Buyers become less aggressive while selling pressure increases steadily. Once price breaks below a key support level, the pattern confirms itself.
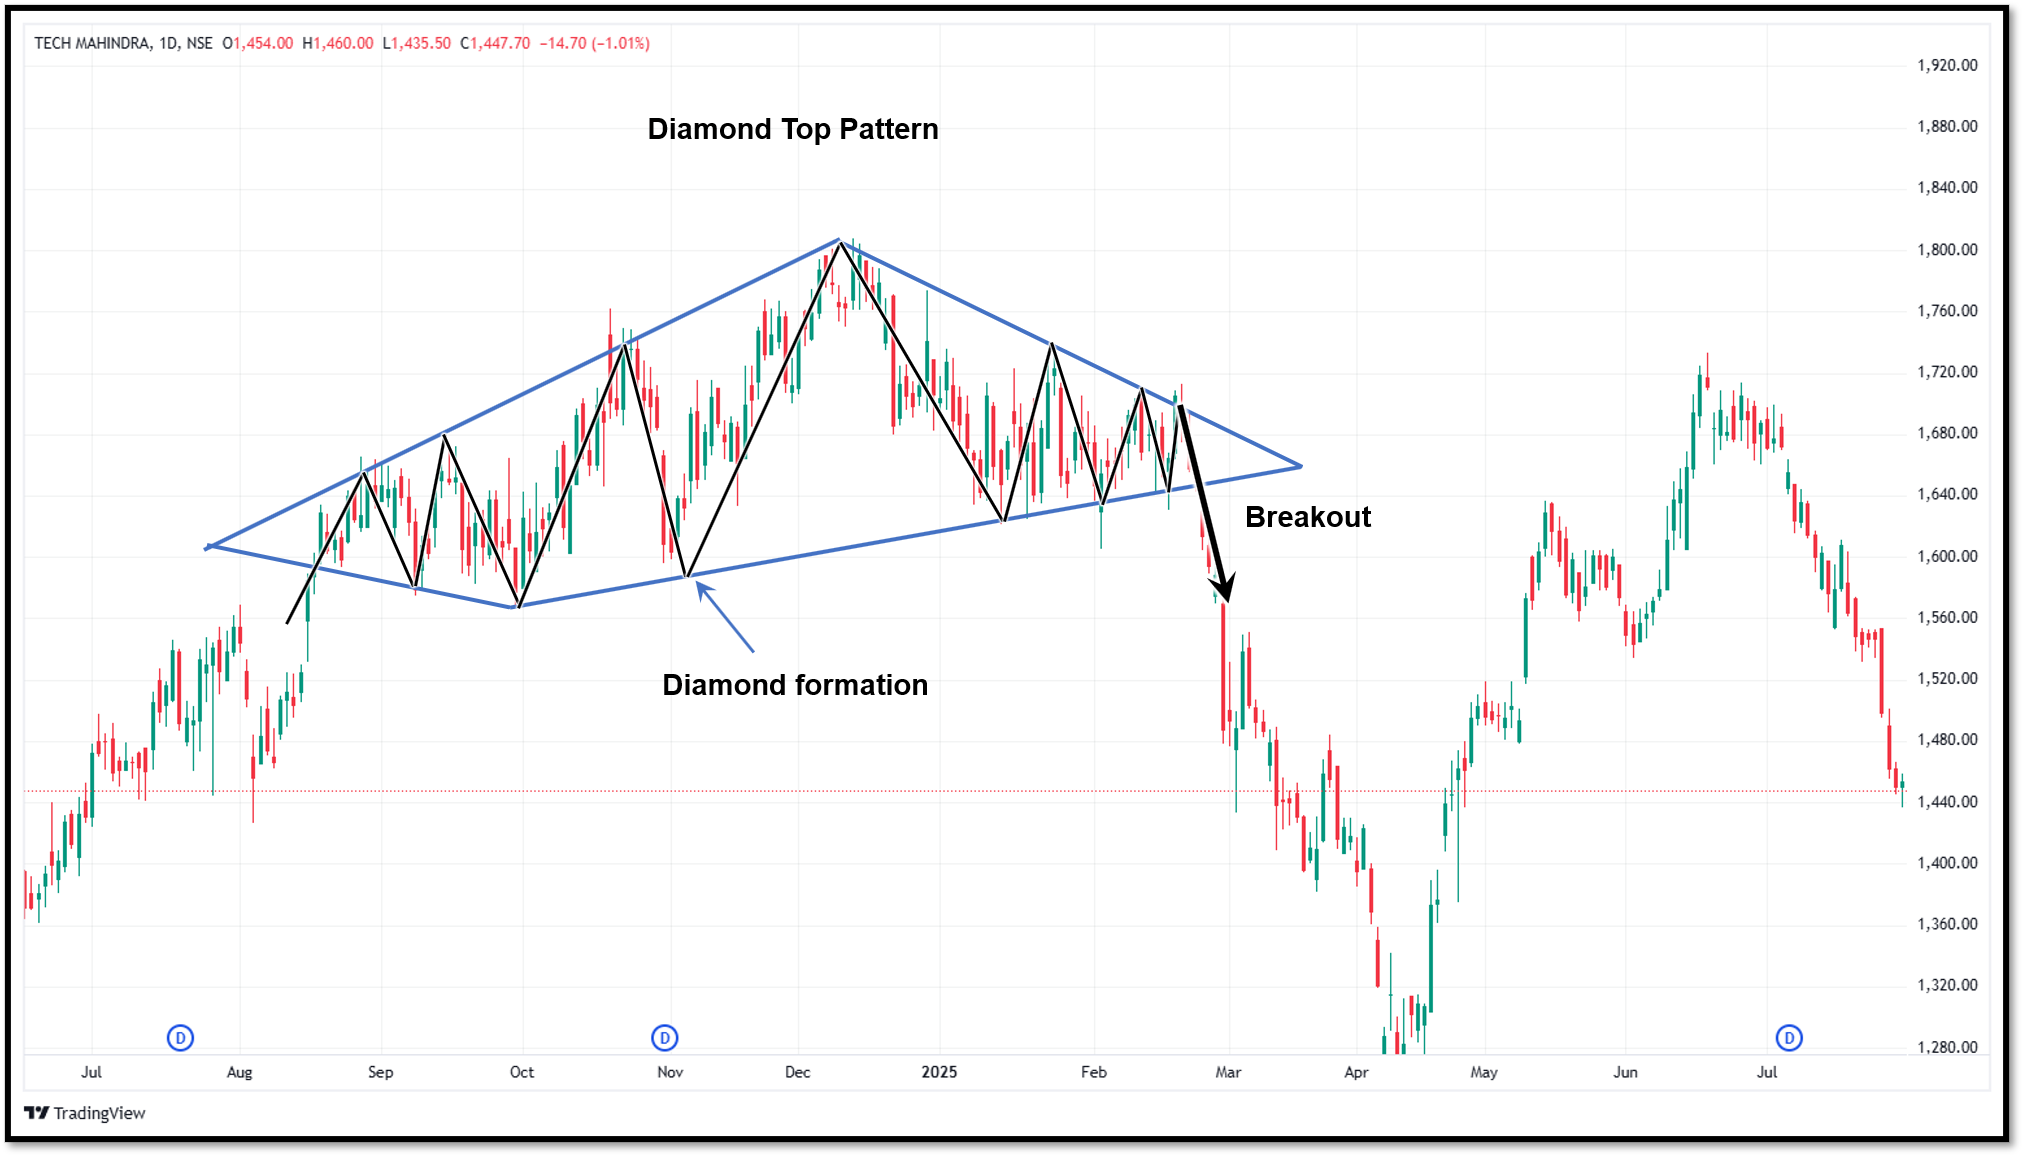
9. Diamond top pattern
The Diamond Top is a bearish reversal pattern that usually appears near the end of a strong uptrend. The pattern begins with expanding price swings and then transforms into contracting swings, creating a diamond-like shape on the chart.
This unusual structure reflects increasing uncertainty among market participants. As volatility expands and then contracts, the battle between buyers and sellers intensifies.
A breakdown below the lower boundary of the pattern confirms the bearish reversal and may signal the beginning of a downward trend.
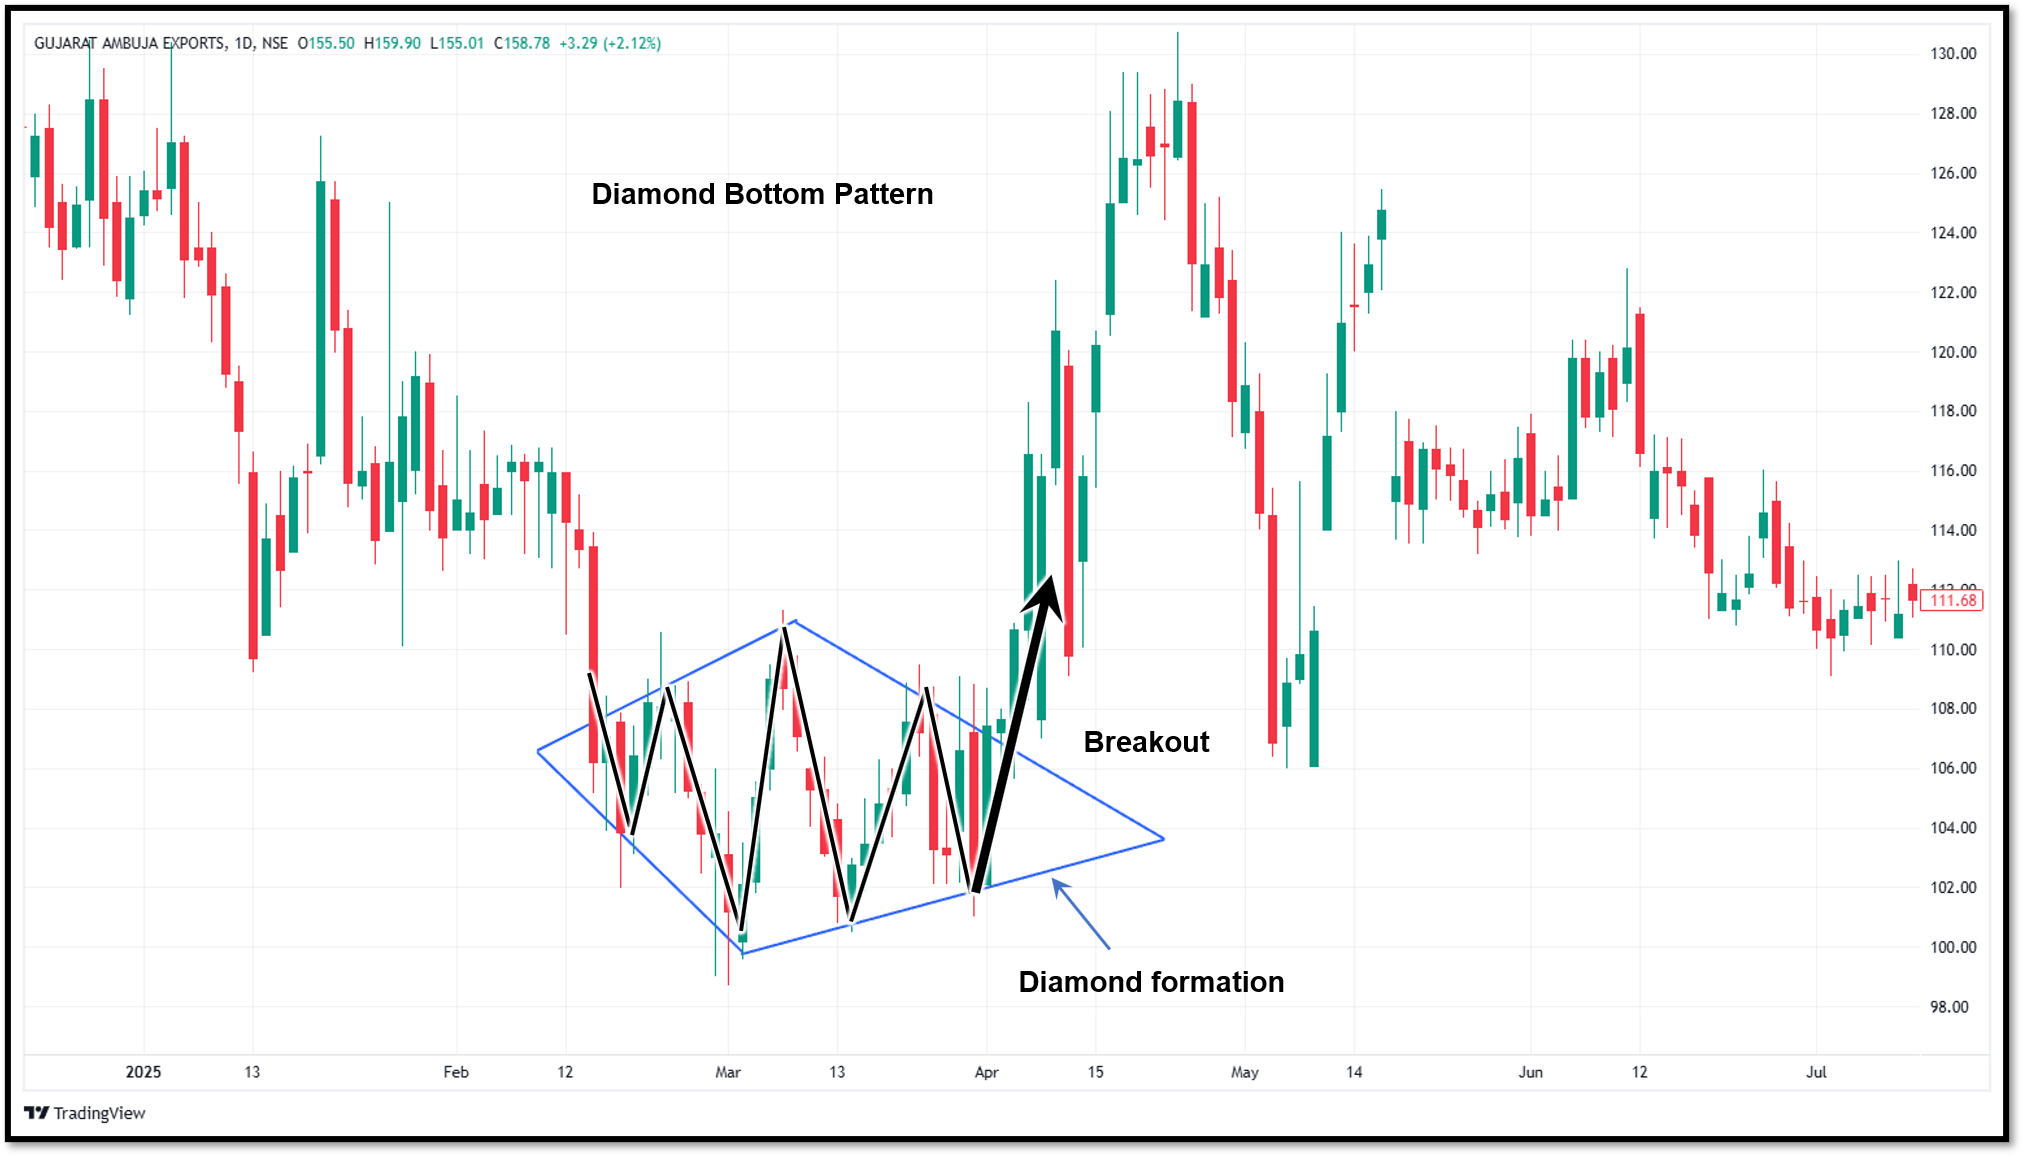
10. Diamond bottom pattern
The Diamond Bottom is a bullish reversal pattern that forms after a prolonged downtrend. Like the Diamond Top, it consists of an initial period of expanding price swings followed by contracting price movements. However, it develops near market lows rather than highs.
The pattern suggests that selling pressure is gradually losing strength while buyers begin accumulating positions.
When price breaks above the upper boundary of the diamond structure, traders often interpret it as confirmation that bullish momentum is returning and a new uptrend may be developing.
Conclusion
Reversal patterns are most traders' favourite tool during technical analysis. They are very useful for identifying the reversal opportunities. These patterns represent the weakening of the current trend momentum and a possibility of trend reversal.
The reversal patterns help traders interpret changes in supply and demand. The effectiveness of the patterns increases when combined with volume analysis, momentum indicators, support and resistance levels.
FAQs
What is a reversal chart pattern?
A reversal chart pattern is a technical formation that suggests an existing trend may be ending and a new trend could be beginning.
Are reversal patterns suitable for beginners?
Yes. Patterns such as Double Tops, Double Bottoms, and Head and Shoulders are commonly taught to beginners because they are relatively easy to identify.
Can reversal patterns appear in intraday trading?
Yes. Reversal patterns can develop on intraday, daily, weekly, and monthly charts. But the pattern is considered more reliable on higher timeframes.
What indicators work well with reversal patterns?
RSI, MACD, moving averages, and volume indicators are commonly used alongside reversal patterns to improve analysis and confirmation.
What is the difference between a reversal pattern and a continuation pattern?
A reversal pattern suggests that the current trend may change direction, while a continuation pattern indicates that the existing trend is likely to continue after a temporary pause.







