Diamond Bottom Pattern







Key takeaways
- The Diamond Bottom Pattern is a bullish reversal chart pattern which appears after a strong downtrend.
- It begins with broader price swings followed by narrower ones, forming a diamond shape.
- Trading volume decreases during the formation of the pattern and increases when prices break above the resistance level.
- A buy signal occurs after a strong breakout supported by high volume, while the stop loss is placed just below the recent low, and the target is based on the pattern's height.
- Due to its rarity and difficulty in spotting, this pattern works best when combined with volume and momentum indicators.
If you have been trading for a while, you probably know that sometimes the strongest rallies happen when almost everyone has given up on a stock. After a prolonged period of falling prices, the market becomes unpredictable, prices fluctuate rapidly, stop-losses get hit, and both the bulls and the bears find it difficult to control the market conditions.
Many traders avoid such chaotic markets because they want clear direction and are uncomfortable when things are uncertain. But experienced traders identify these situations of confusion as an opportunity to initiate a major reversal. Rather than focusing only on price fluctuations, experienced traders study the chart pattern that is forming.
The diamond bottom pattern is an example of such a formation, which is an indication that buyers are starting to take charge. In this article, we will look at the diamond bottom pattern, its structure, how to identify it, how to trade with it, its advantages, and its disadvantages.
What is the Diamond Bottom Pattern?
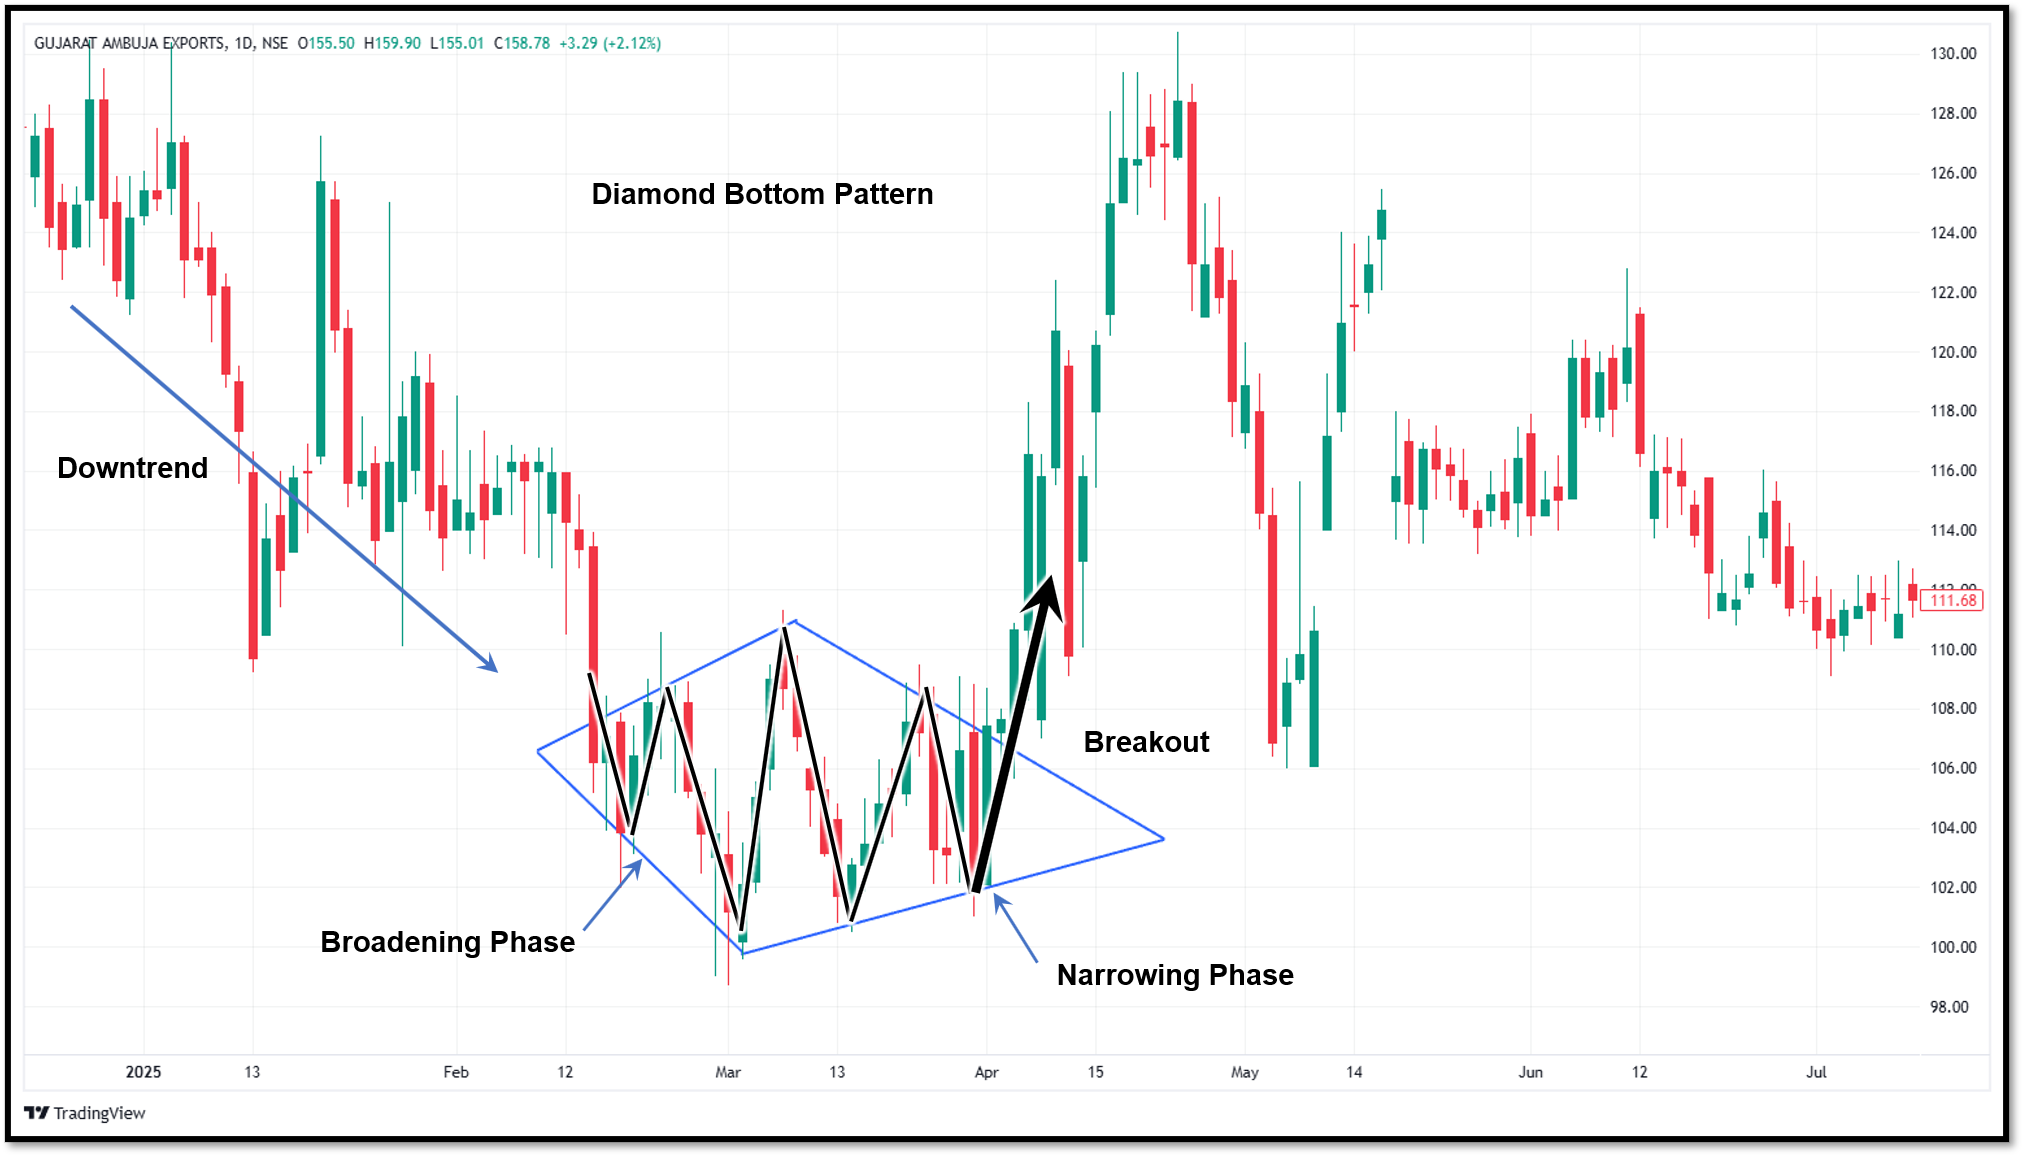
The diamond bottom pattern is a bullish reversal pattern which usually appears after a prolonged downtrend in a stock, index or any other traded instrument. As its name suggests, when trendlines are drawn to connect the swing highs and swing lows within the pattern, the resulting shape resembles a diamond or a lying rhombus.
There are two main phases:
Broadening phase: The price starts to move over a wider range. Each new high is higher than the previous one, and each new low is lower. It shows that the buyers and the sellers are both trying to dominate the market, contributing to high levels of market volatility.
Narrowing phase: Price swings start contracting with lower highs and higher lows. This shows that selling pressure is decreasing and the market is becoming more stable.
These two stages combined will form the diamond-shaped pattern. Once the price breaks above the upper trend line of the narrowing phase, it is seen as a bullish signal. This indicates strong buying pressure and the possibility that the price may start moving higher.
How to identify the Diamond Bottom Pattern
Identifying a genuine diamond bottom pattern requires both experience and patience, since it is one of the rare formations. Here's what to look for:
Verify the previous trend
Check if the price has been decreasing over a reasonable period of time. The formation can be considered a reversal signal only after establishing a genuine downtrend.
Identify the widening phase
Draw two trendlines. One through the highest points and another through the lowest points. If they are diverging (moving away from each other), you have identified the first part of a possible Diamond pattern.
Identify the narrowing phase
As the price swings become smaller, draw new trendlines from the most recent highs and lows. If they come together, you are in the second part of the formation.
Examine the overall shape
The four trendlines together form a diamond or a lying rhombus. It may be different from the textbook shape, so use some judgement.
Volume behaviour
Trading volumes generally decline as the formation develops, reflecting increasing indecision in the market.
Use indicators to confirm
Indicators such as the relative strength index, moving average convergence divergence and moving averages will help to confirm the momentum behind a breakout before you enter a trade.
How to trade the Diamond Bottom Pattern
Once you have identified a valid diamond bottom pattern, the next step is executing a disciplined trade. Here are a few strategies:
Wait for confirmation
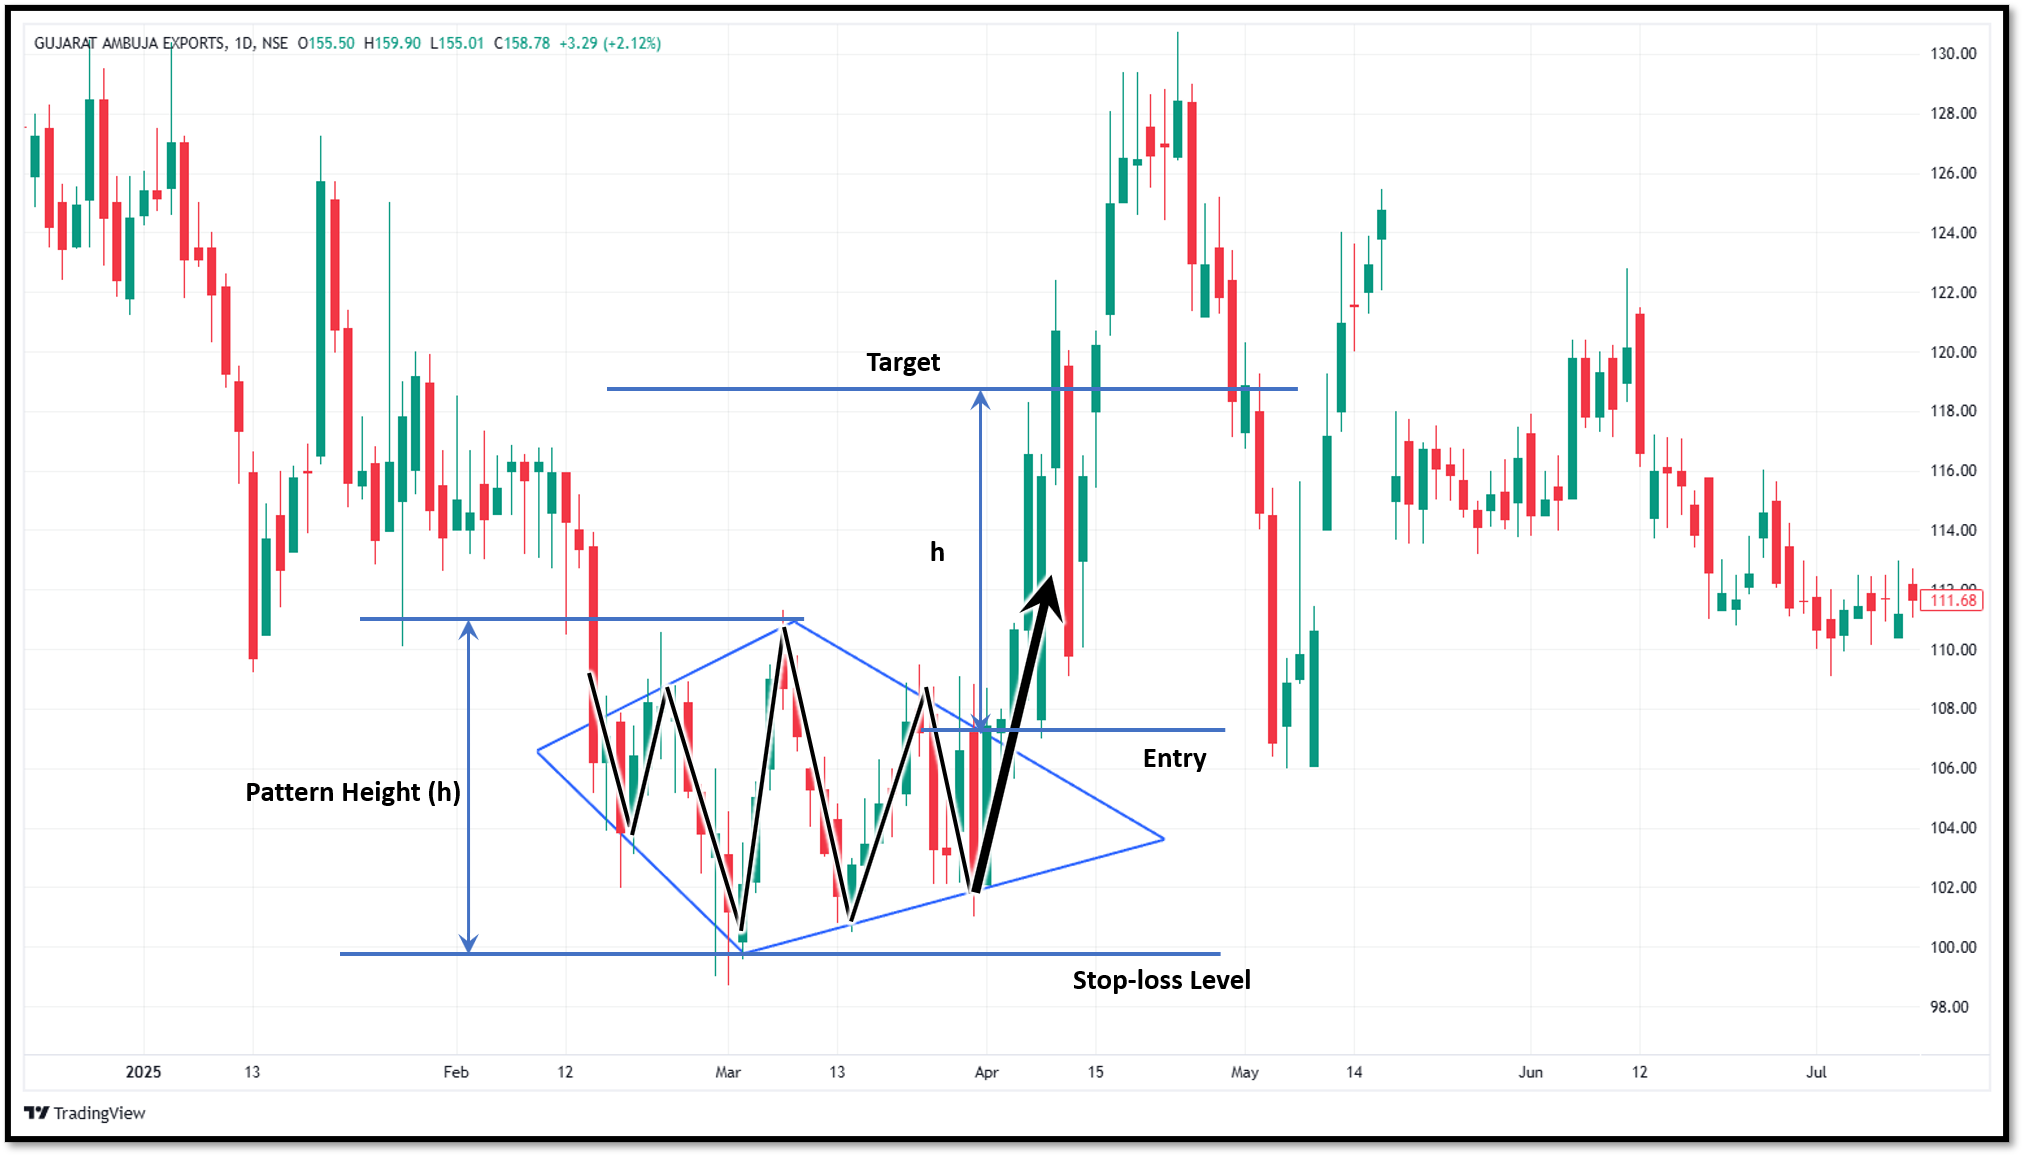
The first thing a trader must do is wait patiently for the pattern to confirm. This confirmation comes when the price breaks above the upper trendline of the diamond with increased volume.
Enter the trade
You can enter at the point of the breakout candle, or wait for a re-test of the breakout level to get a safer entry with a tighter stop loss.
Stop loss placement
A stop loss is very important in every trade. So here as well, traders often put a stop loss below the lower trendline of the diamond pattern to manage their capital if the market moves against their position.
Set your target
Set your profit target by determining the height of the diamond and projecting that same distance upward from the breakout point. This is the most widely used method for setting a price objective on this pattern.
Position sizing
False breakouts can happen frequently, so it may be good not to put your entire capital in one trade. Instead, scale into the trade gradually, making small entries rather than one large one. Increase your position size as the price moves in your favour after the breakout.
Advantages of trading the Diamond Bottom Pattern
Some advantages of the diamond bottom pattern are:
- Clear trading levels: The chart pattern provides clear entry points, stop loss and target levels. Traders can also use the diamond formation's height to determine a possible target price.
- Strong upside potential: Once the trade signal is confirmed, the breakout can be followed by a sharp rally, especially if buying volume increases and market sentiment turns bullish.
- Works across markets: The pattern is found in stocks, indices, forex, commodities, and even cryptocurrencies, providing opportunities to trade with various market players.
- Easy to confirm: The pattern works well with additional indicators such as volume, RSI, MACD or moving averages to provide robust confirmation for trading decisions.
- Risk management: With its clear limits, traders can set their risk level before entering into any trade, avoiding making arbitrary decisions.
Limitations of trading the Diamond Bottom Pattern
Some limitations of diamond bottom pattern are:
- Rare and difficult to identify: Genuine Diamond Bottom patterns are rare and their incomplete versions can easily be confused with other types of reversals.
- False breakouts can occur: A breakout without adequate volume can be short-lived, resulting in a price reversal that traps traders who entered too early.
- Takes time to form: The pattern builds over several weeks or months on large timeframes, requiring plenty of patience to spot a trade opportunity.
- Trend lines are subjective: Different traders may draw the pattern differently, leading to different readings and thus trading decisions.
- Requires confirmation: Starting a trade before the breakout will increase the chances of failure. But waiting for confirmation also means to miss some of the initial price movement.
Common mistakes traders make
Avoiding these common mistakes can improve the reliability of your trades.
- Many traders fail to differentiate a normal consolidation from a diamond pattern, even when the formation does not take on a clear widening-narrowing shape.
- One of the most common mistakes is to ignore the previous trend and treat the pattern as a signal of a bullish reversal without a real downtrend.
- Some traders take positions too early before there is a confirmed breakout above the upper trendline.
- Volume is often ignored, and trades are made even during weak trading activity at the time of the breakout.
- Using excessive leverage or risking too much capital on a single trade is another common error, as the pattern does not guarantee success and can lead to losses.
- Traders also tend to ignore major news and earnings announcements, leading to sudden and unanticipated moves in the market that can negate the setup.
To wrap up
As we have seen, the diamond bottom pattern is among the most reliable reversal signals in technical analysis. Once the pattern completes and the price crosses over the upper trend line, it signifies the end of the bearish trend and the beginning of the bullish trend.
By observing the markets you follow, you can identify the formation of this pattern and place a buy order once the price breaks out. A diamond bottom reversal can result in sharp increases; therefore, being able to identify it early and open a position allows you to earn good returns. With appropriate risk management, the diamond bottom offers an opportunity to profit from a change in trend.
FAQs
1. Is the diamond bottom pattern suitable for beginners?
Yes, they can, but only if they practice enough. Due to its subjective nature and the ease with which it can be misread, new traders need to verify such formations using other confirmation tools.
2. What is the best way to set a target on a diamond bottom trade?
By determining the maximum height of the diamond from its highest high to its lowest low and then projecting the same distance from the point of breakout.
3. What is the biggest mistake traders make with this pattern?
Entering a trade before the breakout is confirmed can result in fake signals and excessive losses. It's important to wait for the price to break above the resistance level with strong volume before taking a position.
4. Can a Diamond Bottom Pattern form on lower timeframes like 5-minute or 15-minute charts?
Although it can occur on lower timeframes, the pattern works best on higher timeframes like the daily or weekly chart. Lower time frames give more market noise, which increases the chance of fake breakouts.
5. Can the pattern appear multiple times in the same trend?
Yes, although it is relatively rare. Diamond Bottom Patterns may form multiple times during a prolonged downtrend if the market undergoes multiple corrections. However, every pattern should be validated individually before taking a position.