



Matching High Candlestick Pattern








Key takeaways
- Matching High is a bearish reversal pattern that forms after an uptrend and suggests that the buyers are losing momentum.
- It has two bullish candles with almost the same closing price. This means it is hard for buyers to push prices higher.
- As this pattern just hints at a possible reversal, traders must always confirm it through actual price movement, volume, or technical indicators before making a trade.
- While both Matching High and Tweezer Top look similar, they are different in their formation, market psychology and trading implications.
- Traders use indicators such as RSI, MACD, moving averages, volume analysis and Bollinger Bands to confirm the strength of this pattern.
In trading, candlestick patterns play an important role in showing how the market is torn between buyers and sellers. It is a significant component in technical analysis as it helps traders to know whether there is more buying or selling pressure. Some of these patterns point to the continuation of a trend while others show a decrease in momentum.
The Matching High candlestick pattern is one such bearish reversal pattern. It forms during an uptrend and indicates that bulls are unable to drive the price higher. Even though the pattern alone does not confirm a reversal, it serves as a signal when supported by additional technical indicators.
By understanding how the pattern forms and how to trade with this pattern effectively, traders can make more informed trading decisions and manage their risk effectively.
What is a Matching High Candlestick Pattern?
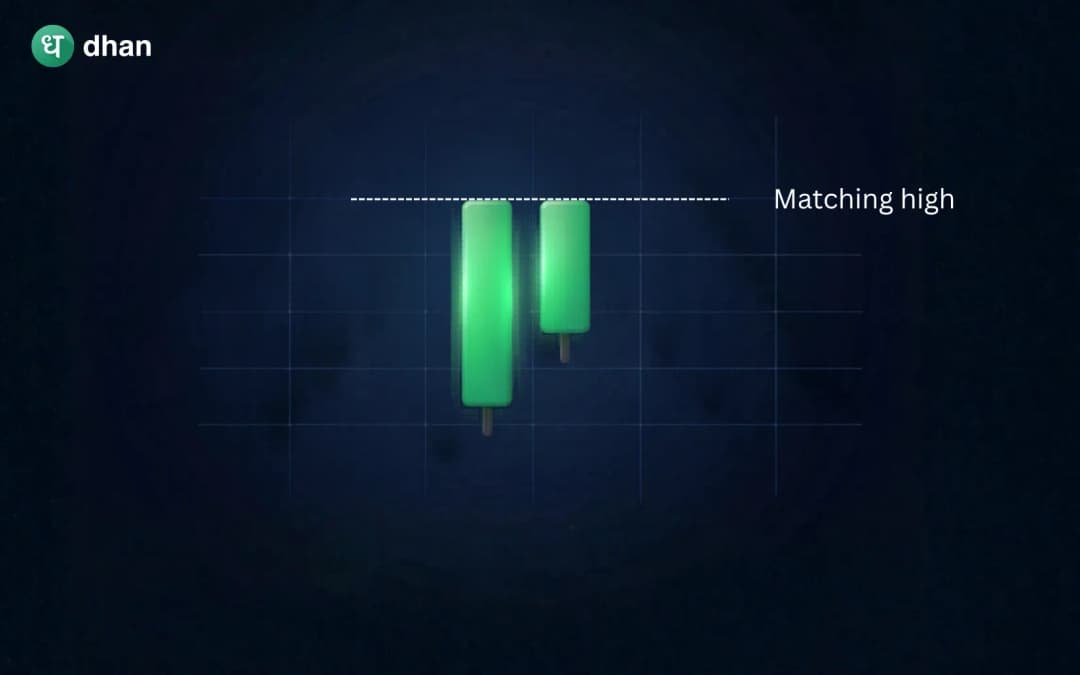
The Matching High candlestick pattern is a bearish reversal pattern that usually appears after an uptrend. It is made up of two consecutive bullish candles closing almost at the same price level, showing that buyers are having difficulty in increasing prices.
Although both candles appear bullish in colour, the pattern is considered bearish. The second candle is unable to make a higher closing point, indicating a slight change in the market mood. It shows that even though buyers remain active, their force starts losing strength as sellers are defending a certain price level.
The hesitation happens mostly close to resistance levels where selling pressure grows stronger, putting a limit on any further upward movement. Consequently, traders see the Matching High pattern as an early sign that the current uptrend might slow down, consolidate, or even reverse.
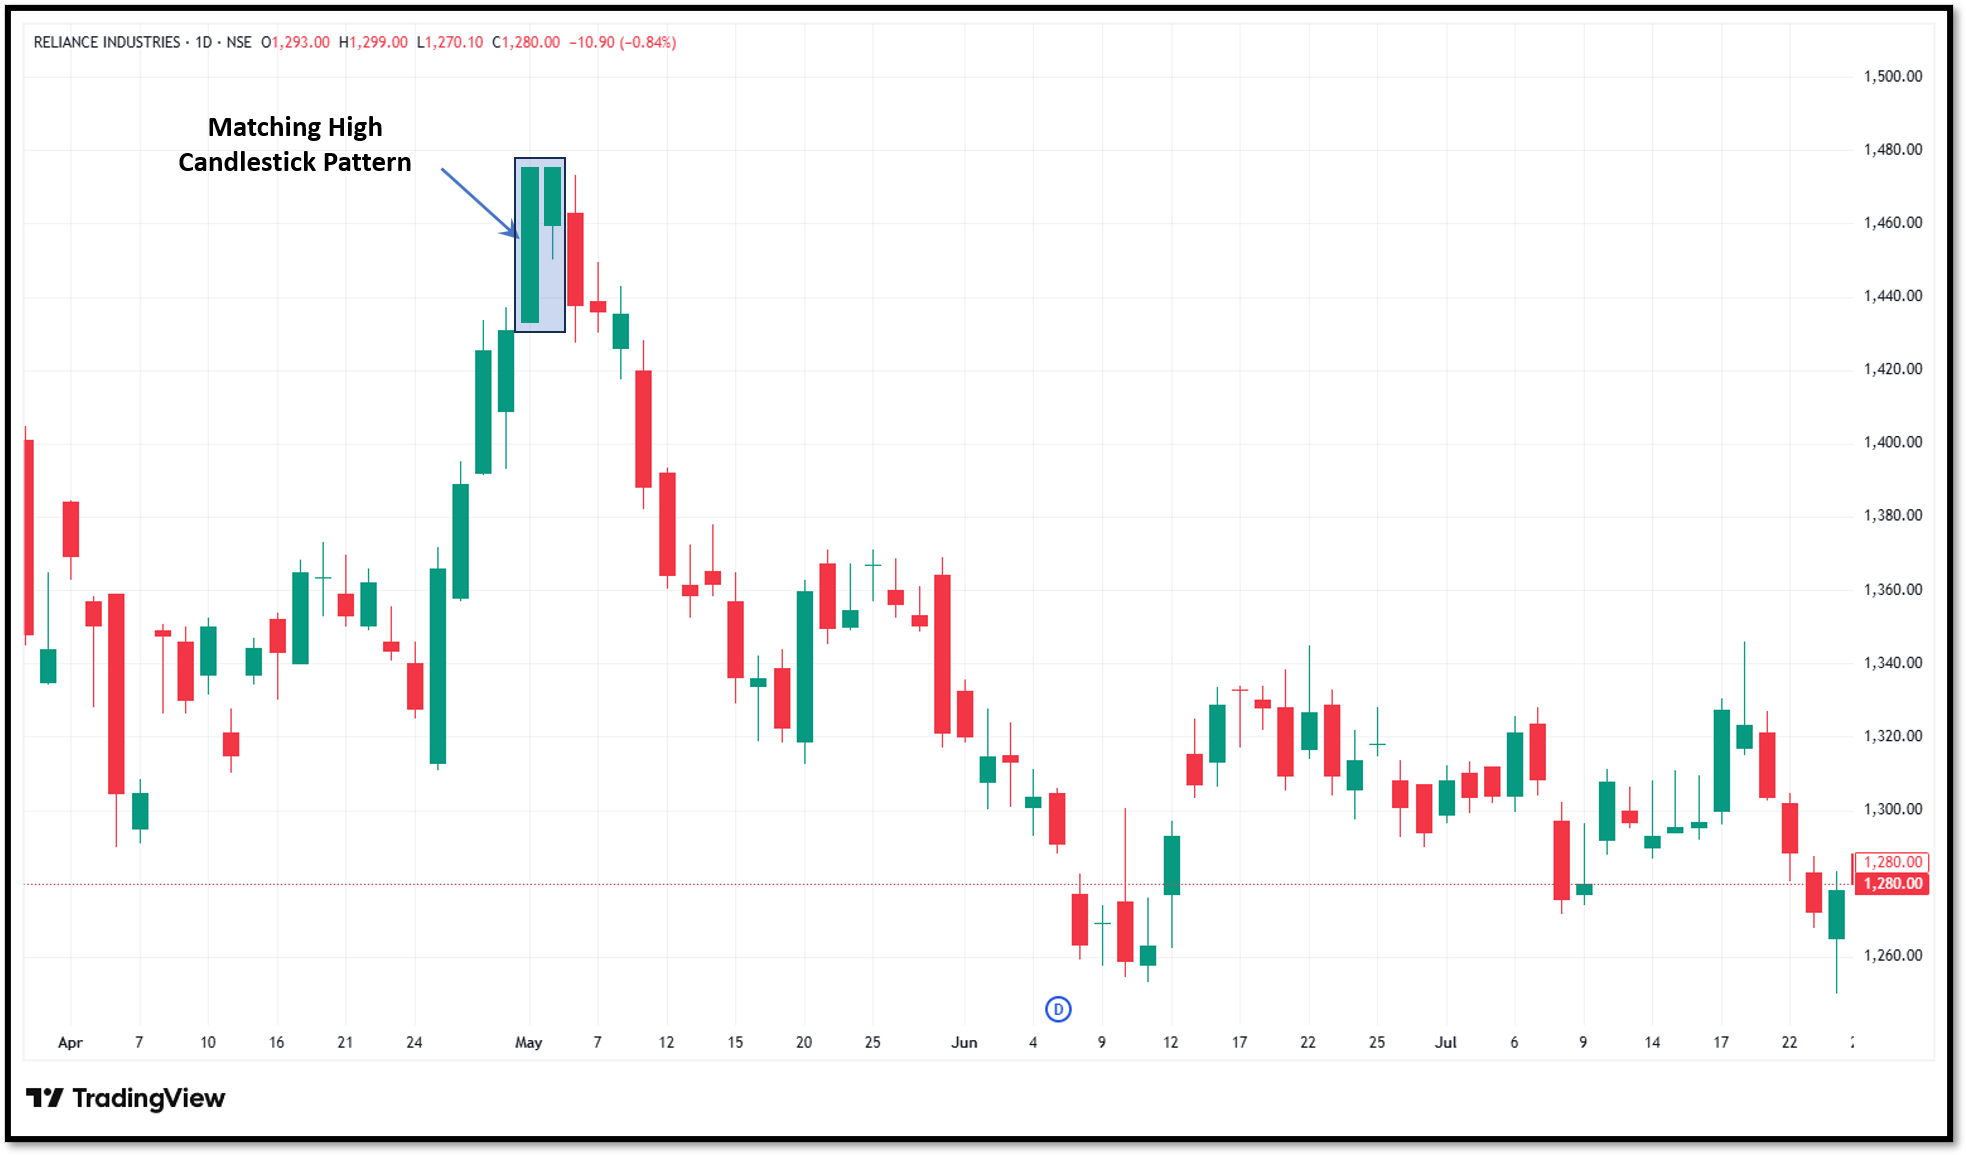
Characteristics of the Matching High Pattern
Some of the key characteristics include:
It only occurs within an uptrend. The pattern holds no significance in sideways or declining markets because the signal is that buying momentum is losing steam.
Both candles are bullish. Unlike the bearish engulfing pattern, where one candle is bullish and the next is bearish, here both bullish candles close above their respective openings.
The second candle begins with a gap down. In some cases, this can even occur below its opening price. However, buyers come back into the market and push the price up almost equal to first candle close.
The closing prices are nearly the same. This is the defining feature. Both candles trade within a narrow range, creating a horizontal line at the top.
It signals hesitation rather than confirmation. The Matching High pattern implies that the current uptrend may be running out of steam, but it does not confirm a reversal on its own. Traders wait for extra confirmation like a bearish candle or a drop below a support line before making a trade decision.
Matching High vs Tweezer Top pattern
Initially, matching high and Tweezer Top patterns appear similar as they both occur after an uptrend and point towards a possible bearish reversal. But they are quite different in their formation, market psychology and trading implications.
Matching High pattern is formed when two bullish candles end at almost the same price level. It signifies that the bulls' power is fading gradually; even though they dominated in both sessions, they could not push prices higher for a third consecutive close.
On the other hand, the Tweezer Top occurs when two consecutive candles have nearly the same high levels. The second bar may be either a bullish or bearish bar; however, it is important to note that the market keeps rejecting the exact same price level. Most often this indicates stronger resistance and an intense conflict between buyers and sellers.
How to identify a Matching High Candlestick Pattern
Before treating any formation as a matching high, verify all of the following:
Strong uptrend
The first step is to identify a clear uptrend. As a reversal pattern, Matching High is more effective during an extended upward trend than in a sideways market.
Identify the initial bullish candle
The first candle in the pattern must be a bullish candle, indicating that buyers are in control, and the close of the candle is higher than the open.
Look at the second candle
The second candle should also be bullish. But its closing price has to be the same as or close to the first one.
Check the market context
One should also check where the pattern appears. Traders usually consider a strong signal when the pattern appears near the resistance level, or after an extended rally.
Use indicators to confirm
Finally, technical indicators such as the Relative Strength Index, MACD and moving averages will help to confirm the momentum behind a breakout before you enter a trade.
How to trade the Matching High Candlestick Pattern
Once you have identified a valid matching high pattern, the next step is executing a disciplined trade. Here are the step-by-step instructions:
Wait for confirmation
Do not trade immediately after the pattern forms. Wait for the bearish confirmation candle to close in a clear direction before making a trade. Entering too early without confirmation is one of the fastest ways to get caught in a false signal.
Plan the entry
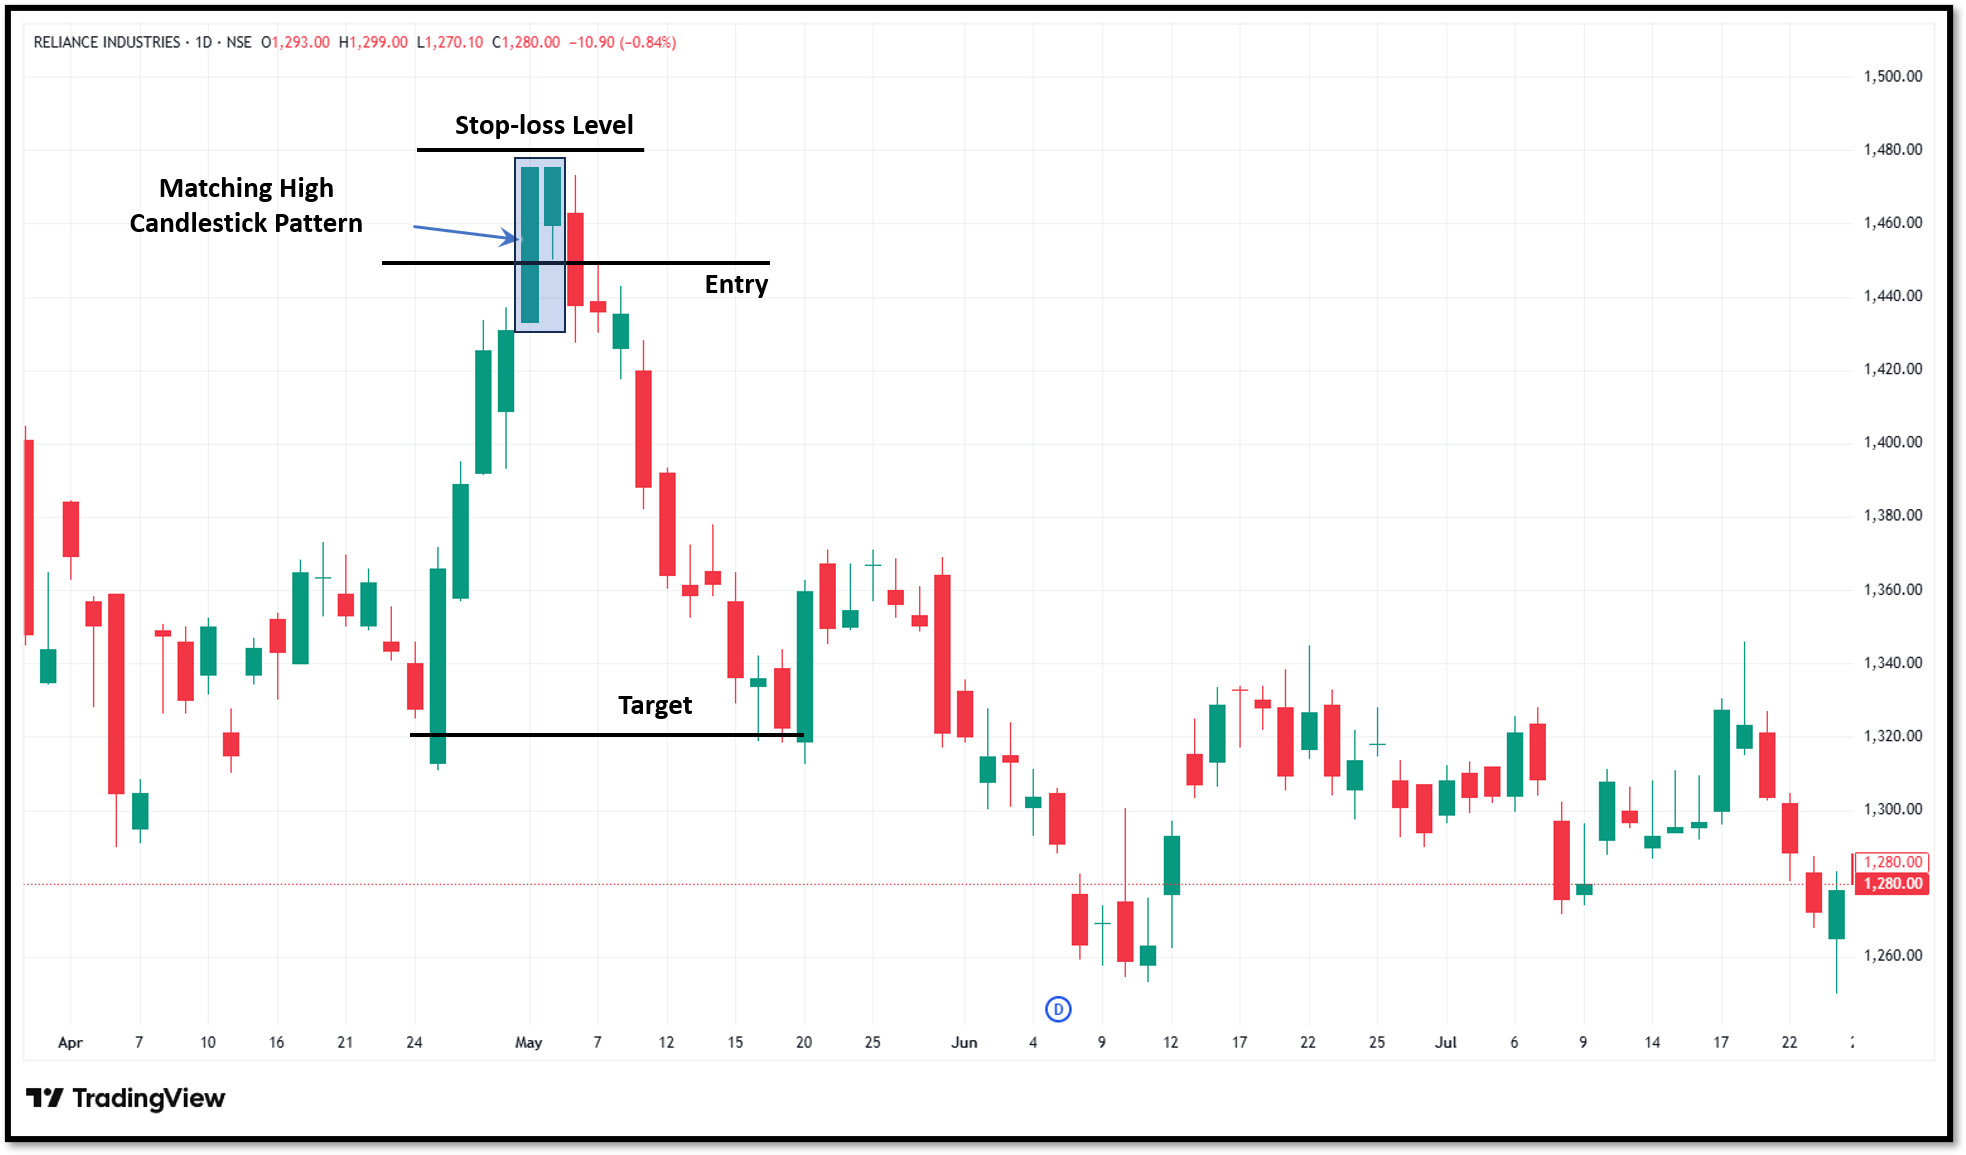
Traders choose to enter the trade once the second candle has closed. However, waiting for a break below the low of the second candle offers extra confirmation and thus a safer entry point.
Set stop loss
Place a stop-loss effectively for risk control. Normally, traders set their stop-loss above the high of the two bullish candles or near the resistance level to manage their capital if the market moves against their position.
Target setting
Set profit targets using previous trend measurements or key support and resistance levels to secure profits while upholding risk management principles.
Combine it with technical indicators
Traders use technical indicators like Relative Strength Index, MACD, and Moving Averages to confirm a potential reversal. If multiple technical indicators point in the same direction, traders feel more confident in their trading strategy.
Advantages of the Matching High Candlestick Pattern
Some advantages of the Matching High pattern are:
Easy to spot: It does not require any difficult calculations or advanced technical knowledge, as two bullish candles with almost similar closing prices can be easily identified on a candlestick chart.
Provides an early warning sign for a reversal: It warns traders about weakening buying pressure before a clear downtrend starts.
Improves trade planning: The pattern provides distinct points for entry, stop-loss, and target levels, making trade planning and risk management a simpler process.
Works on multiple timeframes: It can be applied across various time frames, making it suitable for both swing traders and long-term position traders.
Works across markets: The pattern is found in stocks, indices, forex, commodities, and even cryptocurrencies, providing opportunities to trade with various market players.
Limitations of the Matching High Candlestick Pattern
Some limitations of the Matching High pattern are:
Performance depends on market conditions: The reliability of continuation patterns depends on the strength of the preceding trend and market sentiments.
Always needs confirmation: The pattern does not confirm a trend reversal on its own, so it always needs confirmation.
Can produce false signals: Not every pattern results in a trend reversal. If the buying pressure is high, then price can still rise.
Less reliable in low trading: The pattern is less reliable in stocks having low trading volume, where price movements are unpredictable and erratic.
Relatively rare: Compared with other popular patterns such as the Doji or Engulfing, it occurs relatively less.
Tips for using the Matching High Candlestick Pattern
Here are some important tips traders should consider before entering a trade:
- Identify the current trend first and then consider the pattern, since the pattern is most effective after a sustained uptrend.
- Wait for a bearish confirmation signal, like a strong red candle or a break below the support level, before entering into a trade position.
- Make use of a volume analysis to check if there is an increase in the selling pressure once the pattern is formed.
- Determine your risk-to-reward ratio before entering a trade. Never risk a large amount of capital on one trade.
- Never engage in any trading activity without placing a stop loss order. If the breakout turns out to be false, a stop loss order can help limit the financial losses.
Wrapping up
The Matching High candlestick pattern is used to identify potential changes in market sentiment right after an uptrend. Although it indicates weakening buying power, it is most effective when combined with additional indicators. Using this pattern along with proper risk management strategies and a complete technical analysis framework enables traders to take well-informed trading decisions.
FAQs
1. How does the Matching High pattern show a possible trend reversal?
The Matching High pattern occurs at the end of an uptrend with two bullish candles closing near the same level. This indicates that buying power is decreasing and a bearish reversal may occur if the next candle confirms the drop.
2. Are all the candles within the Matching High green in colour?
Yes, this pattern is usually made up of two bullish green candles. Even though there are slight differences in size or wick length, the most important aspect is that the closing prices of these two candles are close to each other.
3. What is the significance of the wick structure in a Matching High?
A longer lower wick in the second candle indicates higher selling pressure, making the pattern stronger by confirming rejection. Wicks that show failed continuation increase the reliability of the Matching High.
4. Should I use the Matching High to exit long trades?
Certainly, the Matching High indicates that the uptrend is weakening. It shows a short-term top when appear close to resistance levels. Closing or reducing long positions at such levels can help limit any potential losses.
5. How does the Matching High pattern differ from other bearish reversal signals?
In contrast to other bearish reversals, which depend upon intense selling pressure for validation, the Matching High pattern indicates a decrease in buying momentum via two candles closing at almost equal levels. The pattern works best when it occurs near resistance levels and is backed by confirming signals.







