



Morning Doji Star







Key takeaways:
- The Morning Doji pattern signals potential bullish reversals after sustained downtrends as market sentiment shifts.
- Investors must confirm the pattern using volume and technical indicators, in addition to following disciplined risk management before trading.
- You can use the pattern across different asset classes, but confirmation is required through other indicators.
There’s no denying that you enter the market hoping to spot a trend reversal before everyone else. Several factors like news, earnings, and economic events influence prices. However, the earliest cues are defined by price action. That’s why traders and investors turn to candlestick patterns for technical analysis.
The Morning Doji Star is a commonly identified bullish reversal pattern that investors map on charts. This pattern demonstrates a gradual shift in market sentiment instead of an instant reversal. It shows how sellers start losing momentum, which brings uncertainty to the market. Later, buyers regain control of prices.
This blog discusses the psychology behind the pattern and how to execute trades with proper risk management.
What is a Morning Doji Star?
The Morning Doji Star is a bullish reversal candlestick pattern that investors can track after a sustained downtrend. It indicates a weakening bearish momentum as buyers prepare to take control.
A Morning Doji Star pattern consists of three candles.
- A long bearish candle shows selling pressure
- Then, a Doji candle shows indecision between buyers and sellers
- Third, you’ll notice a strong bullish candle that shows buyers re-entering the market
The Doji is the defining feature of this pattern, where the opening price is almost equal to the closing price. It shows that neither buyers nor sellers have clear control, which makes it an important turning point in market psychology.
The Morning Doji Star pattern is different from a regular Morning Star pattern, which may have a small-bodied candle in the middle. The Morning Doji Star specifically requires a Doji, where the opening and closing prices are almost identical. That’s why the reversal signal is stronger in many cases.
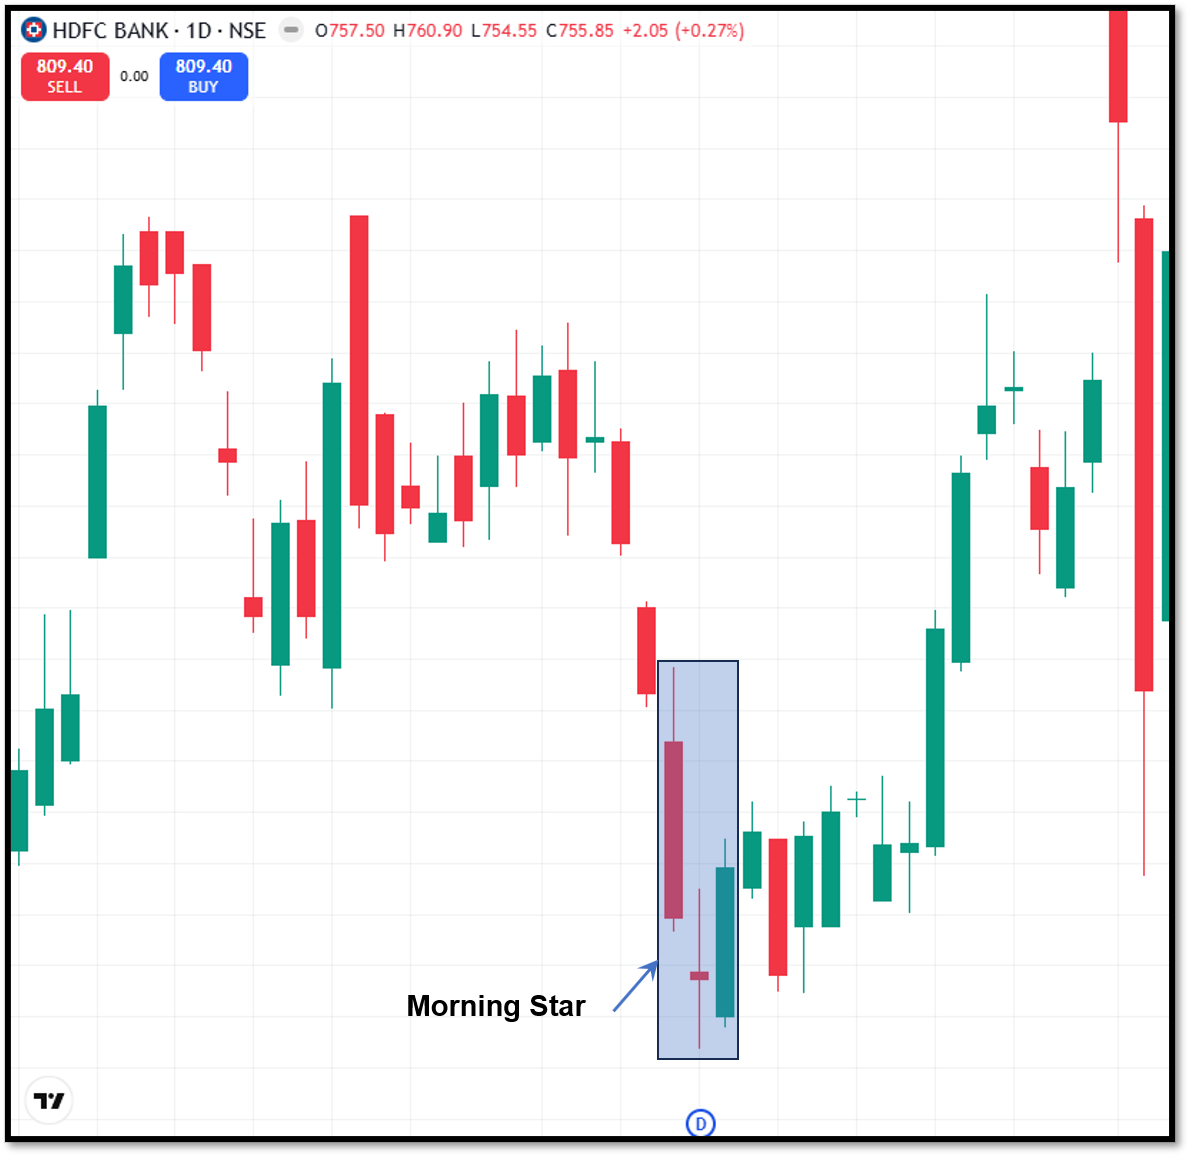
Components of a Morning Doji Star pattern
Let’s break down the structure of the Morning Doji Star pattern. It consists of three candles, each of which reflects different sentiments in the market.
First candle - Strong bearish candle
As you look at the pattern, you would notice a long bearish candle first that shows a continued downtrend. At this stage, sellers dominate the market, and sentiment remains negative. Most traders still believe that the prices will continue to fall.
Second candle - Doji
The second candle has a very small body. It is a typical Doji, where the opening and closing prices are almost identical. The prices are pushed in both directions by buyers and sellers during the session. However, neither gains an advantage in the end.
The second candle shows that the market is losing its bearish momentum, but it’s not an immediate bullish reversal. As investors reassess the direction, the market pauses for a while.
Third candle - Strong bullish candle
The Morning Doji Star pattern is confirmed by the final candle. Buyers aggressively step in, which produces a long bullish candle. This candle closes well into the body of the first bearish candle. If the stock witnesses higher trading volume, this candle further strengthens the reliability of the reversal.
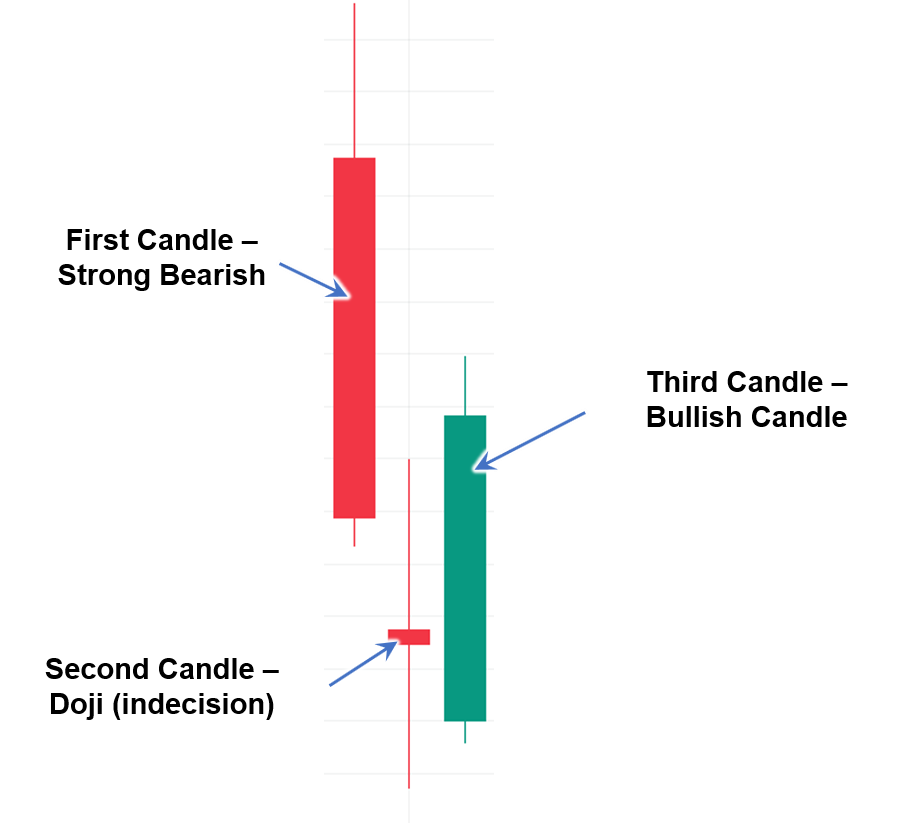
How the Morning Doji Star forms
The structure of the Morning Doji Star pattern reflects changing psychology in the market.
Sellers initially remain in control, and they push the prices lower. However, selling pressure starts fading in the second session, as buyers gradually absorb the supply. Eventually, this counter-pressure from buyers creates the Doji. The balance of power starts shifting, although no clear trend emerges yet.
As buyers take control and push prices higher, the third session confirms the bullish reversal. This transition from strong selling to indecision and then the bullish momentum makes the Morning Doji Star a reliable reversal pattern.
Sometimes, this pattern appears close to the support level, which makes it even stronger. Higher trading volumes at this stage add to the confidence of buyers.
How to identify a Morning Doji Star
In the first place, you must be sure that the market is in a clear downtrend. The pattern loses most of its significance without an existing decline. While studying the candlesticks, look for characteristics like:
- An existing downtrend
- A long bearish first candle
- A Doji appearing in the second candle
- A strong bullish third candle that closes well into the body of the first candle
- The third candle also shows rising volume
- The pattern may form near a support level, moving average, or Fibonacci retracement
Traders often use this checklist to avoid false signals.
How to trade using the Morning Doji Star pattern
Once you identify a Morning Doji Pattern, map out a disciplined trading process to improve consistency. Below is a step-by-step process to use this candlestick pattern in your trading decisions.
Step 1: Confirm the downtrend
In the first place, make sure that the market has been making lower highs and lower lows before the pattern appears. The Morning Doji Star pattern reverses that existing bearish trend, and it doesn’t have any relevance in a sideways market.
Step 2: Wait for the pattern to complete
Do not enter a trade just after the Doji appears. The pattern is valid only after the closure of the third bullish candle.
Step 3: Look for confirmation
To confirm the pattern, combine it with other technical indicators like:
- Higher trading volume
- RSI moving out of oversold territory
- Bullish MACD crossover
- Strong support zones
- Moving averages
Step 4: Plan your entry
If you’re an aggressive trader, you may enter the trade just after the closure of the third candle. However, conservative traders often wait for the price to break above the high of the third candle before they enter the trade.
Step 5: Place stop-loss and profit target
Before entering the trade, work on your risk management strategy. Usually, traders place their stop-loss below the low of the Doji. Based on nearby resistance levels, you may place the target with a 1:2 or 1:3 profit ratio. You may also consider trailing your stop-loss as the trend develops.
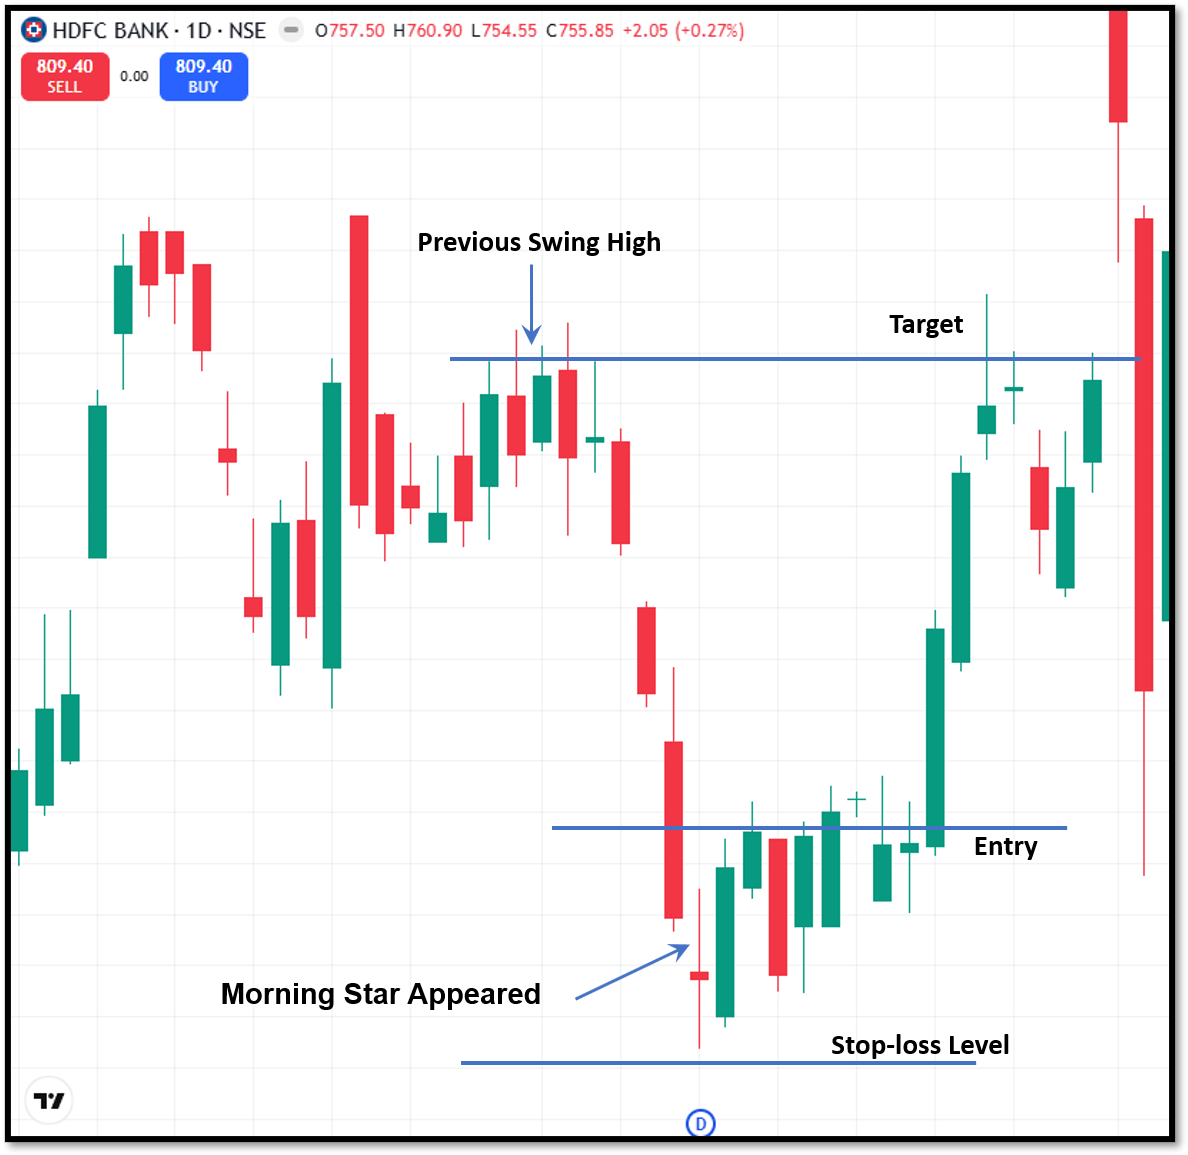
Morning Doji Star vs Morning Star
Both the Morning Doji Star and Morning Star patterns closely resemble bullish reversal patterns. Moreover, both these patterns consist of three candles and appear after a downtrend. The middle candle defines the only difference between these two patterns.
In a Morning Star pattern, the second candle may be any small-bodied candle. However, in a Morning Doji Star, it must specifically be a Doji. This candle implies stronger indecision between buyers and sellers.
Therefore, many traders consider the Morning Doji Star to be a slightly stronger signal for reversal.
Wrapping up
The Morning Doji Star captures a gradual shift in market sentiment, which makes it one of the most reliable bullish reversal patterns. However, no candlestick pattern guarantees success, so traders must also evaluate other signs like rising volume and strong support levels.
Successful trading is about following a disciplined process and managing risk consistently. Practically, not every move in the market can be predicted, so the more logical approach for traders is to wait for high-probability setups. With the correct approach, the Morning Doji Star pattern can become a valuable tool to identify potential trend reversals for buyers.
FAQs
Can the Morning Doji Star be used for intraday trading?
Yes, you can use the Morning Doji Star pattern on intraday charts with short timeframes like 5-minute, 15-minute, and hourly intervals. However, lower timeframes also come with lots of news and updates, so traders must rely on other indicators like volume and support levels.
Is the Morning Doji Star more reliable than a Morning Star?
The Morning Doji Star pattern is considered slightly more reliable than the Morning Star pattern as the Doji reflects stronger indecision in the market compared to an ordinary small-bodied candle. However, both these patterns must be confirmed by the third candle before a trade is initiated.
Which indicators work best with the Morning Doji Star?
Traders use popular confirmation tools like the RSI, MACD, moving averages, support and resistance levels, Fibonacci retracement levels, and trading volume while relying on this pattern.
Does the pattern work across all asset classes?
Yes. The Morning Doji Star pattern is based on price action. So, you can use it for trading all asset classes like equities, indices, commodities, forex, and cryptocurrencies. The reliability of this pattern depends more on market conditions than the asset itself.
Can the Morning Doji Star guarantee a bullish reversal?
No, it only indicates the probability of a bullish reversal. Traders must focus on risk management and use confirmation signals for disciplined execution.







