



Two Crows Candlestick Pattern




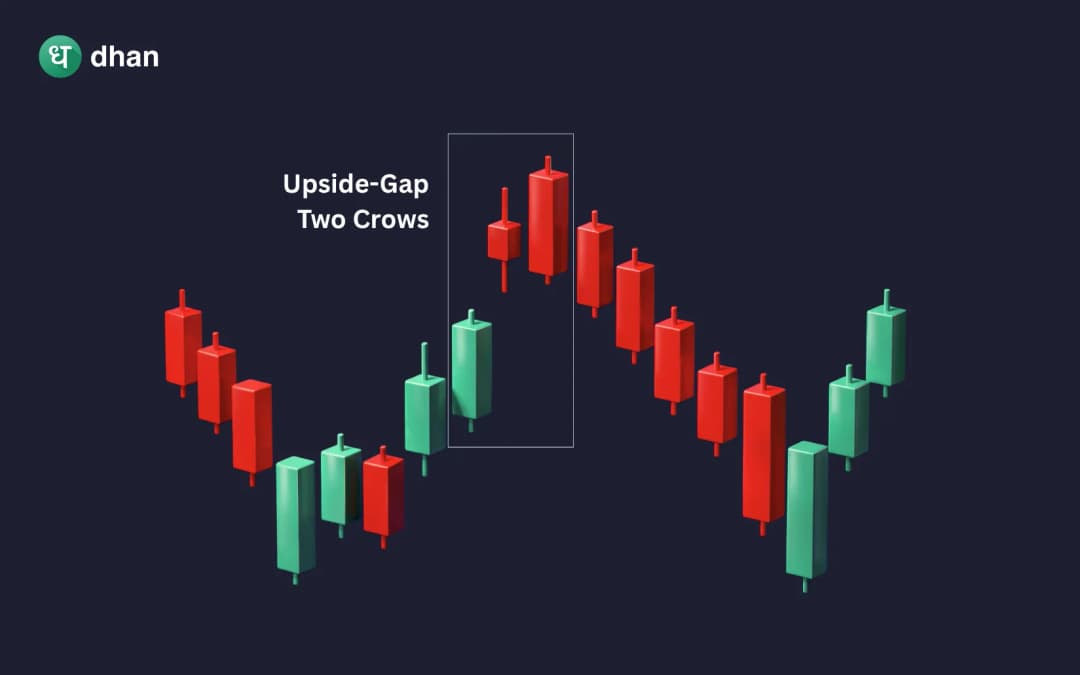




Many traders use technical analysis just to identify where prices are moving. In reality, technical analysis can also help you recognise when an existing trend may be losing momentum. This is where candlestick patterns become useful, as they help traders with visual clues about the shifting balance between buyers and sellers.
The two crows candlestick pattern is one of the uncommon bearish reversal patterns, which is still important for traders. It appears after an uptrend and suggests weakening buying pressure.
Although this pattern alone does not guarantee a reversal, it acts as an early warning that the market may be approaching a turning point. In this guide, we have comprehensively discussed what the Two Crows candlestick pattern is, how it forms, and how you can identify it. From this guide, you can also learn how to use it in your trading strategies.
What is the Two Crows Candlestick Pattern?
The two crows candlestick pattern is a bearish reversal pattern that usually appears after an existing uptrend. It indicates that sellers are gradually regaining control over the market, and the bullish momentum is weakening.
However, the two crows candlestick pattern is different from other bearish reversal patterns that show an immediate shift in sentiment. This pattern shows a gradual change in market control. Initially, buyers remain optimistic and continue to push prices higher. However, when two consecutive bearish candles appear, they suggest increasing selling pressure despite the sustaining bullish momentum.
The two crows candlestick pattern suggests the possibility of a downward reversal. However, traders generally wait for additional confirmation before they enter a trade. The reliability of the signal improves with additional confirmation like higher trading volume, resistance levels, and technical indicators.
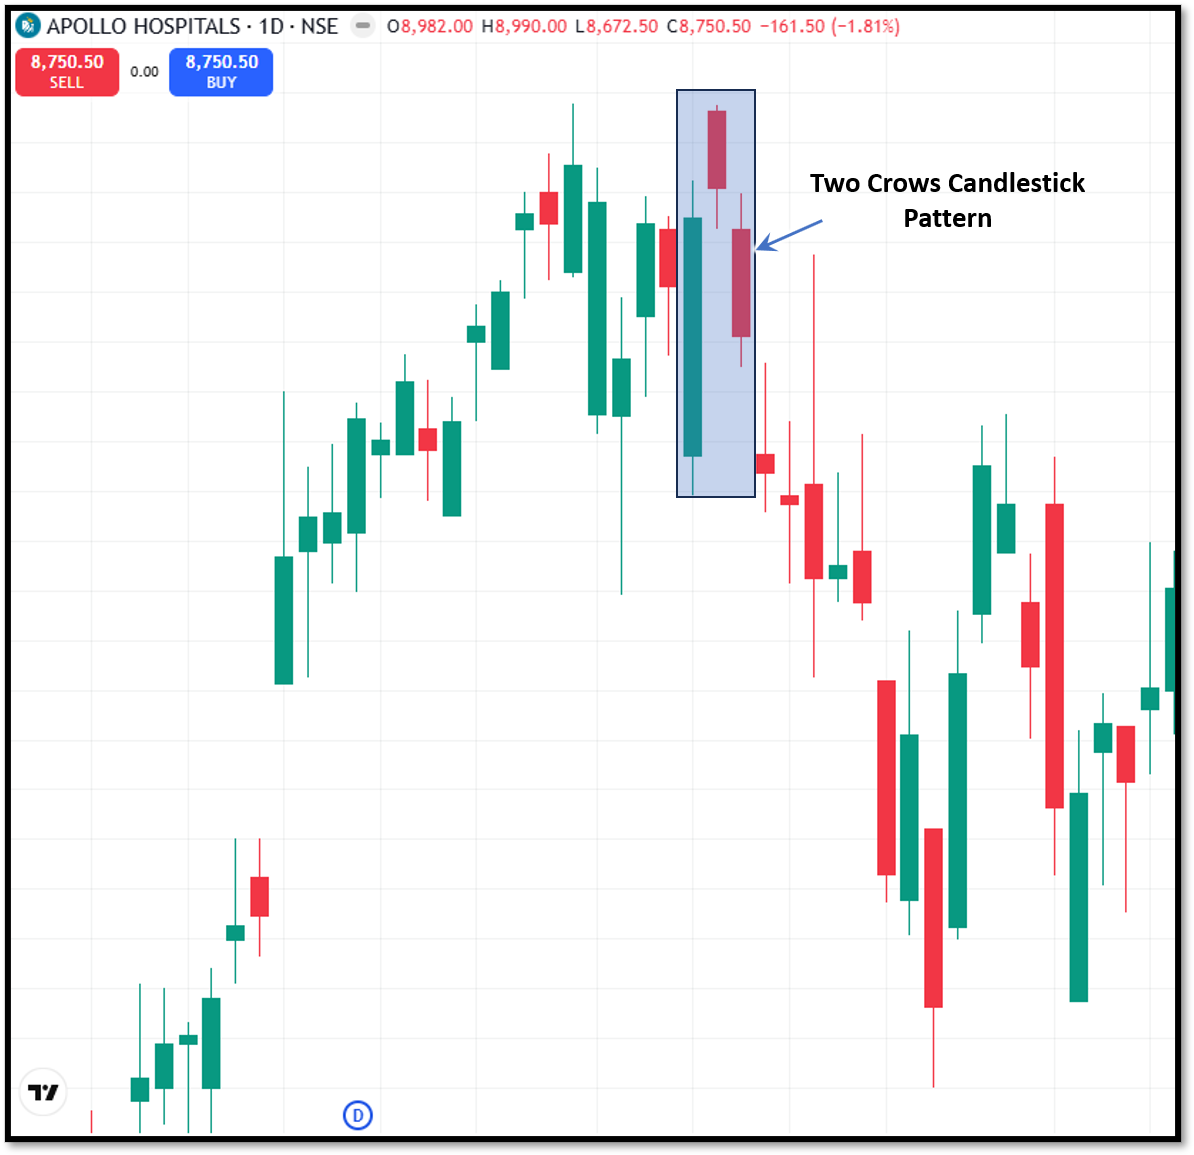
Components of the Two Crows Candlestick Pattern
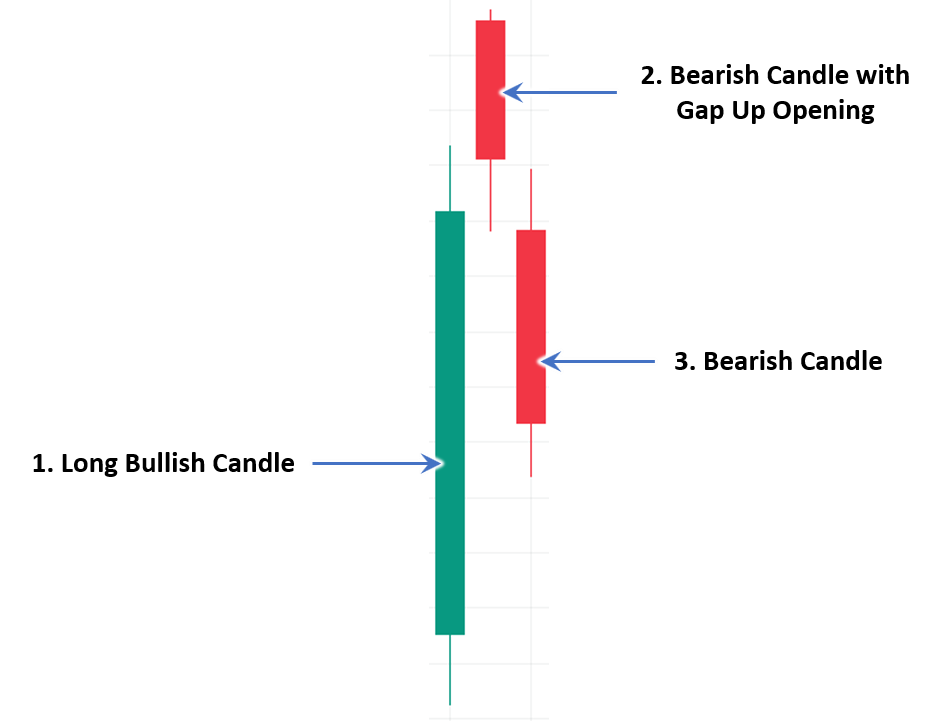
Each candle in the two crows candlestick pattern plays a specific role, which makes it easier for traders to understand the market psychology.
First candle - strong bullish candle
A long bullish candle comes first, which shows the prevailing uptrend. At this stage, buyers remain strongly in control of the market. Optimism levels are high, and prices continue to rise. Most market participants expect that the bullish trend will extend further.
Second candle - bearish candle with an upward gap
The second candle is a bearish one that opens above the previous bullish close. It reflects continued enthusiasm among buyers at the beginning of the session. However, sellers gradually start dominating the market and push prices lower.
As a result, the candle closes below its opening price. The market still trades above the first candle due to the upward gap, but this bearish close is the first indicator that the momentum is weakening.
Third candle - bearish candle closing within the first candle
The bearish signal is further strengthened by the third candle. It generally opens near the previous candle but continues to move lower throughout the session. This candle closes inside the body of the first bullish candle by the end of the trading period.
It suggests that sellers have gained greater control of the market and buyers can no longer maintain the upward momentum. The deeper this candle closes into the first bullish candle, the stronger the potential bearish reversal may become.
How to identify the Two Crows Candlestick Pattern on a Chart
The two crows candlestick pattern involves three candles, but traders must do more than identify them. They also need to evaluate the prevailing trend and the supporting conditions in the market. Accordingly, they can determine whether the pattern carries any significance.
When a well-formed pattern appears in the right context, the signals are stronger than the one that develops during sideways price movement.
Confirm the Existing Uptrend
As the two crows pattern is a bearish reversal pattern, it must always appear after a well-established uptrend. Traders must look for a series of higher highs and higher lows, or prices that consistently trade above important moving averages.
The stronger the preceding rally, the more significant the potential reversal becomes. If the market has been moving sideways, there is no dominant bullish trend to reverse. This makes the pattern far less reliable.
Verify the three-candle structure
Once you confirm the trend, examine the candles carefully. The pattern should contain:
- A strong bullish candle that shows the continuing uptrend
- A bearish candle opening with an upward gap.
- The second bearish candle that closes inside the body of the first bullish candle.
If any of the candles are missing or significantly altered, the validity of the setup is lost.
Look for additional confirmation
Professional traders look for additional confirmation beyond candlesticks. They strengthen their analysis using other technical tools like:
- Higher trading volume during the bearish candles
- RSI moving lower from overbought territory
- A bearish MACD crossover
- The pattern forms near an important resistance level
- The pattern also confluences with trendlines or moving averages
When multiple confirmation signals are visible, there’s a higher probability of a successful reversal.
How to trade using the Two Crows Candlestick Pattern
The first step for traders is to identify the pattern. A disciplined approach to trading helps you avoid emotional decisions and improve consistency over time. Here’s how you can use the two crows candlestick pattern for trading.
Step 1: Confirm the uptrend
In the first place, verify that the market has been moving higher for a significant period. The pattern should appear after a prolonged rally, which carries greater significance compared to one that forms during a consolidation phase. It’s the quality of the preceding trend that influences how reliable the reversal signal can be.
Step 2: Wait for the pattern to complete
Do not enter the trade immediately after the formation of the second candle. The pattern is actually completed by the third candle, as it provides stronger evidence that sellers have started dominating the market. It’s crucial for all three candles to close to reduce the chances of false signals and prevent premature entries.
Step 3: Confirm the signal with other indicators
The two crows pattern provides an early warning of the weakening bullish momentum. Traders must also seek additional confirmation to improve their confidence before they enter a trade. Some of the common confirmation signals include increasing trading volume during the bearish candles, RSI moving away from overbought levels, and a bearish MACD crossover. Traders must combine multiple signals to improve the quality of the setup.
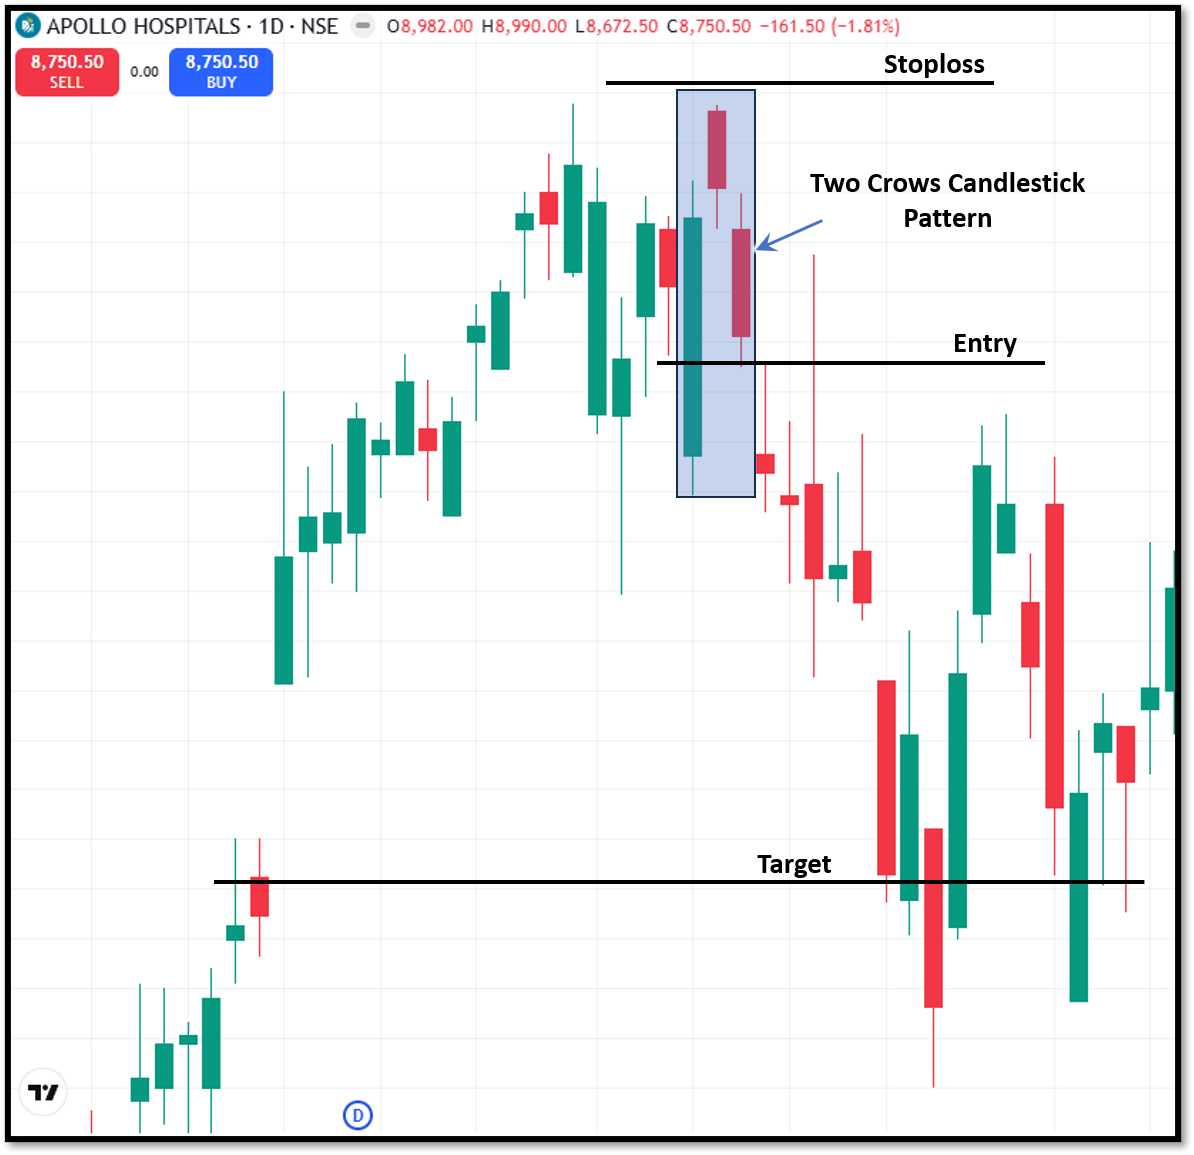
Step 4: Plan your entry
Decide how you want to enter the trade once the pattern is confirmed. Some traders prefer entering the trade immediately after the closing of the third bearish candle, as they expect the reversal to continue. Others wait until the price breaks below the low of the third candle before they enter the trade.
This approach may slightly reduce the potential profits, but it provides additional confirmation that the selling pressure is strengthening. Instead of trying to capture every possible price movement, consistency is more important for traders.
Step 5: Set stop-loss and profit target
Before placing a trade, proper risk management should be in place. Many traders position their stop-loss above the recent swing high or above the highest point of the pattern. If prices move beyond that level, the bearish reversal may have failed.
Consider nearby support levels, previous swing lows, or a predefined risk-reward ratio like 1:2 or 1:3 to set your profit target.
Advantages of the Two Crows Candlestick Pattern
The Two Crows pattern helps traders with several practical advantages when used in the right market conditions.
- The pattern provides an early warning that the bullish momentum is weakening. Traders, therefore, can prepare for a possible reversal before the broader trend changes.
- The two crows pattern can be applied across different financial markets, including stocks, indices, commodities, etc.
- You can apply the pattern on different timeframes, like intraday charts or weekly charts, provided an existing uptrend is visible.
- The pattern can be combined with technical indicators like MACD, moving averages, volume analysis, and resistance levels to strengthen trading decisions.
Limitations of the two crows candlestick pattern
The two crows pattern also has certain limitations that traders should be aware of.
- There’s a chance of false signals, where the market briefly declines before it resumes its original uptrend.
- It’s a relatively uncommon pattern, so it’s less frequently available compared to many other bearish reversal setups.
- During a sideways market, the two crows candlestick pattern is less reliable, as no strong bullish trend exists to reverse.
- External events like economic announcements, corporate earnings, or geopolitical developments can influence the technical signal.
To wrap up
The two crows candlestick pattern is a useful bearish reversal pattern that demonstrates the gradual transition from strong buying momentum to increasing selling pressure. Traders find the pattern more effective when they combine it with trend analysis, trading volume, resistance levels, and technical indicators. Disciplined risk management is equally important, and that’s the reason traders must size their positions appropriately and place stop losses.
The two crows candlestick pattern should not be used as a standalone system. As a trader, incorporate the pattern into a broader approach of technical analysis to identify potential trend reversals and make more informed decisions while trading.
FAQs
Is the two crows candlestick pattern suitable for intraday trading?
Yes. The two crows candlestick pattern can appear on intraday charts like 15-minute, hourly, or 4-hour timeframes. However, the signals tend to be more reliable with higher timeframes as they reduce short-term price fluctuations.
Does the two crows pattern work in markets other than stocks?
Yes. The pattern is based on price action. So, you can apply it across stocks, indices, commodities, forex, etc. The effectiveness of the pattern depends more on market conditions than on the asset being traded.
Can the two crows pattern fail even after confirmation?
Yes, it can fail, as no candlestick pattern guarantees a successful trade. The setup can be disrupted by unexpected news, economic events, announcements of earnings, or changes in market sentiment.
Should beginners use the two crows pattern alone for trading decisions?
No, beginners must combine the two crows candlestick pattern with trend analysis, support and resistance levels, volume, and basic risk management. Trading decisions can improve significantly when multiple forms of confirmation are combined.
How is the two crows pattern different from the upside gap two crows pattern?
Both these are bearish reversal patterns, but the candle structures differ. In the upside gap two crows candlestick pattern, the gap between the bearish candles is more distinct, and it is interpreted in a slightly different way. It is considered a separate candlestick formation in technical analysis.







