SMA vs EMA




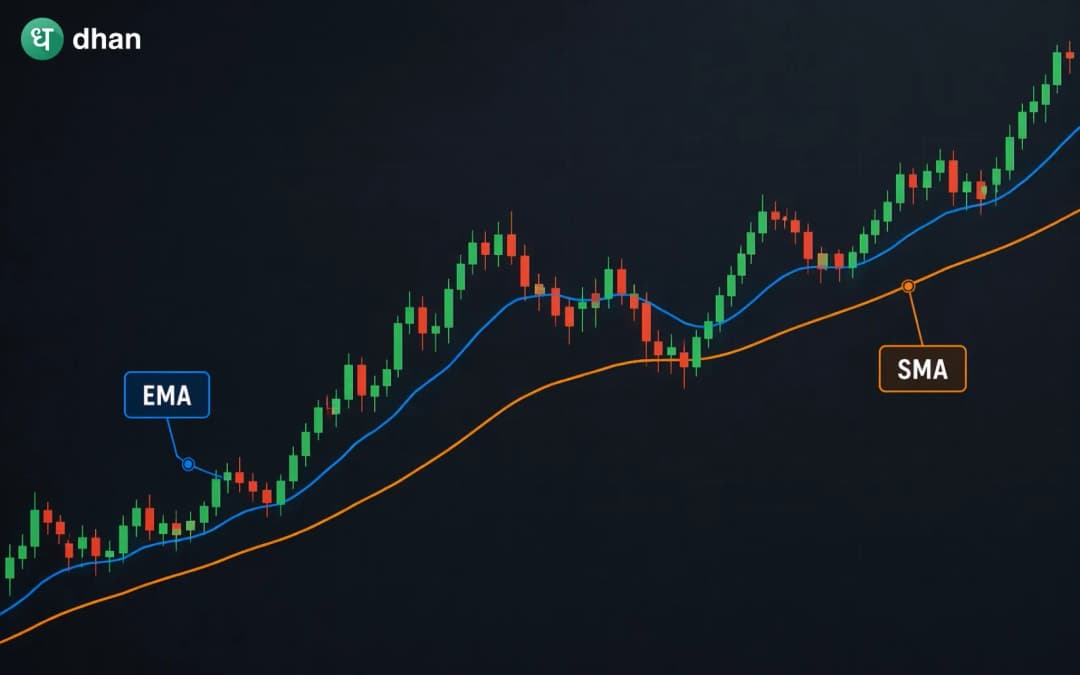




Markets move fast, candles stack up, and before you know it, you’re overanalysing every decision. But some tools make it easier to understand price movements.
The most foundational tools in technical analysis are moving averages, and they have been in use for years. Not to predict the future, but to give a clear picture of trends. Simple enough for beginners, yet relied on daily by experienced investors.
Among the many variations available, two names come up constantly in this space: the Simple Moving Average (SMA) and the Exponential Moving Average (EMA). Both are plotted on price charts. Both track trends. They look similar on a chart, but how they behave, especially during volatile stretches, can be surprisingly different.
Summary Points:
- SMA (usually 50-day or 200-day) is ideal for long-term investors looking to filter out the market noise and confirm the broader macro trend. The EMA (such as the 9-day or 21-day) is the preferred indicator for intraday and swing traders looking for early indications in high-momentum conditions.
- The SMA is a stable, slower-moving line that gives equal weight to all historical data points, while the EMA is more reactive to sudden market changes by assigning more weight to recent prices.
- Most traders often combine the two, such as a fast-moving EMA crossover for exact entry and exit signals, and a long-term SMA (such as the 200-day) to make sure that they are trading in the direction of the prevailing trend.
- One of the most common mistakes is using SMA - EMA crossovers as a guarantee buy/sell signal. They are lagging indicators and can give false signals when used in isolation.
What is a Simple Moving Average (SMA)?
A Simple Moving Average is the most straightforward indicator in technical analysis. It calculates the average closing price of any security over several fixed periods. It is used to smooth short-term price fluctuations and identify trends.
If you’re tracking a 50-day SMA, it sums up the previous 50 closing prices and divides them by 50.
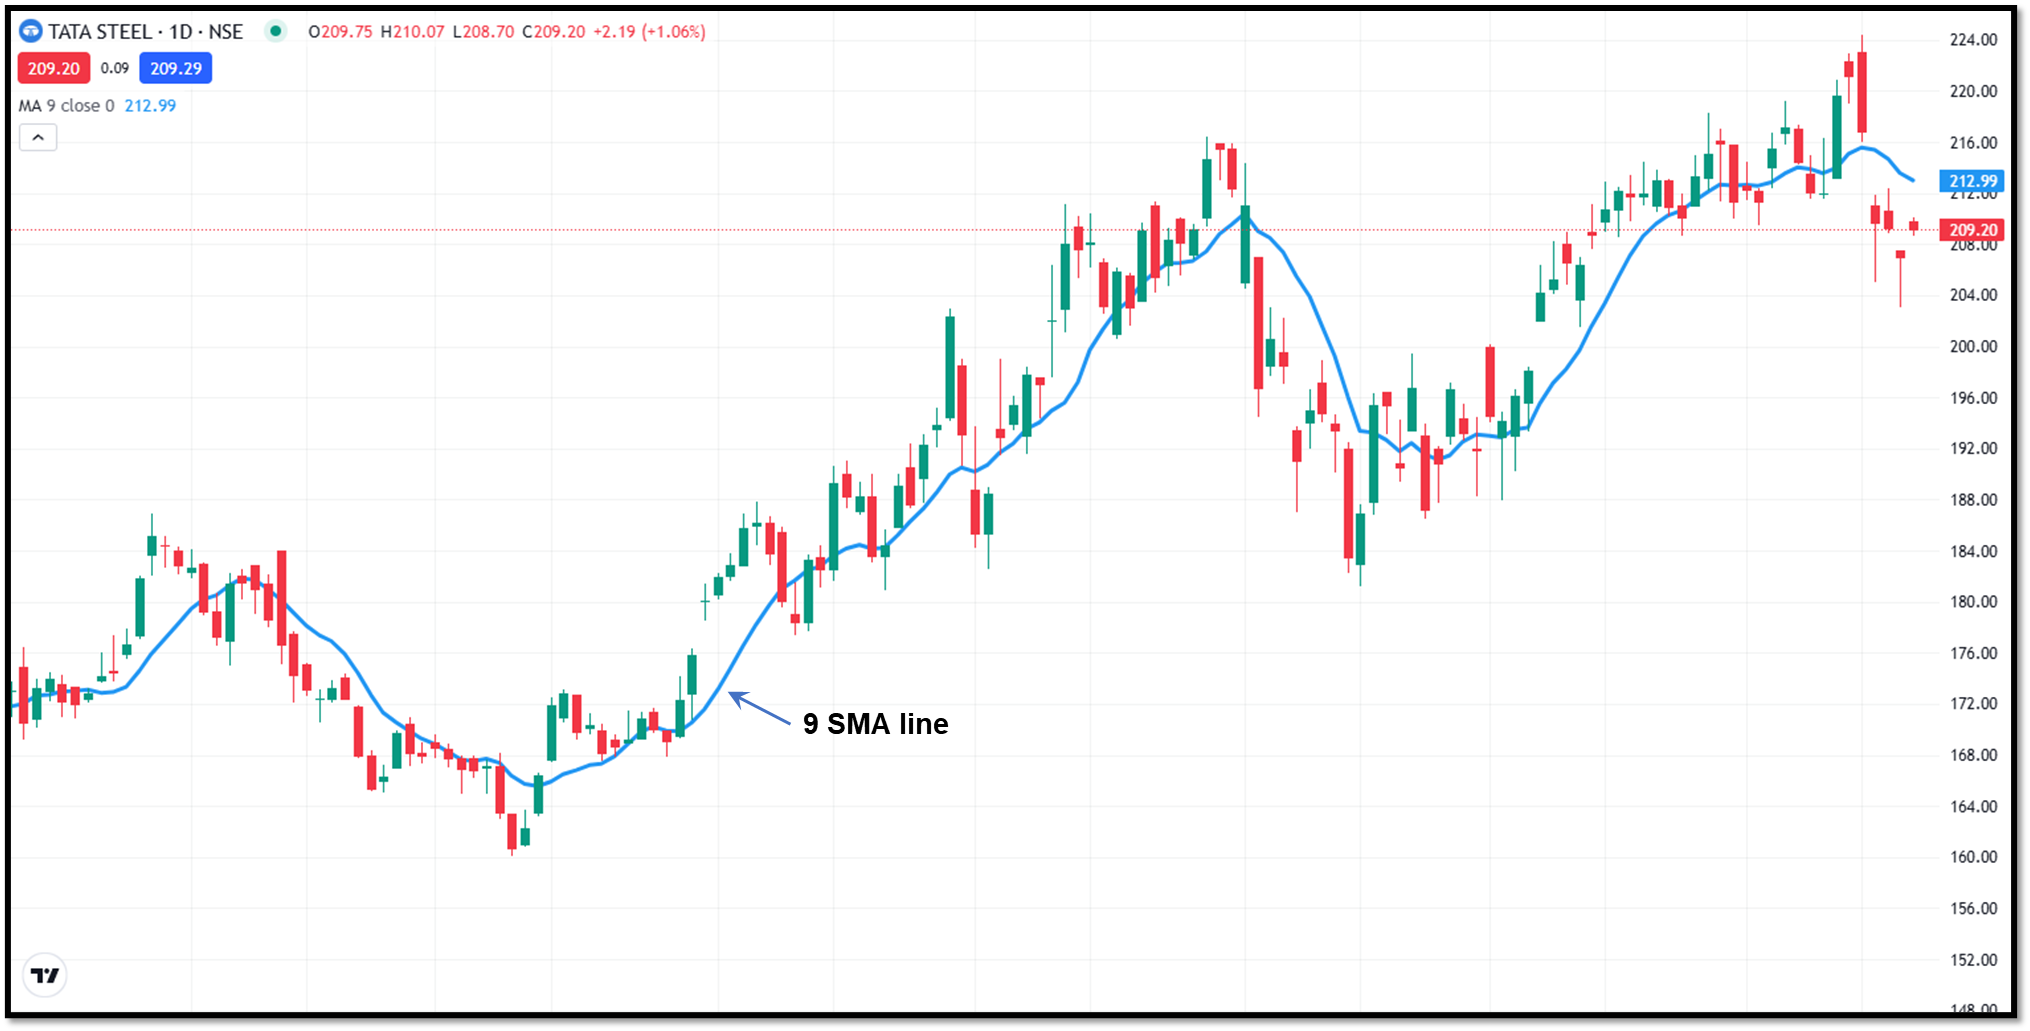
Key characteristics of SMA
- All price data points have equal weight
- Smoother curve, not easily disturbed by short-term volatility
- Best suited for identifying the long-term direction of a trend
- Most referenced benchmarks: 50-day, 100-day, and 200-day SMA
- Use in critical signals like the Golden Cross and the Death Cross
What is an Exponential Moving Average (EMA)?
An Exponential Moving Average does the same job as SMA, but with a different approach. It focuses more on recent price points. If the data is old, it carries less and less influence in the final calculation.
This makes EMA considerably more reactive to current market movements and helps traders identify trend changes at an early stage.
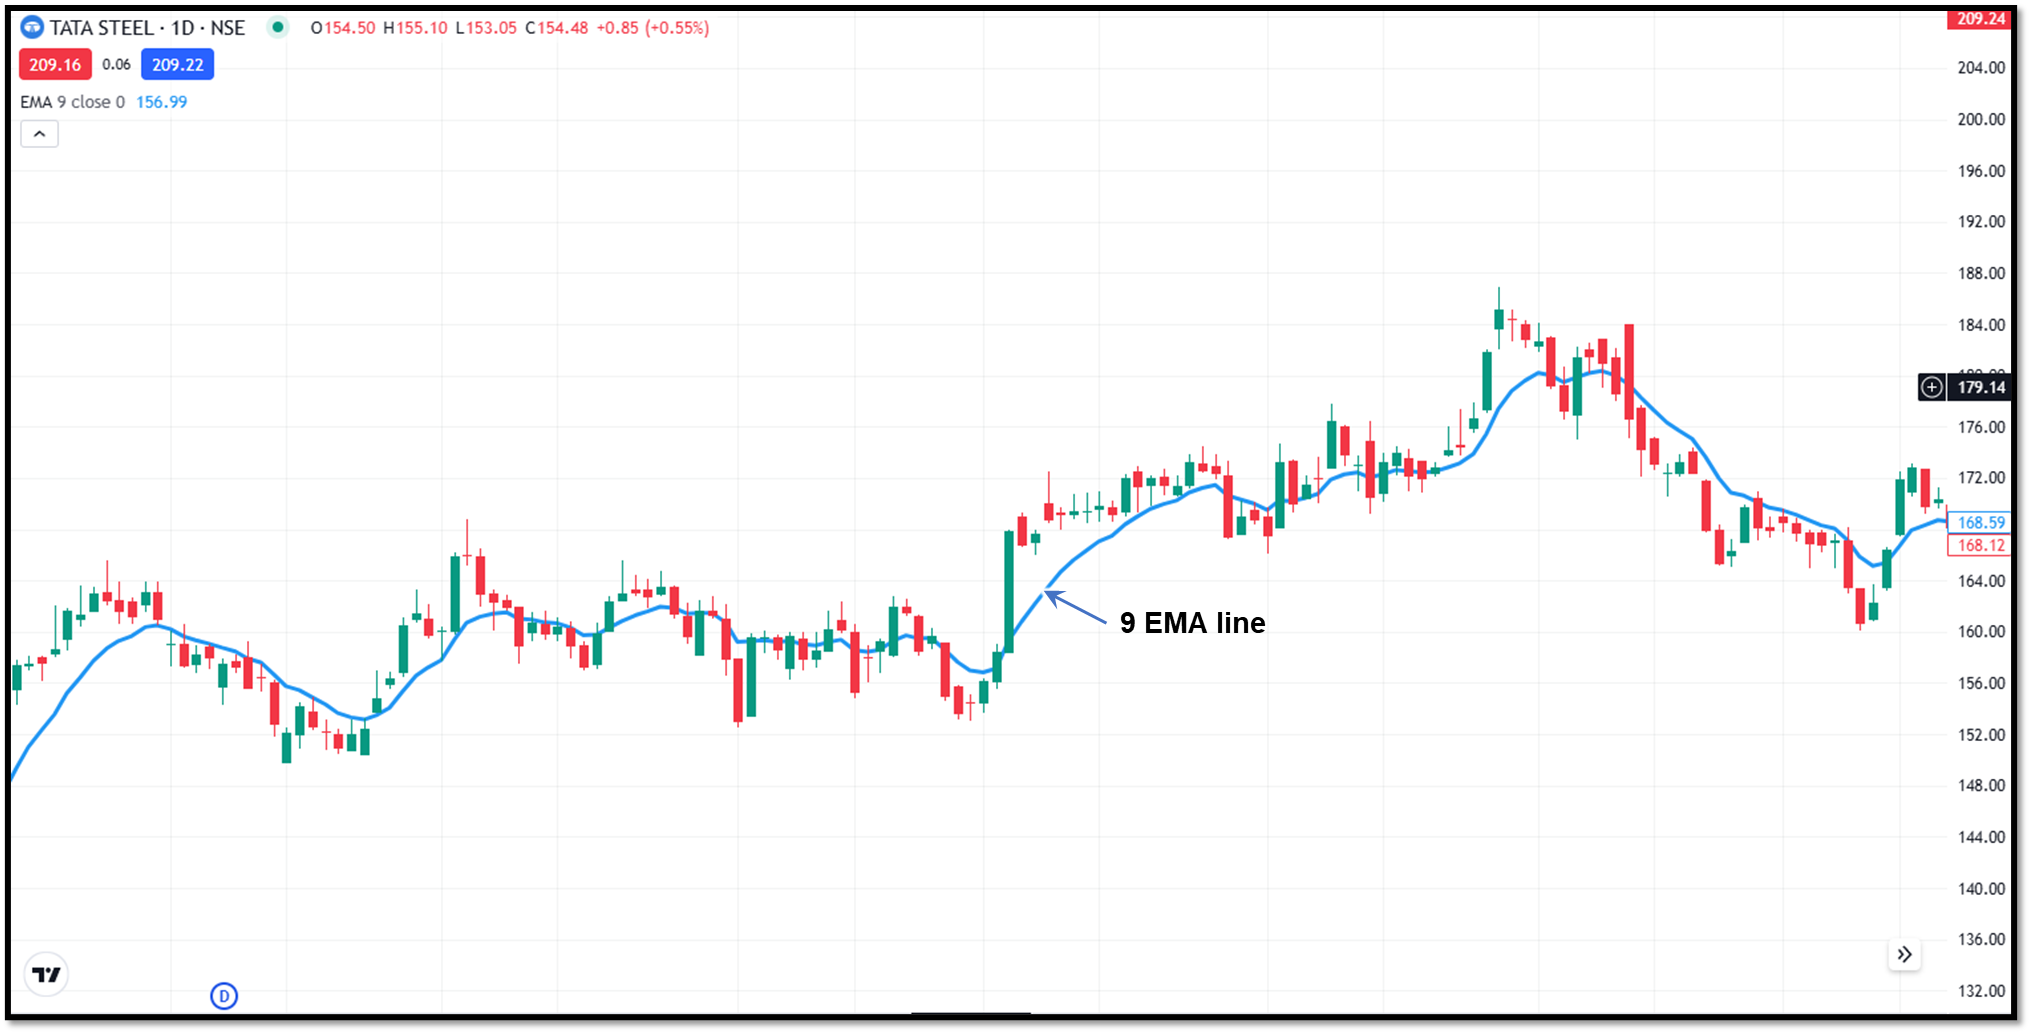
Key characteristics of EMA
- Assigns greater importance to recent prices using a weighted multiplier formula
- More reactive to price change than SMA
- Best utilised in short-term and momentum-based active trading
- Most widely adopted periods: 9-day, 21-day, and 50-day EMA
- Acts as a reliable support or resistance level during strong trends
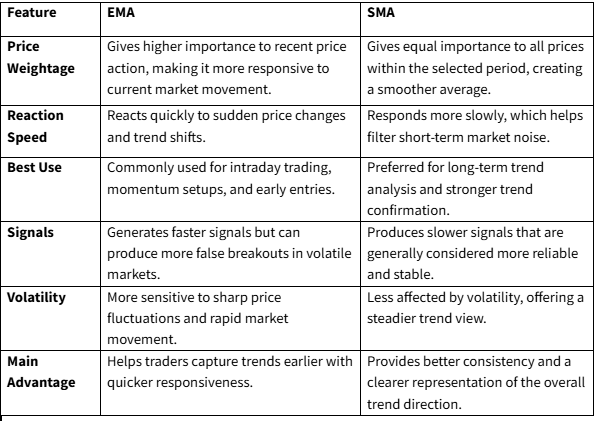
EMA vs SMA: A direct comparison
Here is a comparison between EMA vs SMA.
Popular SMA/EMA strategies
The most popular SMA/EMA strategies are listed below.
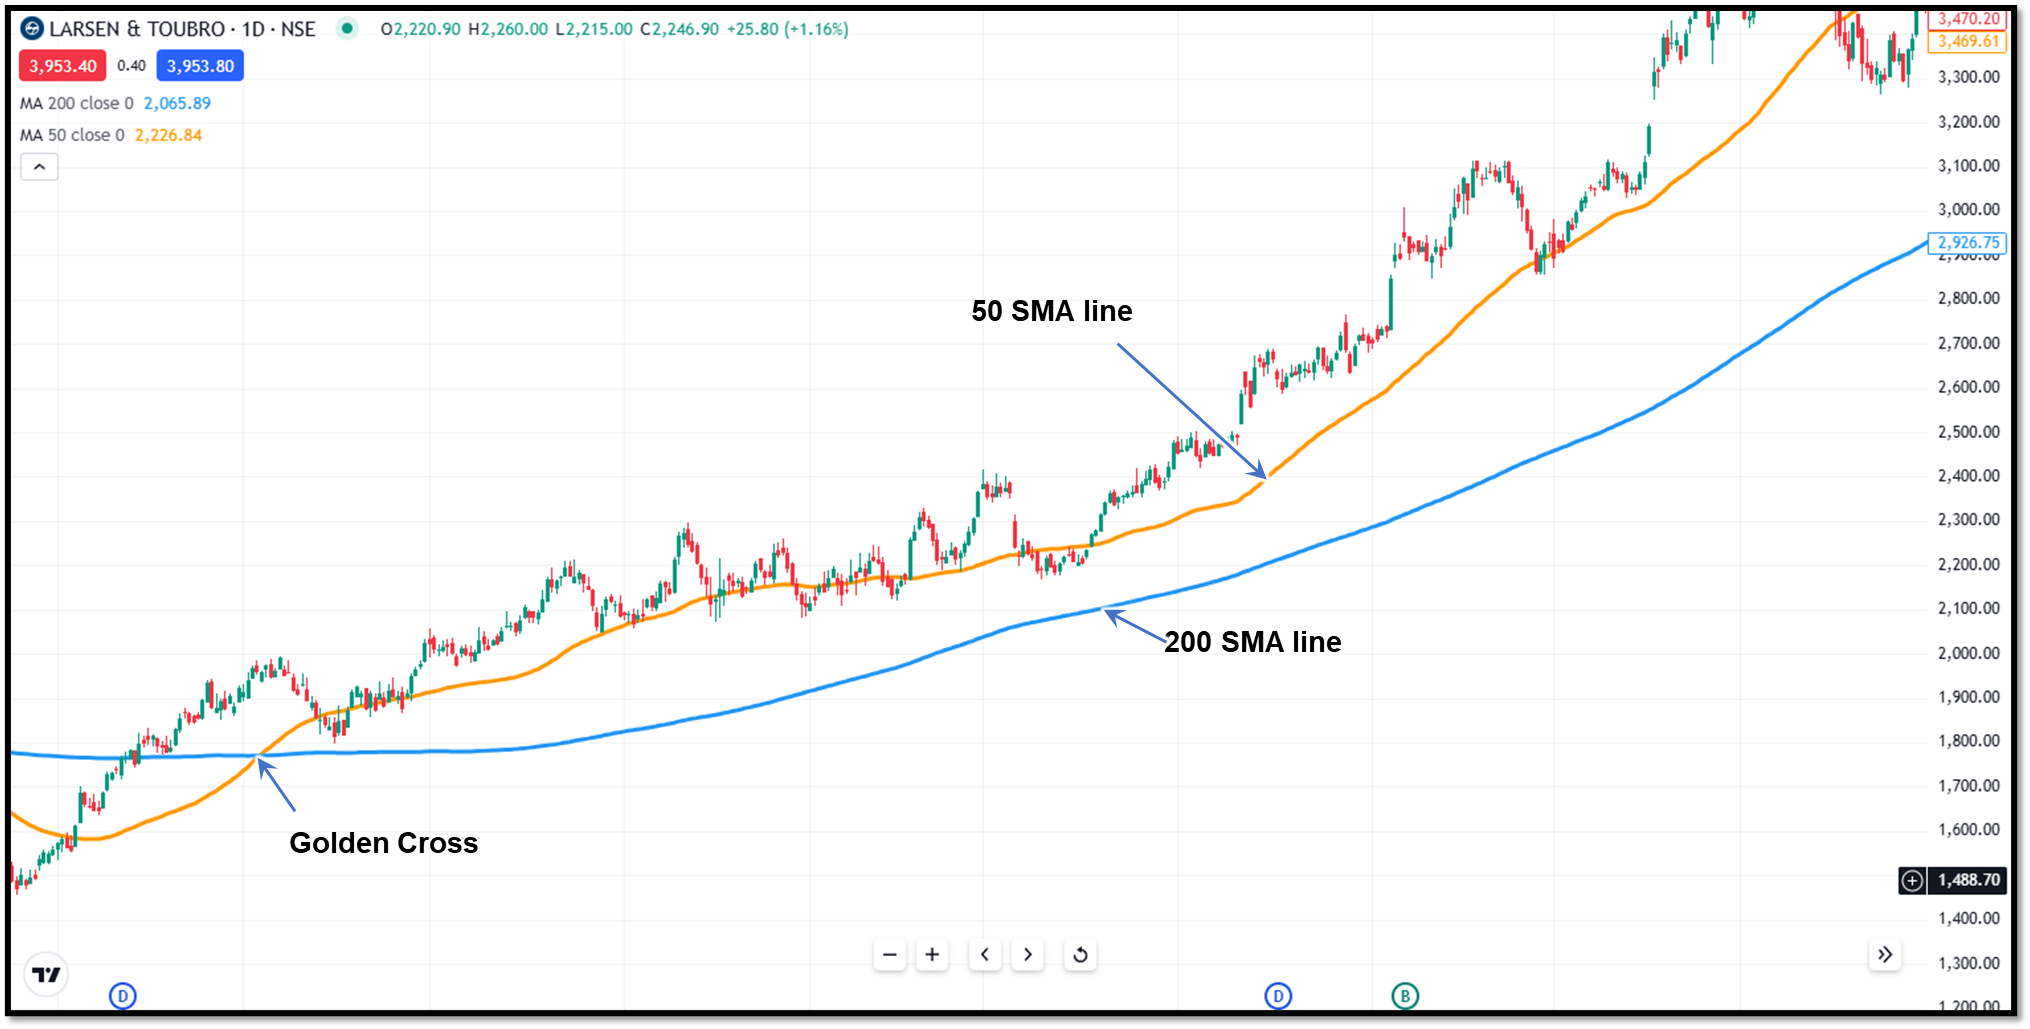
Golden Cross
The Golden Cross occurs when the 50-day EMA or SMA crosses above the 200-day SMA/EMA, indicating a potential long-term bull market. It is closely monitored by institutional investors and fund managers in indices like NIFTY 50 and BSE SENSEX, as it is a sign of improving sentiment and stronger market participation.
Because SMAs/EMAs move slowly, the Golden Cross is often considered to be a confirmation of a strengthening trend and not an early entry signal.
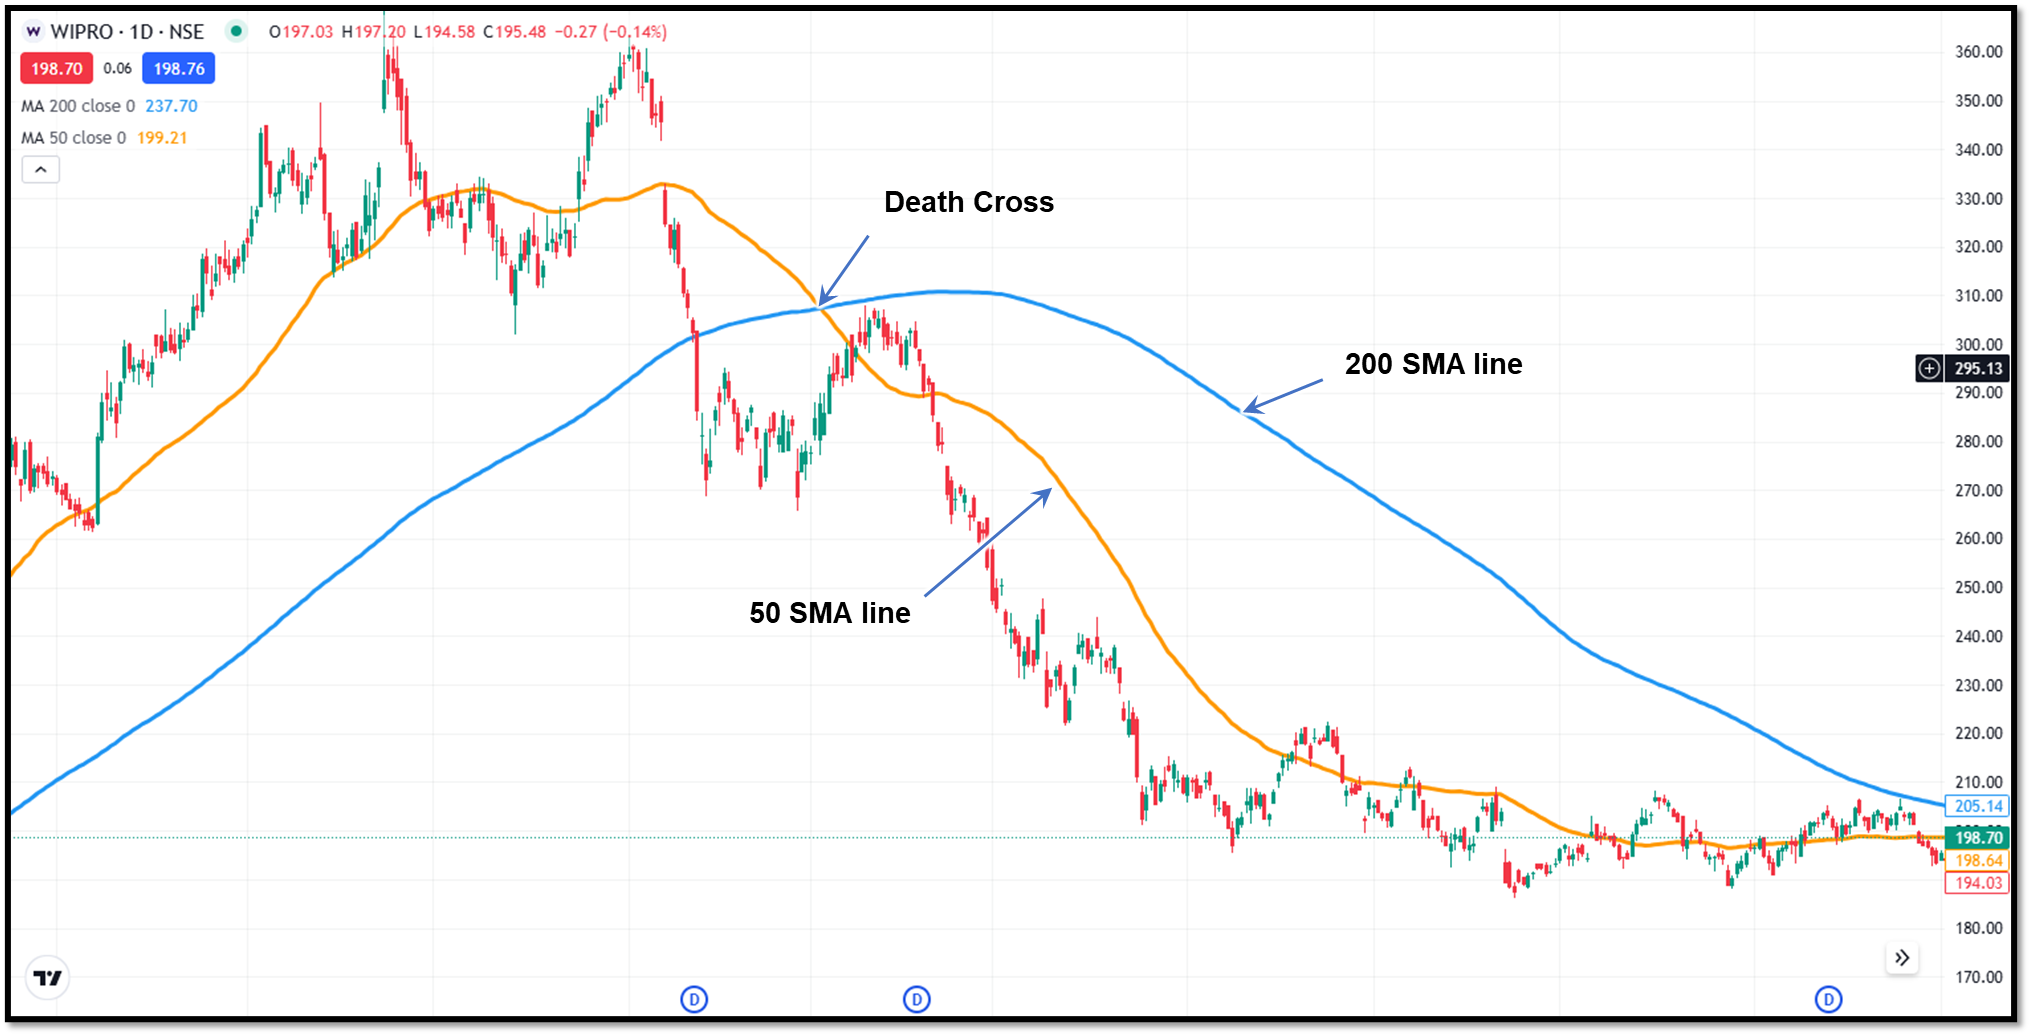
Death Cross
The Death Cross is when the 50-day SMA/EMA crosses below the 200-day SMA, signalling fading momentum and a potential bear market structure.
When this signal is seen on border indices, it gains a lot of attention as it may indicate a loss in confidence and an increase in selling pressure. But, as every experienced trader knows, not all Death Crosses are necessarily followed by a significant market crash, particularly in news-driven and volatile times.
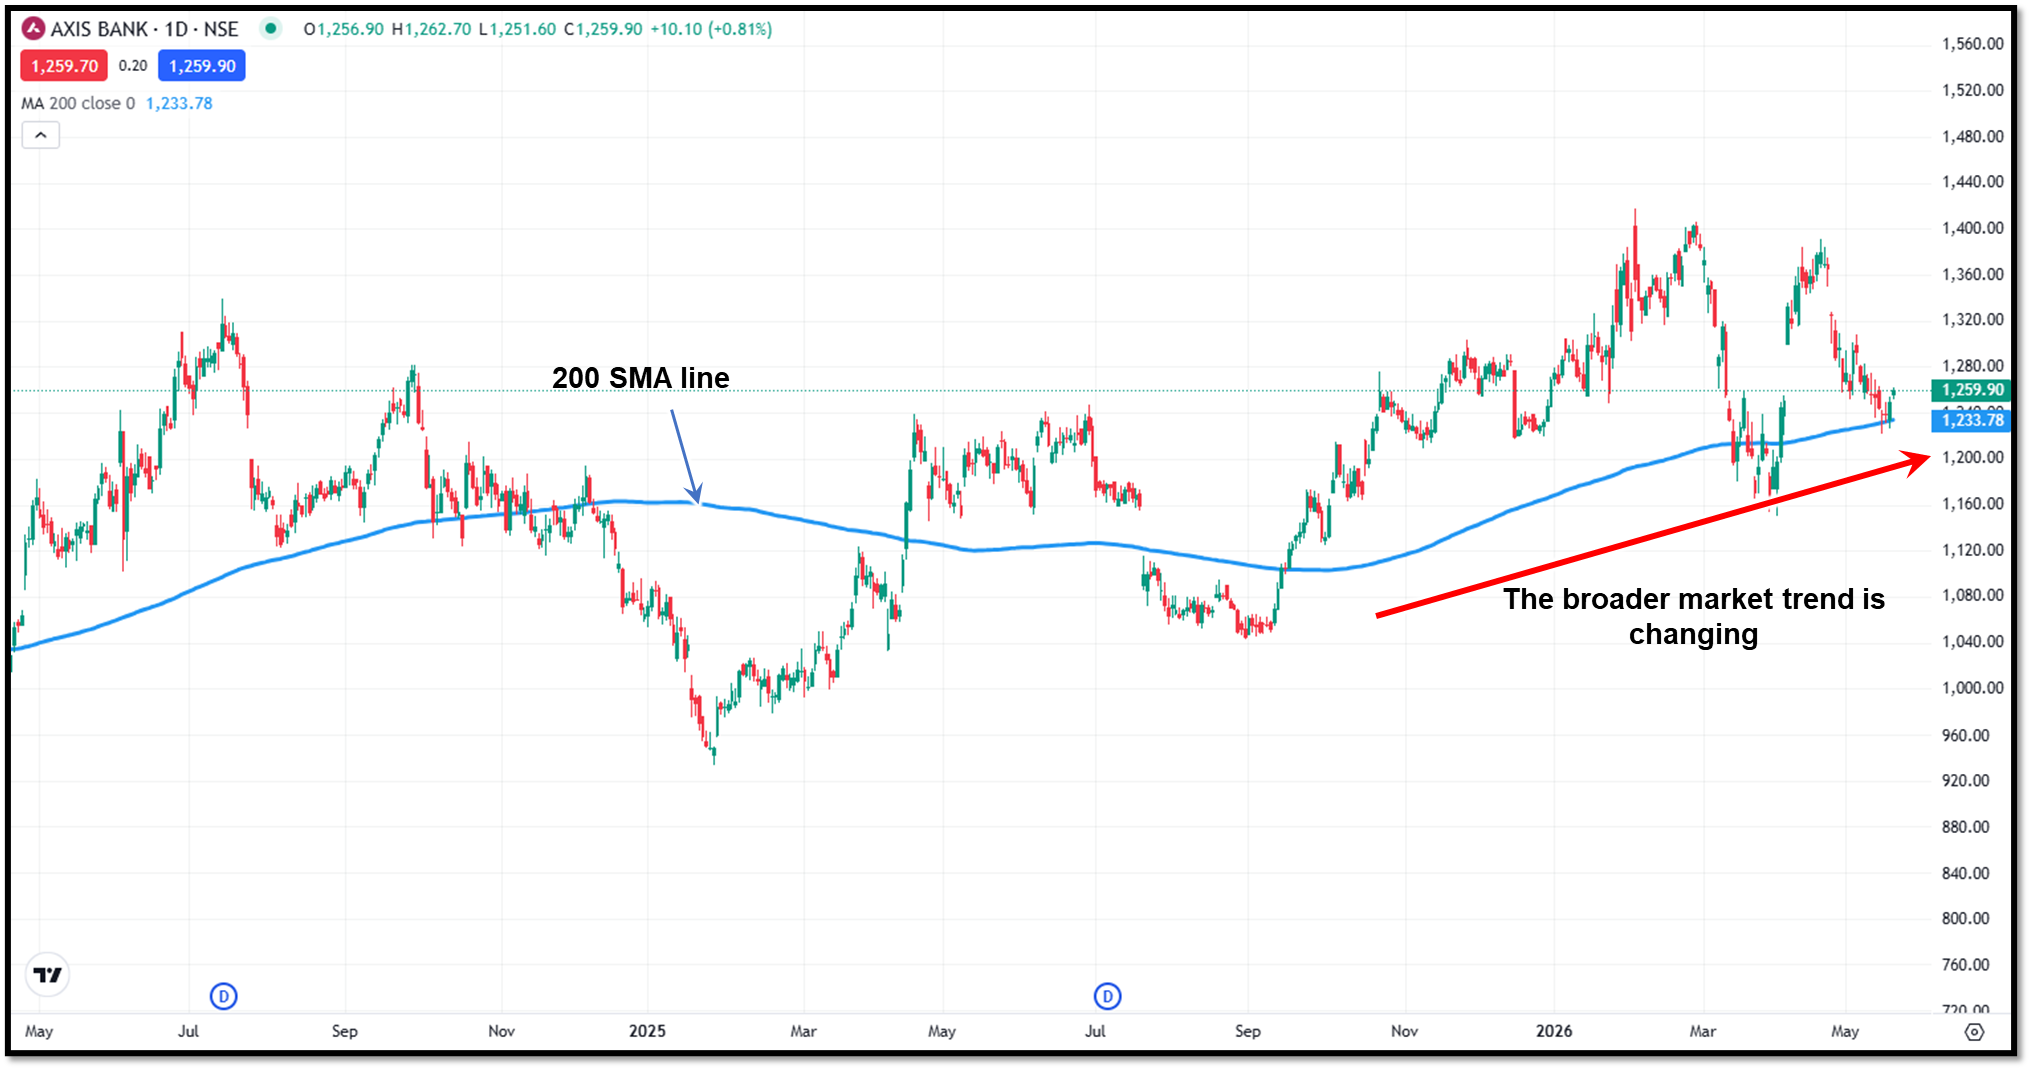
200-Day SMA as a trend confirmation
One of the most respected long-term trend indicators in the market is the 200-day SMA. Many traders do not like to purchase stocks that are trading below this level, as it is a sign of weakness in the broader trend.
The stocks that are consistently trading above the 200-day SMA are structurally strong and have a healthier long-term sentiment. It is a significant support or resistance level since it is closely watched by institutions and large funds.
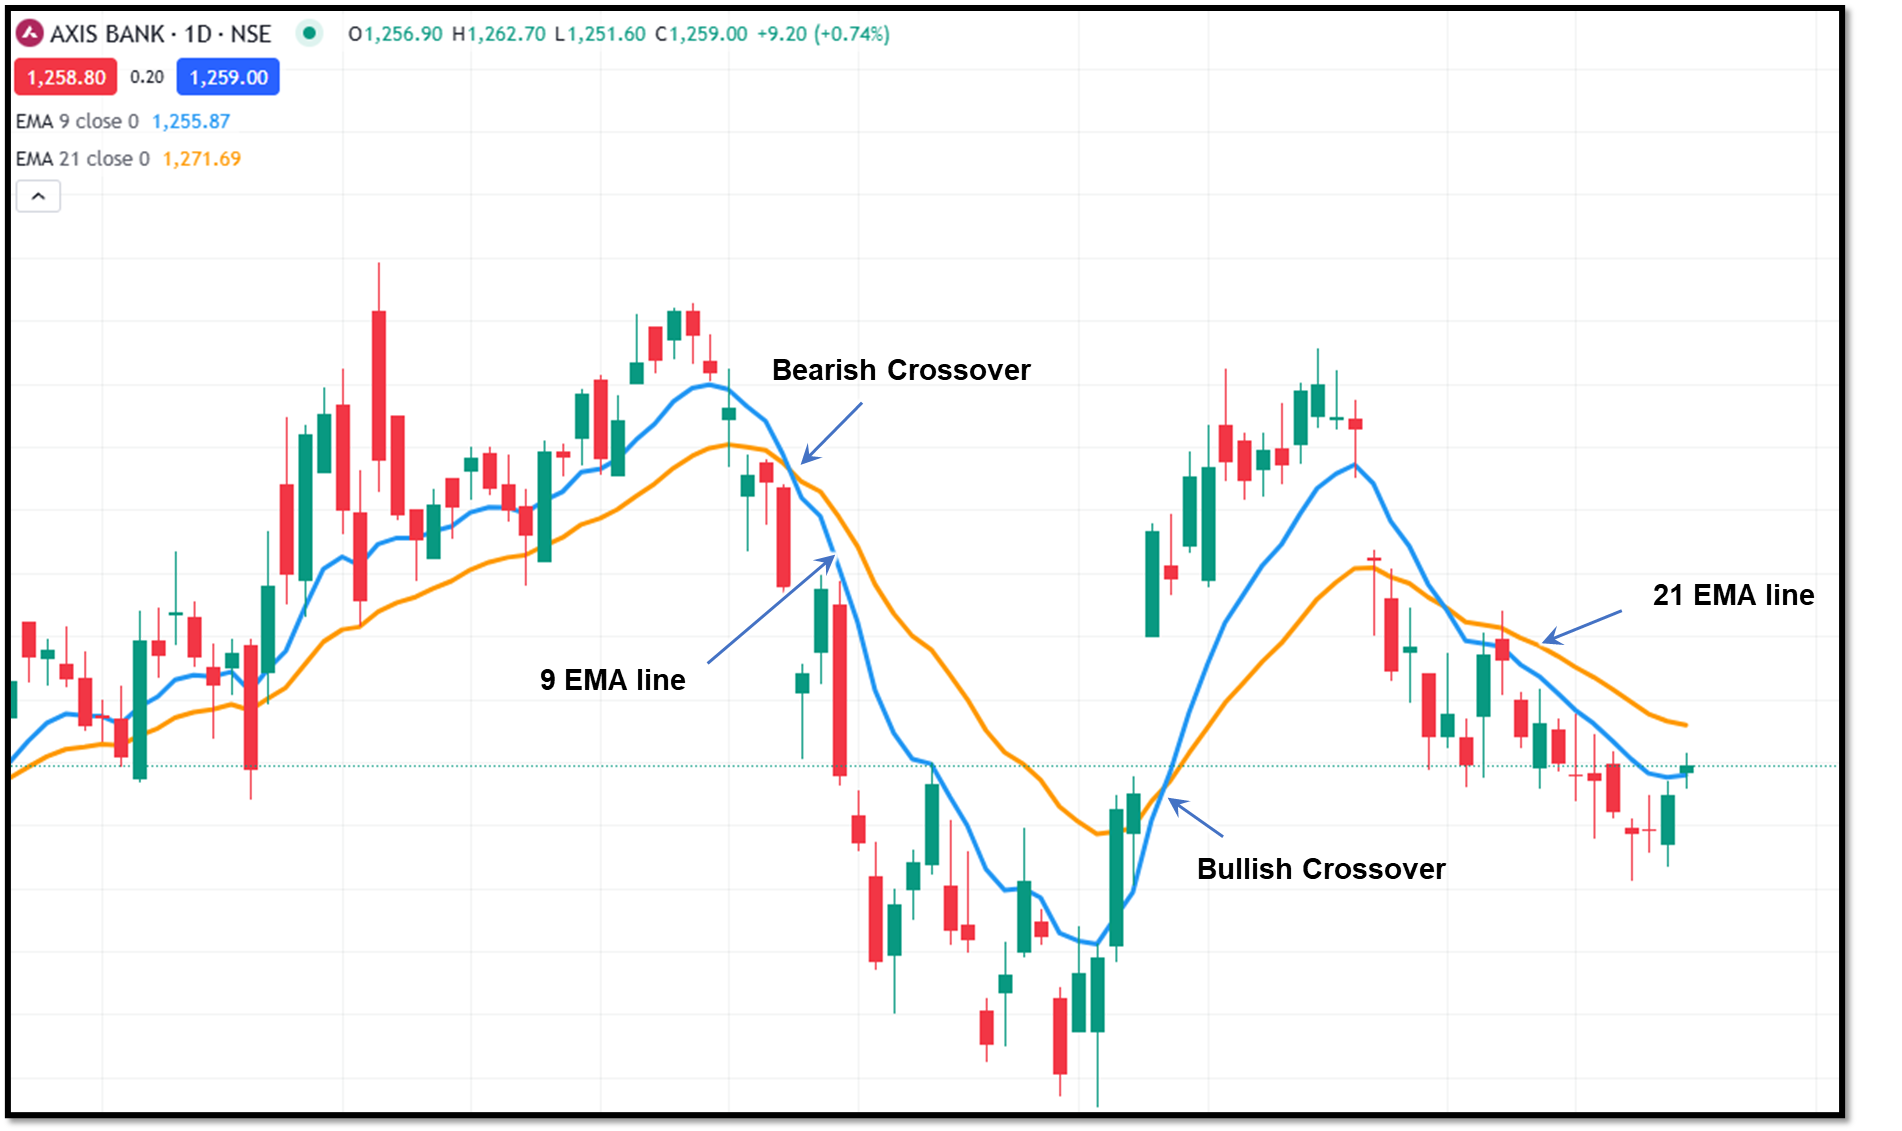
9 EMA / 21 EMA Crossover
Traders typically interpret the 9 EMA rising above the 21 EMA as an indication of an increase in the short-term momentum. This setup is favoured for intraday and swing trading as the EMA is sensitive to recent price action, allowing traders to identify potential trend formations earlier.
When coupled with robust volume, breakout confirmation, and favourable market sentiment, the signal gains higher credibility. But during sideways markets, traders can get caught up in multiple crossovers, leading to false signals in unnecessary trades.
Bounce off EMA
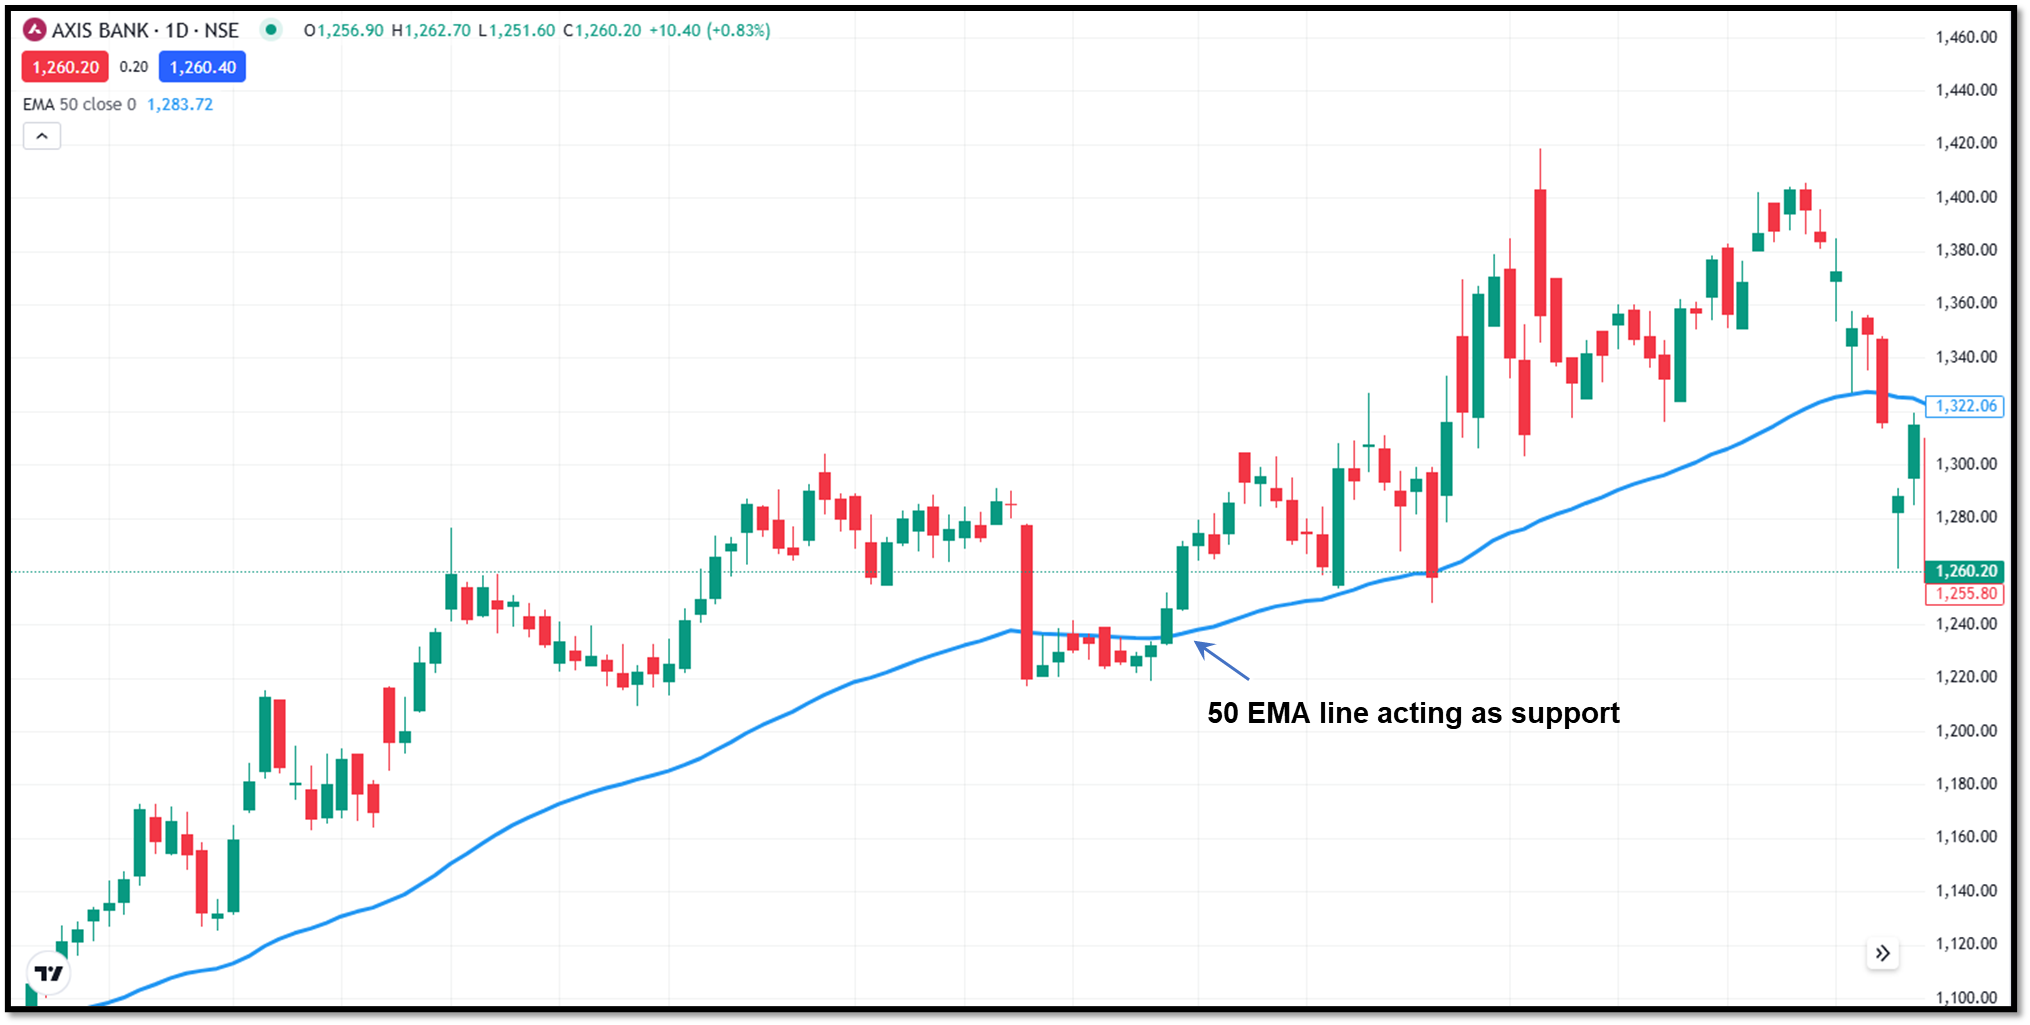
During strong trends, the price may retest significant EMAs such as the 21 EMA or 50 EMA before resuming the trend. These pullbacks are used by traders as safer entry points rather than chasing big moves.
If the price keeps touching an EMA on retracements, it is a sign of trend continuation and active buying or selling. This strategy is best suited for trending markets where the momentum is strong.
When should you use EMA and when should you use SMA?
This is where most traders go wrong: picking one indicator and sticking with it regardless of the market situation. Matching the tool to the situation is the more important skill.
Use SMA when
- You are a long-term investor - weeks, months, years
- You want market validation before positioning all your capital
- You prefer limited but cleaner signals
- The market is moving sideways or lacks a clear trend direction
- You are using Golden Cross or Death Cross strategies.
Use EMA when:
- You’re an intraday or swing trader
- The market is in a clear and trending strongly
- You want an early entry signal
- You are trading high-momentum driven stocks or indices
- Volatility is rising
Can you use both EMA and SMA together?
Yes, in many professional setups, this is a preferred approach. The combined use of EMA and SMA provides a more balanced view of momentum and trend direction.
EMA is more responsive to recent price action and can be used to spot potential entry points and short-term trends. SMA is slower and less volatile, which makes it more reliable to understand the broader market trend.
Many traders prefer to trade with EMAs and confirm with SMAs. A trader can use a 9 EMA and 21 EMA crossover for entry signals and confirm that the stock is trading above the 200-day SMA before taking aggressive long positions.
This blend enables traders to avoid trading against the prevailing market trend and still be able to catch the momentum plays.
Mistakes to avoid
While both EMA and SMA are useful for traders to understand market trends, they do so in different ways. Below are some of the common pitfalls that traders should avoid.
Using only one indicator
One of the major pitfalls for traders is to think that EMA vs SMA is a complete trading system. Moving averages are trend monitoring indicators and not predictive tools. Professional traders do not wait for just one confirmation. Instead, they combine moving averages with price action, support and resistance levels, volume patterns, and market sentiment to reinforce probability rather than chase certainty.
Overloading your chart with indicators
Combining too many indicators often creates confusion. Most traders use multiple EMAs, SMAs, RSI, Bollinger band, MACD, VWAP, and various other overlays at the same time, expecting stronger confirmation. In reality, most indicators are derived from the same price data and eventually lead to repeating similar results.
Misinterpreting crossovers as guaranteed signals
Crossovers are widely used, but they are not guaranteed buy or sell signals. A 9 EMA crossing above the 21 EMA simply shows that short-term momentum is strengthening faster than the medium-term average.
During sideways or range-bound markets, moving averages often cross repeatedly, creating false signals and whipsaws. Strong crossover setups usually work best when supported by rising volume, strong trend structure, and broader market confirmation rather than being traded blindly.
Ignoring the time frame mismatch based on the strategy
Different moving averages work differently depending on the timeframe being traded. Many traders make the mistake of using long-term indicators for short-term trading or relying on short-term EMA signals for positional investing.
A 200-day SMA may be useful for identifying long-term trend direction, but it may not help much in a five-minute scalping setup. Professional traders align their moving average settings with their actual holding period and strategy. Higher timeframes usually define the broader trend, while lower timeframes help refine entries and exits.
To wrap up
In EMA vs SMA, both are highly effective tools and try to solve the same problem making sense of trend direction on a price chart, but for different masters. While SMA provides clarity and stability to patient investors for the long term, EMA serves active traders who are looking for speed and early signals.
The smarter approach is understanding when to use each indicator rather than picking one and ignoring the other. A well-thought-out strategy, backed by proper risk management, can provide a well-structured framework for navigating markets.
FAQs
Is EMA more accurate than SMA?
Not necessarily. Accuracy is not fixed in either of the indicators; it depends on how and when you apply it. EMA performs better in faster and more reactive, trending conditions. SMA performs better in the long-term structural direction. Neither one is universally more accurate than the other.
Which one should beginners start with?
SMA is the most reliable option for beginners. The calculation is very straightforward and can be easily interpreted without getting confused by unnecessary fluctuations.
What periods are most commonly used?
For EMA: 9-day, 21-day, and 50-day are the most commonly used by active traders. For SMA: 50-day, 100-day, and 200-day are the standard supporting sources for long-term and institutional investors. These are the strong foundations before you experiment with others.
Can moving averages be used for mutual fund analysis?
Not in the conventional way. Moving averages are built for price charts, and not directly applicable to mutual fund NAVs in the same way. However, some investors use it to identify long-term trends and determine entry and exit points by comparing NAV to the average price.
Why is the 200-day SMA treated as such an important level?
It is a primary indicator in identifying the underlying trend of a stock or an index. Often signals whether to be in a risk-on or risk-off position. It approximately represents a full trading year of price data. It is widely used by fund managers and institutional investors as a key indicator of long-term sentiment.