



Neutral Chart Patterns







Key takeaways
- Neutral chart patterns show market indecision before a breakout that will confirm the next trend.
- The most common neutral patterns are broadening, symmetrical triangles and rectangles
- Volume plays a crucial role in validating breakouts.
- Combining chart patterns with indicators and proper risk management improves trading decisions.
The financial markets rarely go in a straight line. Prices tend to pause after a big rally or a big fall as traders reassess their positions. This means that the market goes into a period of consolidation where neither side has total control.
This is where neutral chart patterns come into play. Neutral chart patterns point to a market that is waiting for new momentum, while bullish and bearish chart patterns suggest a likely direction. The eventual breakout upwards or downwards will decide the trend.
The early recognition of these patterns can help traders to improve their trade planning, risk management and timing of entry. But acting before confirmation is often a false signal.
This guide covers the structure of neutral chart patterns, their various types, how to trade them, common mistakes to avoid, and how platforms like Dhan can help you analyse them better.
What are Neutral Chart Patterns?
Neutral chart patterns are price formations characterised by a relative balance between demand and supply. These periods are marked by trading in narrow or defined ranges without a clear bullish or bearish trend developing.
These patterns typically indicate:
- Market indecision
- Reduced volatility
- Price consolidation
- Potential breakout in either direction
Neutral patterns do not predict the direction of the next move, unlike reversal patterns. Instead, the trader waits for the price to break resistance or support and then trades.
Why Neutral Chart Patterns matter?
Markets often consolidate. During this phase, prices move in a range as buyers and sellers wait for a fresh trigger.
Neutral chart patterns allow traders to be ready for a possible breakout rather than simply reacting to one that has already taken place.
Understanding neutral patterns helps traders:
- Avoid entering trades too early
- Spot high-probability breakout opportunities
- Entry and exit levels of a plan
- Better management of trading risk
- Improve reward-to-risk ratios
Professional traders often use chart patterns along with volume analysis and momentum indicators before confirming a trade.
Types of Neutral Chart Patterns
There are a few types of consolidation patterns, but the most commonly known neutral chart patterns are as follows.
1. Symmetrical triangle
A symmetrical triangle is one of the most commonly seen neutral chart patterns. It is a consolidation phase where the bulls and bears are balanced, and the price moves will become tighter and tighter.
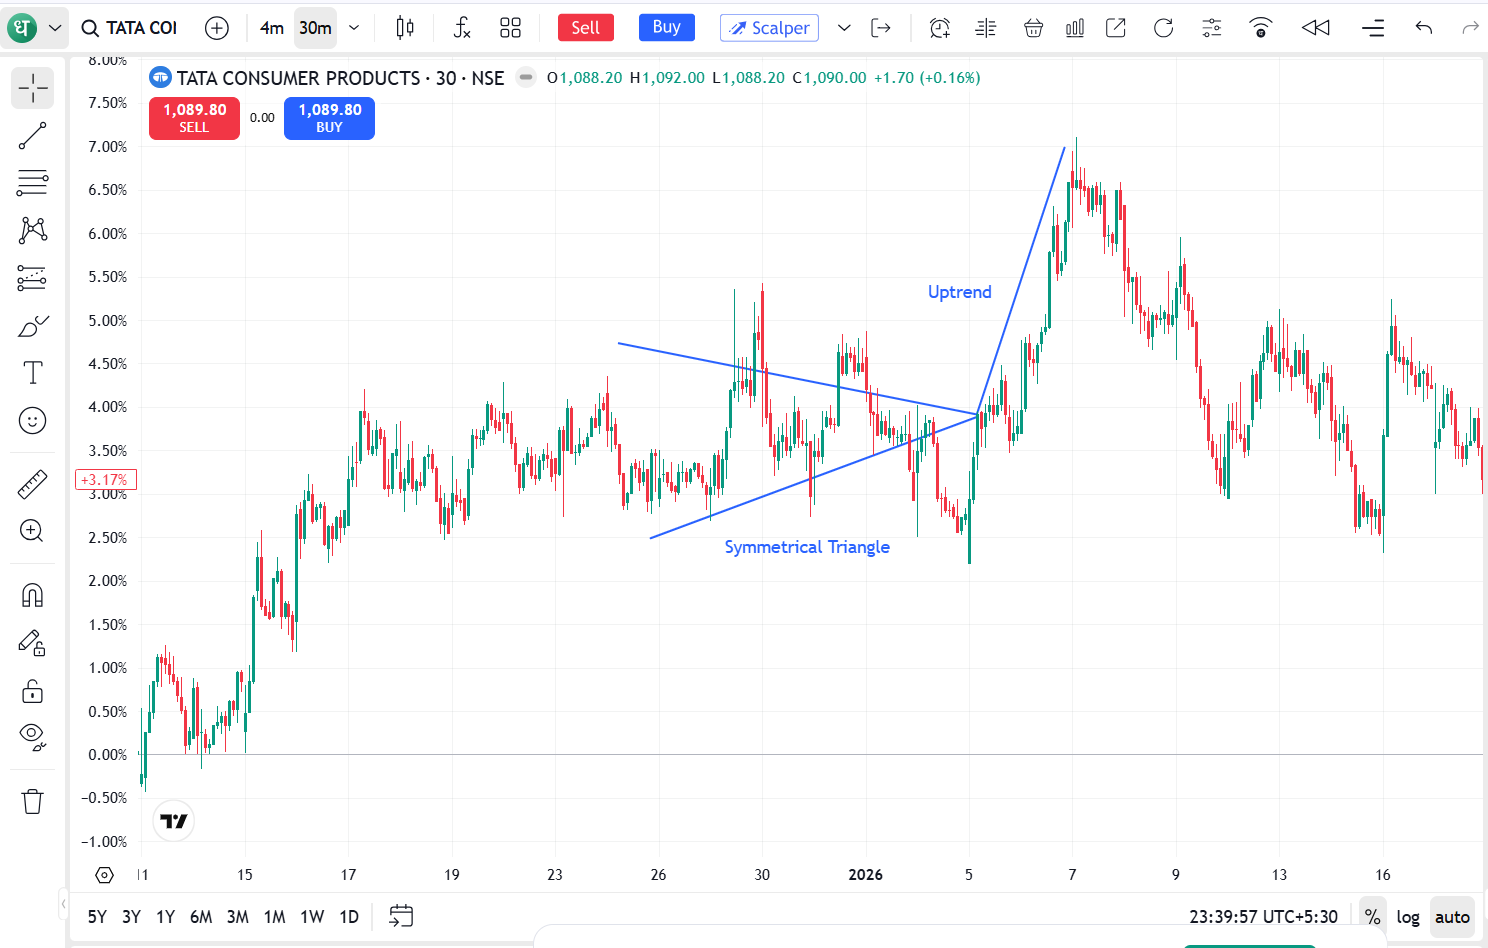
It forms when:
- A down-sloping resistance line is created by lower highs.
- Higher lows make an upward sloping support line.
- The price contracts within the converging trendlines.
- During this period, neither the buyers nor sellers have a clear advantage.
Each time the rallies get smaller, each decline gets less momentum. This restrictive price action is a sign of indecision growing in the market until a breakout occurs.
Breakout signal:
The breakout can occur in either direction. Traders typically wait for:
- A strong candle close outside the triangle
- An increase in trading volume
- Confirmation from the following candle
Price target:
A common technique is to measure the height of the widest part of the triangle and then project the same distance from the breakout point.
2. Rectangle pattern
The rectangle pattern is a neutral pattern where the price trades in a well-defined trading range before finally breaking out.
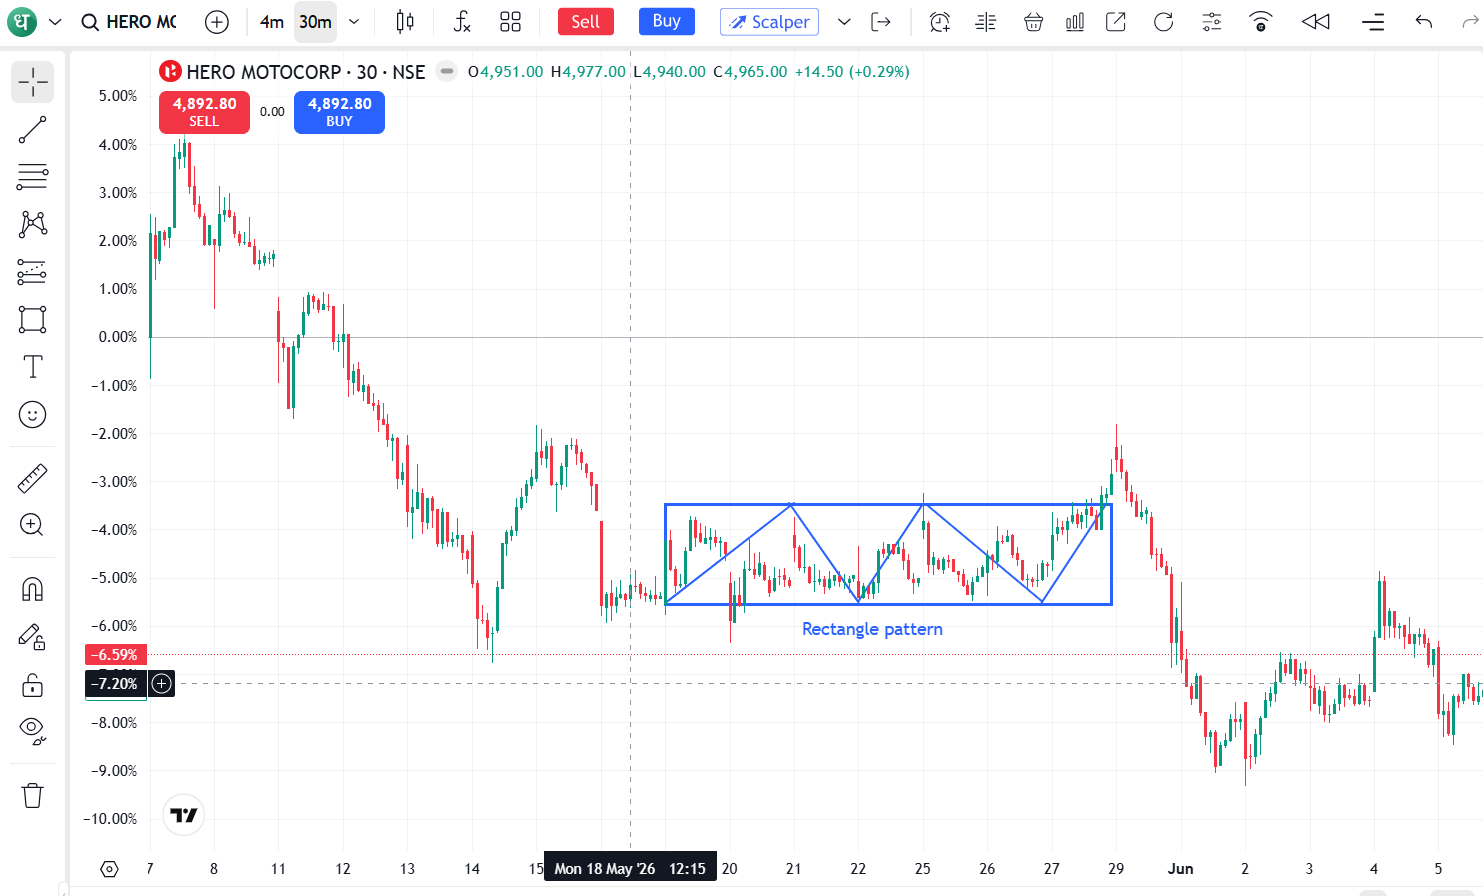
It forms when:
- Price repeatedly encounters resistance at a horizontal level.
- Buyers consistently defend a horizontal support level.
- The price moves back and forth between these two levels without creating higher highs or lower lows.
- Multiple touches of both support and resistance validate the pattern.
The pattern shows an equilibrium between buyers and sellers, with neither side having enough strength to set a new trend.
Breakout signal:
The breakout can occur in either direction. Traders generally look for:
- A decisive close above resistance or below support
- Higher-than-average trading volume
- Confirmation from the next price candle
Price target:
The height of the rectangle is frequently used to project the distance to the expected price target from the breakout or breakdown level.
3. Broadening formation
The broadening formation, also known as the megaphone pattern, is a neutral chart pattern that shows an increasing price swing and increasing market uncertainty. It indicates buyers and sellers are getting more aggressive, leading to increased volatility before the next big move.
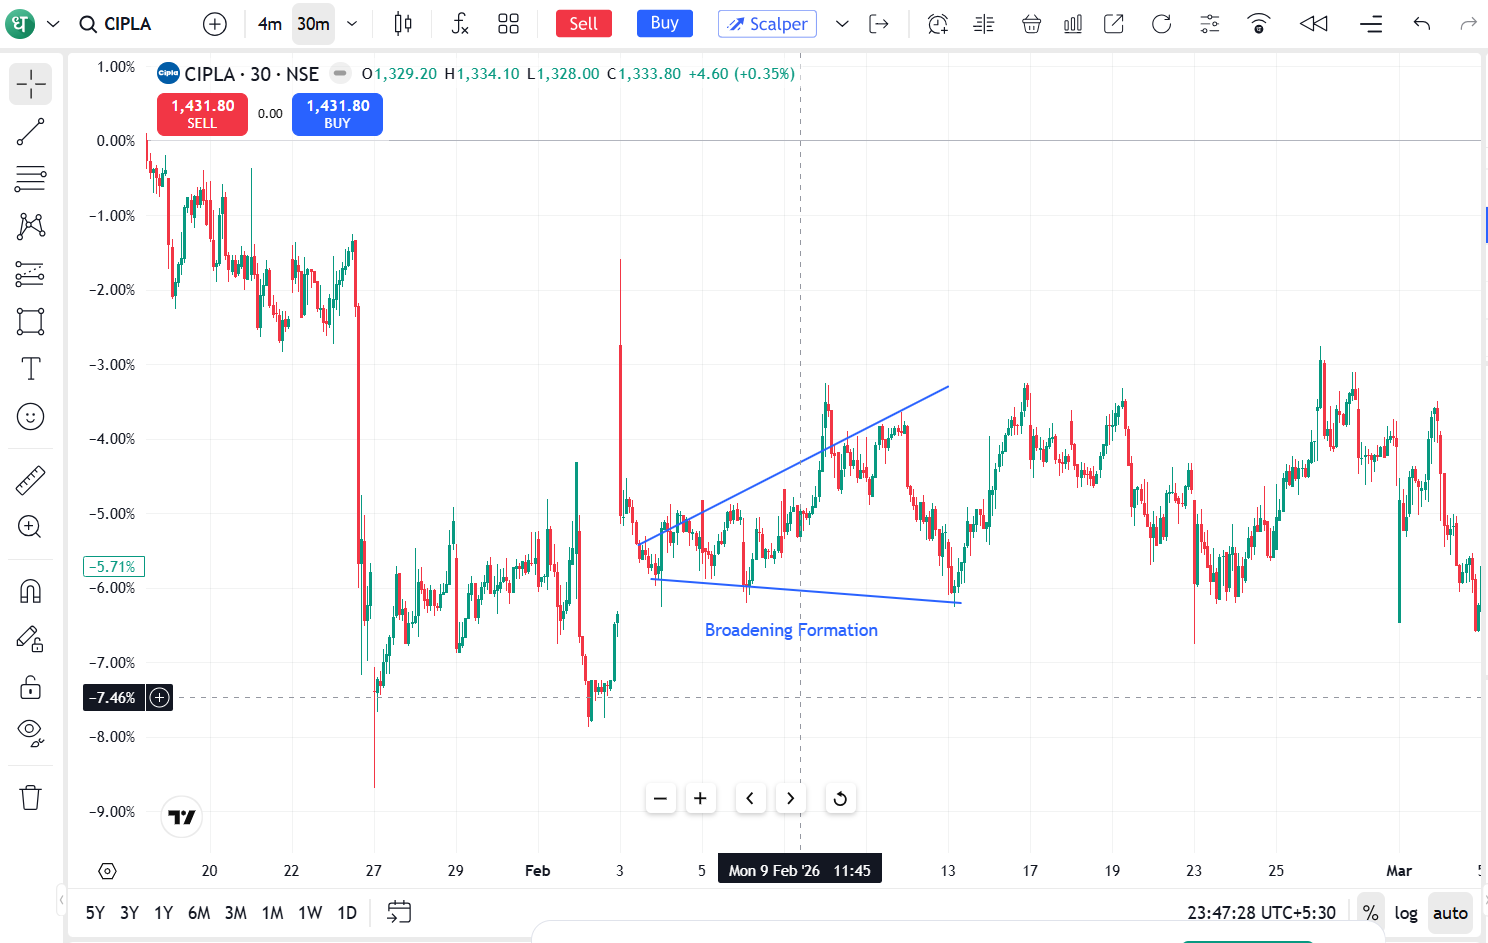
It forms when:
- Price is making higher highs and lower lows.
- Two trendlines diverging, making a megaphone shape.
- Volatility increases and price swings get wider.
- Neither the buyers nor the sellers can keep control.
The pattern indicates increasing indecision in the market as both bulls and bears drive prices to extremes before the breakthrough.
Breakout signal:
The breakout can occur in either direction. Traders generally look for:
- A decisive close above the upper trendline or below the lower trendline
- Higher trading volume during the breakout
- Confirmation from the following candle
Price target:
The most common way is to measure the widest part of the pattern and project that distance from the breakout point to estimate the potential price target.
Neutral Chart Patterns vs Bullish and Bearish Patterns
Not all chart patterns have the same market outlook. Comparison of neutral, bullish and bearish chart patterns based on market sentiment and breakout expectations.
How to trade Neutral Chart Patterns
Following a structured process helps avoid emotional decisions.
Step 1: Identify consolidation
First of all, you need to find a consolidation period where the price is trading in a contracting range or a defined trading range. Don't try to pattern random price action. Not every sideways move is a valid pattern.
Step 2: Draw trendlines
When a pattern starts to develop, connect the support and resistance levels, or the converging boundaries of the pattern, with trendlines. Well-drawn trendlines help you identify possible breakout points and make your analysis more accurate.
Step 3: Confirm the Volume
Volume gives valuable confirmation to chart patterns. Lower volume during consolidation is a sign of market indecision, while a sharp rise in volume at the breakout indicates that buyers or sellers have taken control, making the breakout more credible.
Step 4: Wait for confirmation
Volume is useful to confirm chart patterns. If volume decreases during the consolidation phase, then the market is uncertain, and if it increases at the breakout level, then the buyers and sellers have taken control.
Step 5: Place a stop-loss
Always set up your stop before you enter the trade. In the case of bullish breakouts, traders usually place the stop-loss below the breakout candle or the last swing low. In the case of bearish breakdowns, it is usually placed above the breakdown candle or the recent swing high.
Step 6: Define your profit target
Try to determine a profit target by measuring the length of the chart pattern and extending that length from the breakout. This helps to keep the risk-to-reward ratio in a good position and helps to get a logical price objective.
Common mistakes to avoid when trading Neutral Chart Patterns
Avoiding these common mistakes can help improve the accuracy of trades and reduce unnecessary risk.
Trading before the breakout
Entering a trade before the breakout is confirmed can result in false signals. Because neutral chart patterns can break either way, wait for a clear price close before entering a position.
Ignoring volume
A breakout without a higher volume of trade may not be strong. Use volume to confirm the move has enough momentum.
Chasing late entries
Buying or selling after a large breakout candle can decrease your reward potential as well as increase your risk. Look for disciplined entry points, not chasing the move.
Poor risk management
Strong chart patterns can fail. Place a stop-loss and maintain a favourable risk to reward ratio to safeguard your capital.
Trading every pattern
Not every consolidation is a profitable trade. Look to trade well-formed patterns with clear breakout confirmation, not every pattern you see.
Wrapping up
Neutral chart patterns give traders the ability to identify periods when markets are consolidating before they make their next big move. Instead of forecasting the future, these patterns encourage patience and disciplined decision-making.
Successful traders know that the trading opportunity is in the breakout, not the pattern itself. Using a combination of chart reading, volume confirmation, technical indicators and good risk management, traders can improve their ability to pick out high-probability setups.
Dhan’s advanced charting features can make pattern recognition even easier and help traders analyse markets with more confidence.
FAQs
1. Which technical indicators work best with neutral chart patterns?
RSI, Moving Averages, MACD, and volume are commonly used to confirm breakouts and improve trading decisions.
2. Are neutral chart patterns suitable for beginner traders?
Yes. If they wait for confirmation of a breakout and follow proper risk management, they are easy to use for beginners.
3. Can neutral chart patterns predict market direction?
No. They show consolidation, not directionality. Traders are waiting for a confirmed breakout to enter into positions.
4. Is volume important while trading neutral chart patterns?
Yes. Strong trading volume during a breakout confirms that the breakout is genuine.
5. Which timeframe works best for neutral chart patterns?
Neutral chart patterns can appear on intraday, daily, weekly, and monthly charts. Many traders prefer higher timeframes because they generally produce more reliable signals.







