



Best TradingView Indicators








Traders can use TradingView's various indicators for intraday or swing trading, and selecting the appropriate tools would be important in the process of filtering market noise. In this blog, we will explore the 15 best TradingView indicators that can help traders detect trends, momentum, volatility, and volume.
Top 15 TradingView Indicators
Here is the list of the best TradingView indicators.
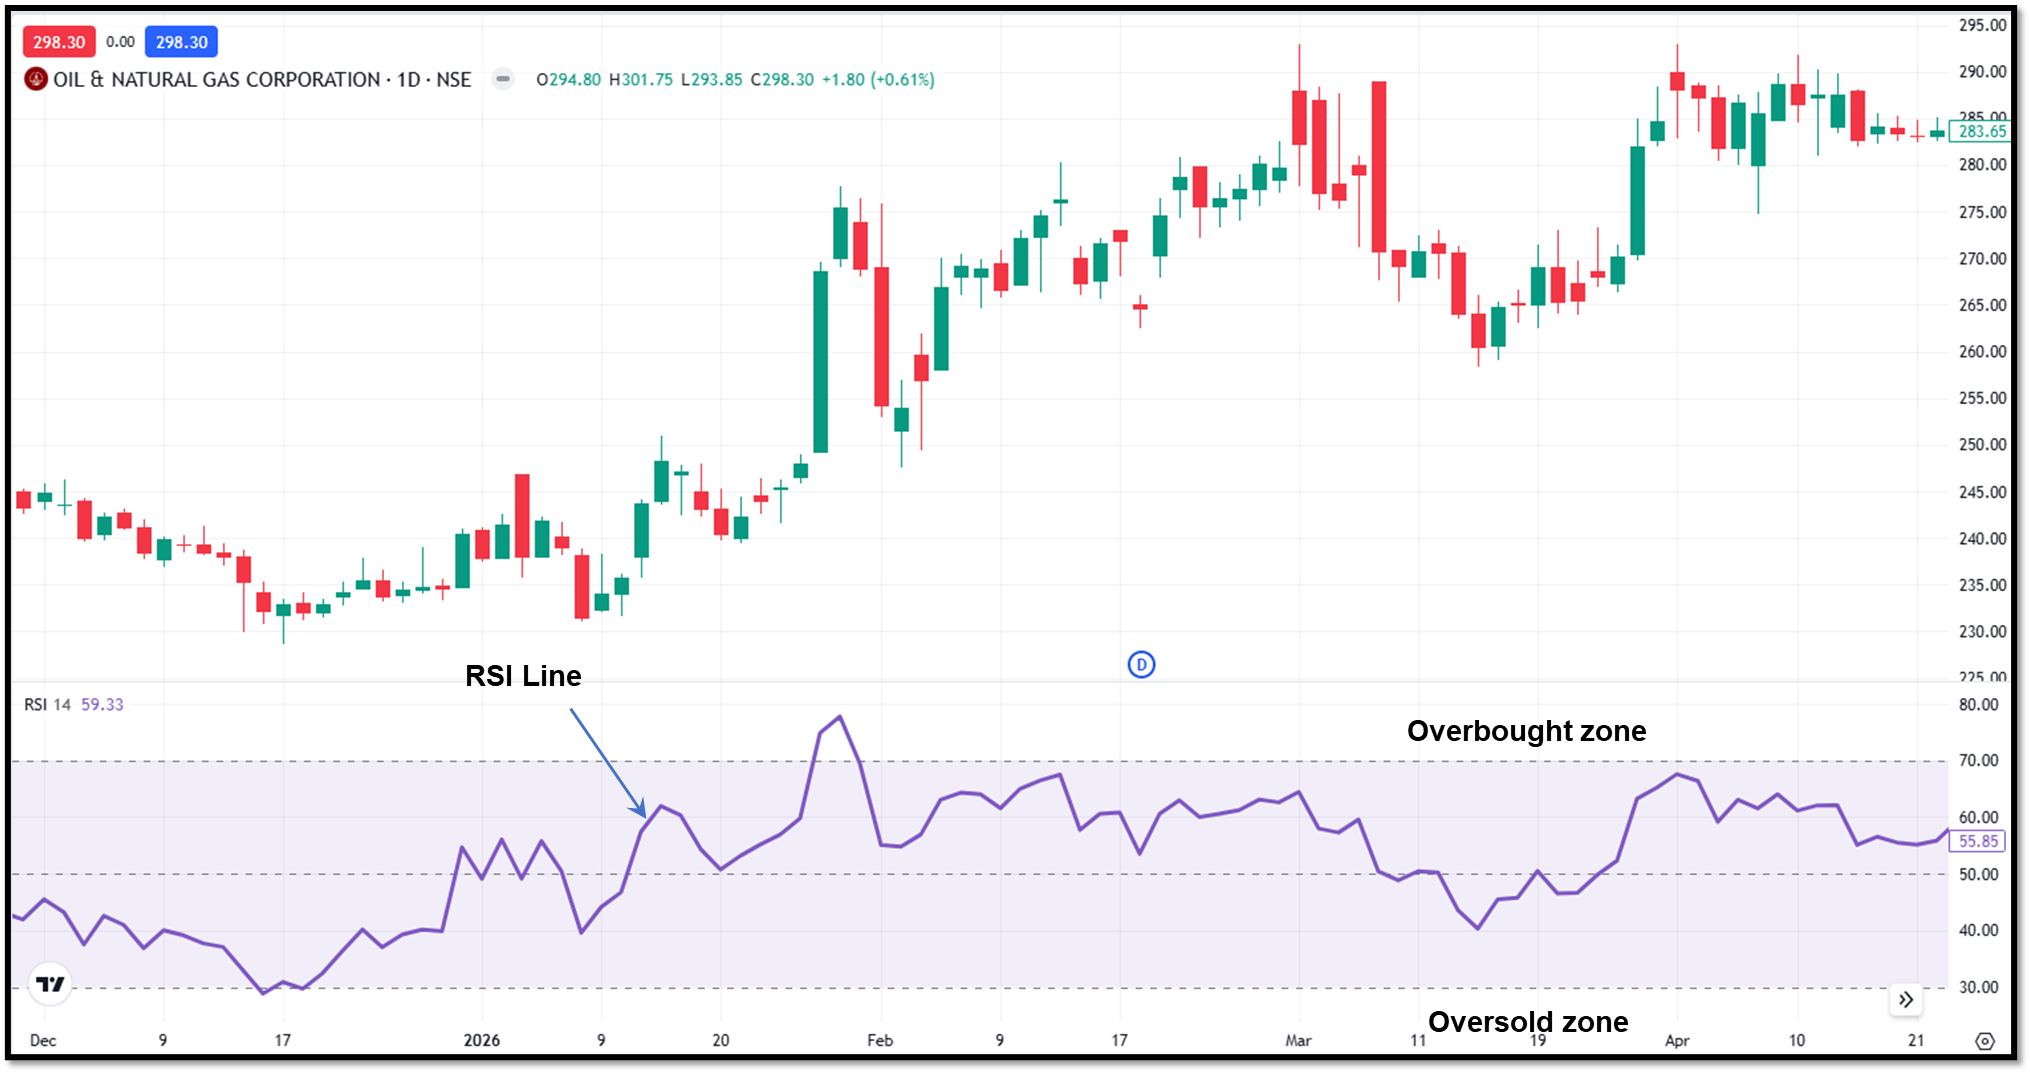
Relative Strength Index (RSI)
RSI is one of the most commonly used momentum oscillator indicators, which compares the speed and change of price movements on a scale of 0-100. An RSI reading above 70 indicates an overbought condition, signalling a potential sell opportunity, while a RSI reading below 30 indicates an oversold market condition, signalling a potential buying opportunity.
Many traders seek divergence, where the price reaches a new high, and RSI fails to do so, which is a reliable indication of a potential trend reversal. Traders use RSI to identify critical reversal points and overextended market movements.
Moving Average Convergence Divergence (MACD)
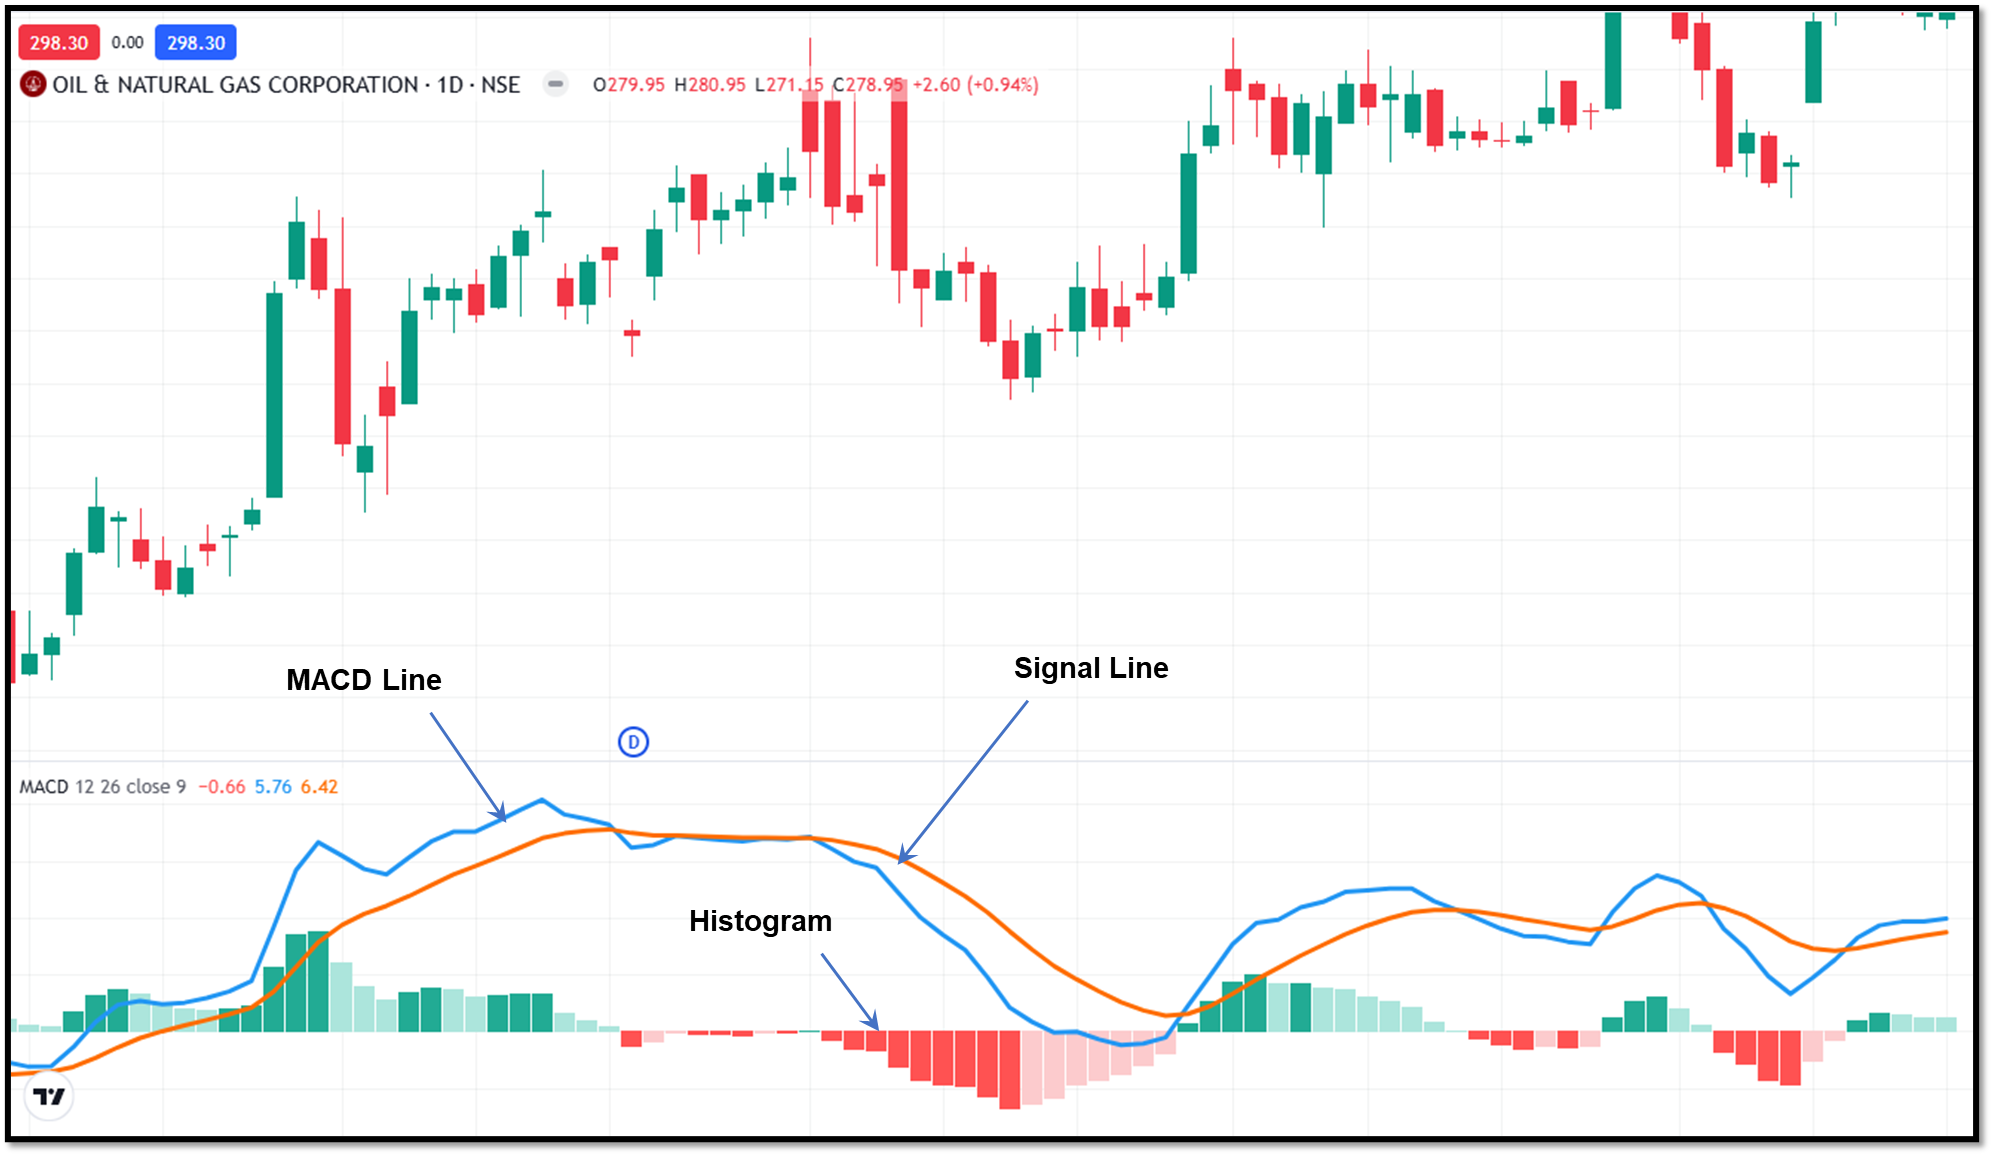
Moving Average Convergence Divergence (MACD) is a trend-following momentum indicator. It is composed of a MACD line, a signal line, and a histogram. It represents the relationship between two moving averages. Traders use MACD to gauge market entry, as when the MACD line crosses above the signal line, it indicates an opportunity for a bullish entry, or below it for a bearish entry.
The strength of momentum is reflected in the form of histogram bars; growing bars indicate a growing momentum, and decreasing bars indicate a declining trend. MACD is a useful indicator to verify the direction of the trend and identify the early shifts in market momentum.
Exponential Moving Average (EMA)
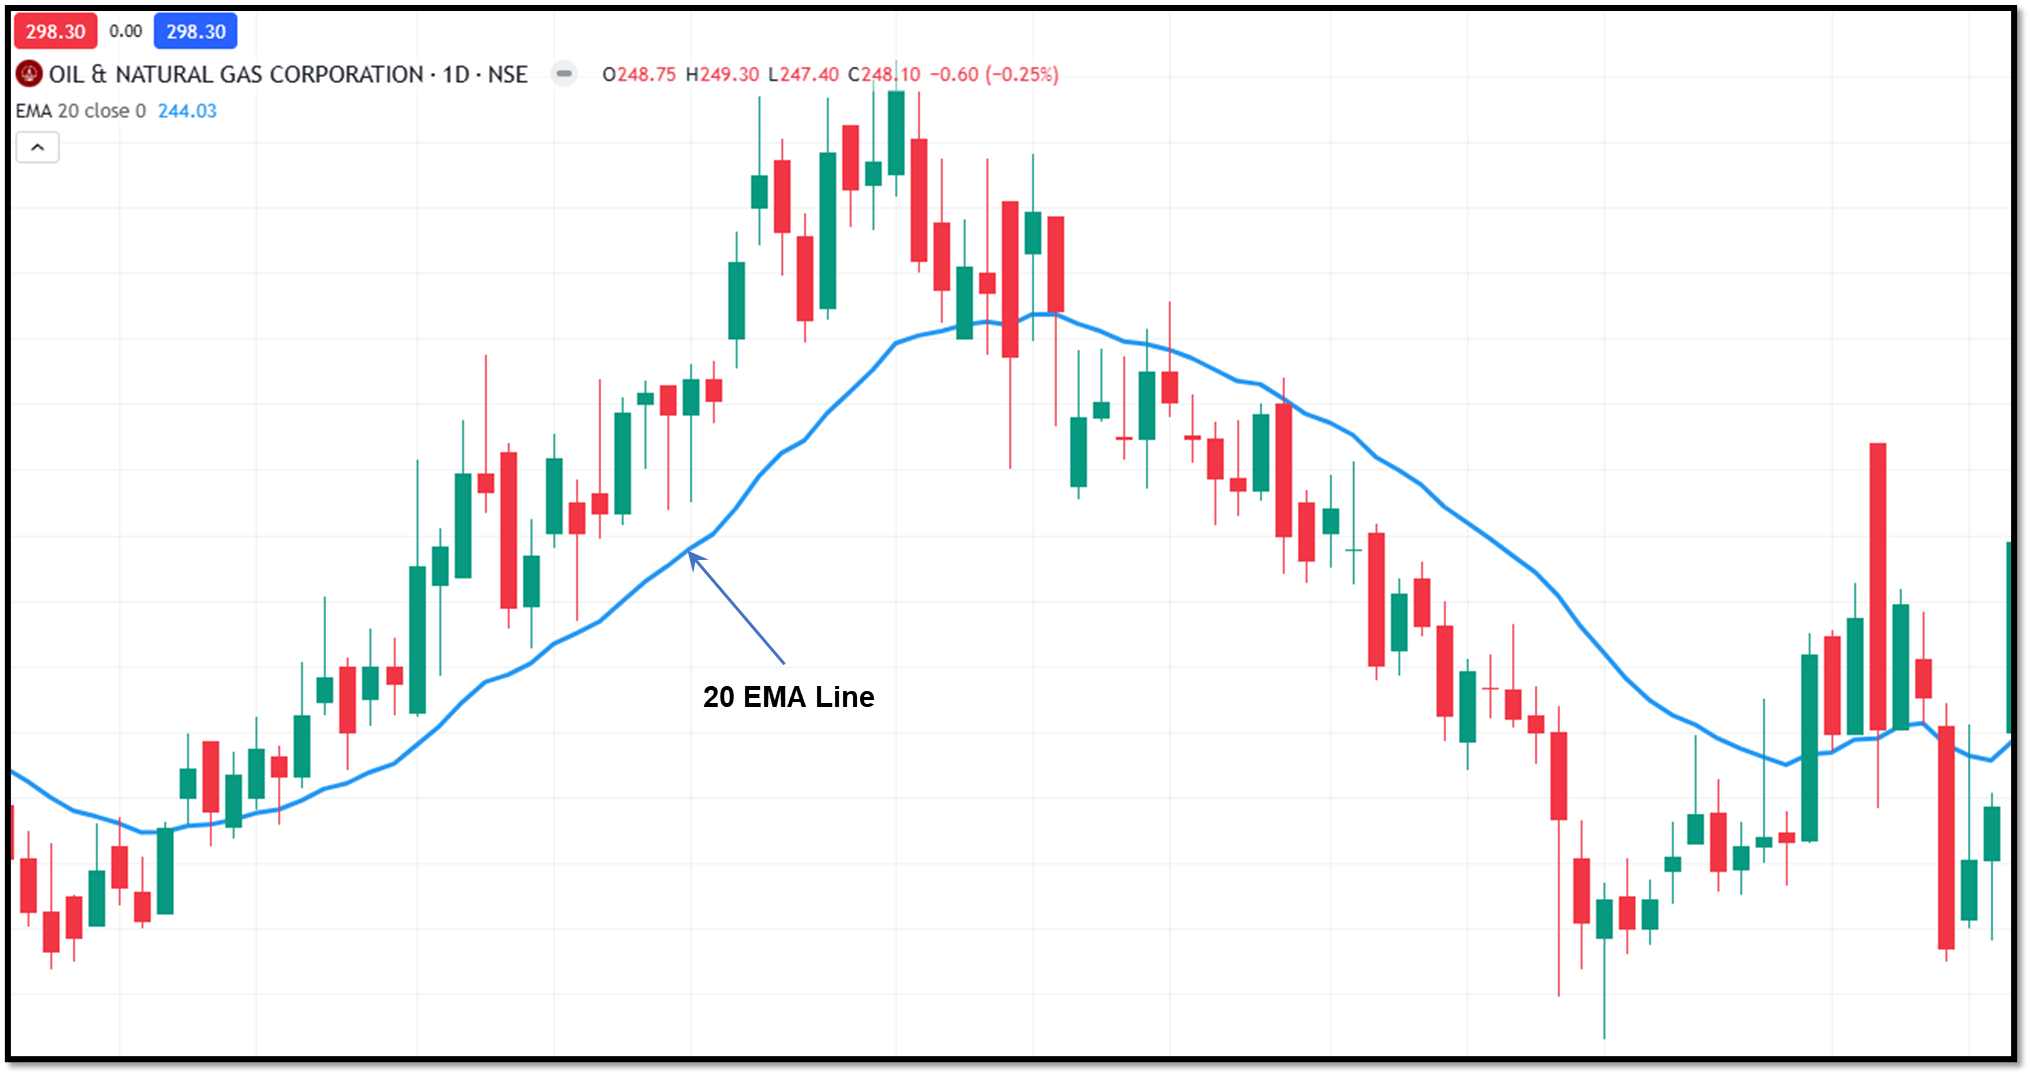
In contrast to the Simple Moving Average (SMA), EMA pays more attention to the recent data; thus, it is more responsive. Short-term trend following is commonly gauged by traders using short-term EMAs like the 9 EMA or the 20 EMA. Here are 5 EMA strategies for trend detection and price movements.
In case the price remains higher than the EMA, then the trend is said to be upward. The EMA indicator is used to determine the short-term trend and the dynamic support and resistance levels.
Bollinger Bands
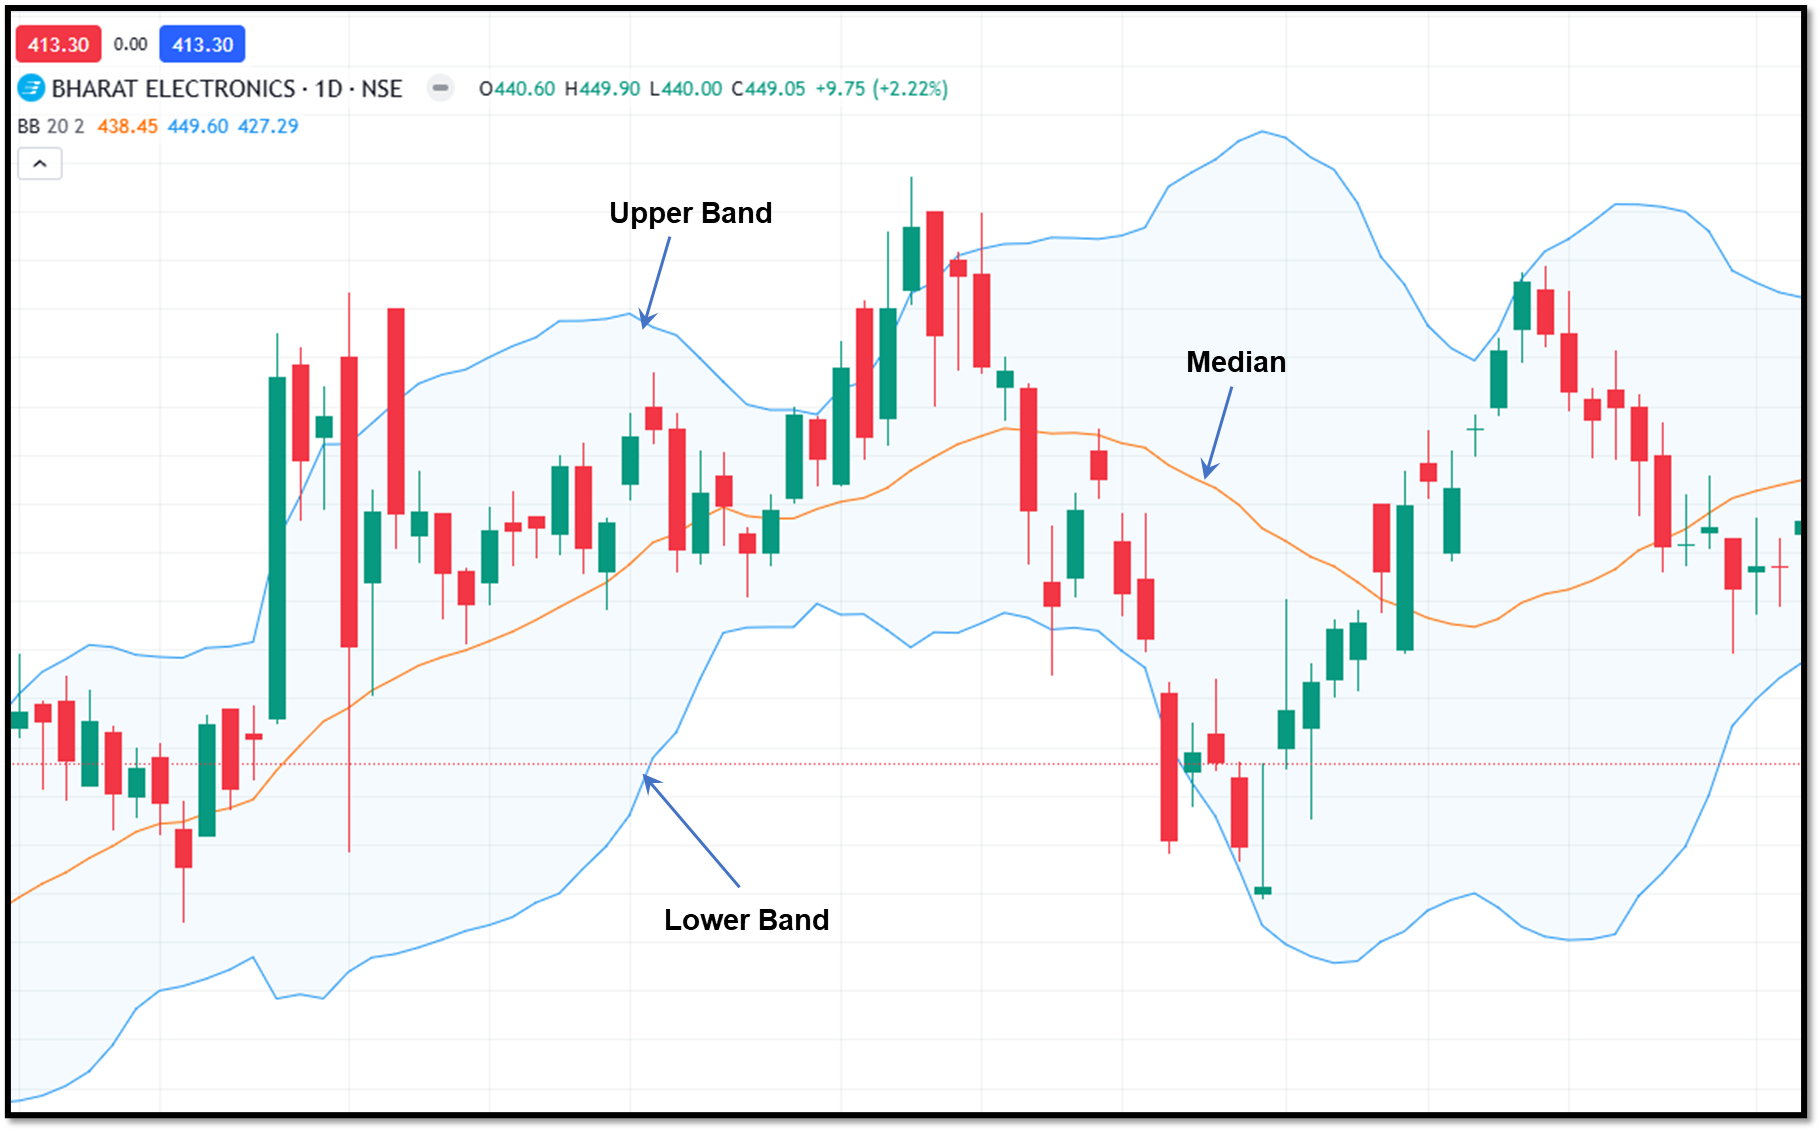
Bollinger bands are composed of a middle band (usually a 20-day SMA) and two outer bands, which represent standard deviations, acting as a dynamic measure of volatility. When the bands become tight, that is known as the Squeeze, it signals low volatility and the potential for the occurrence of a sharp breakout.
When the price touches the upper band, it signals an overbought condition; while when it touches the lower band, it indicates an oversold condition. Bollinger Bands are the most suitable for volatility and breakout trading analysis.
Supertrend
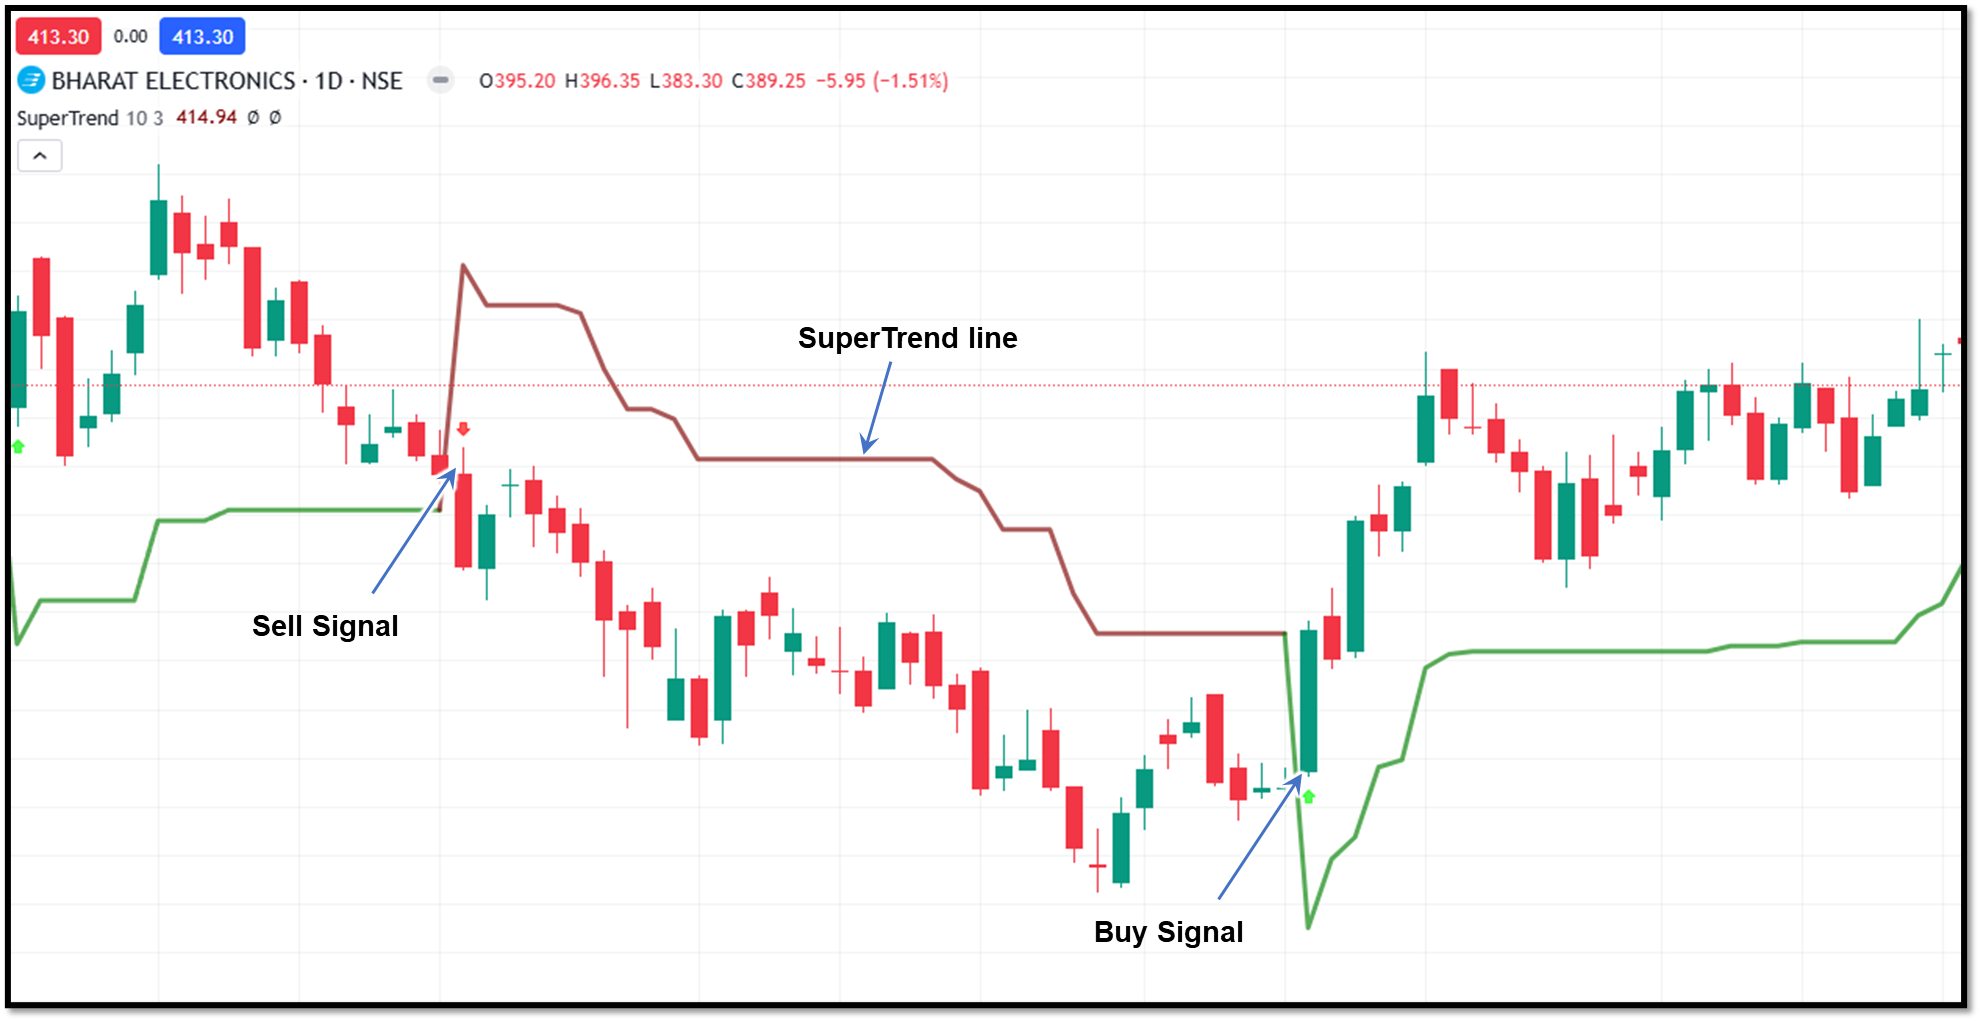
Supertrend is a popular indicator among traders in India due to its simplicity. It is an indicator that changes colour, green (to buy), red (to sell), depending on the price movements and average volatility (ATR).
When the price remains above the line, the line remains green, and when the price closes below, the line turns red, indicating a sell signal. Because of this clear visual cue, it is one of the best visual indicators to track big trends and trade using a trailing stop-loss.
Ichimoku Cloud
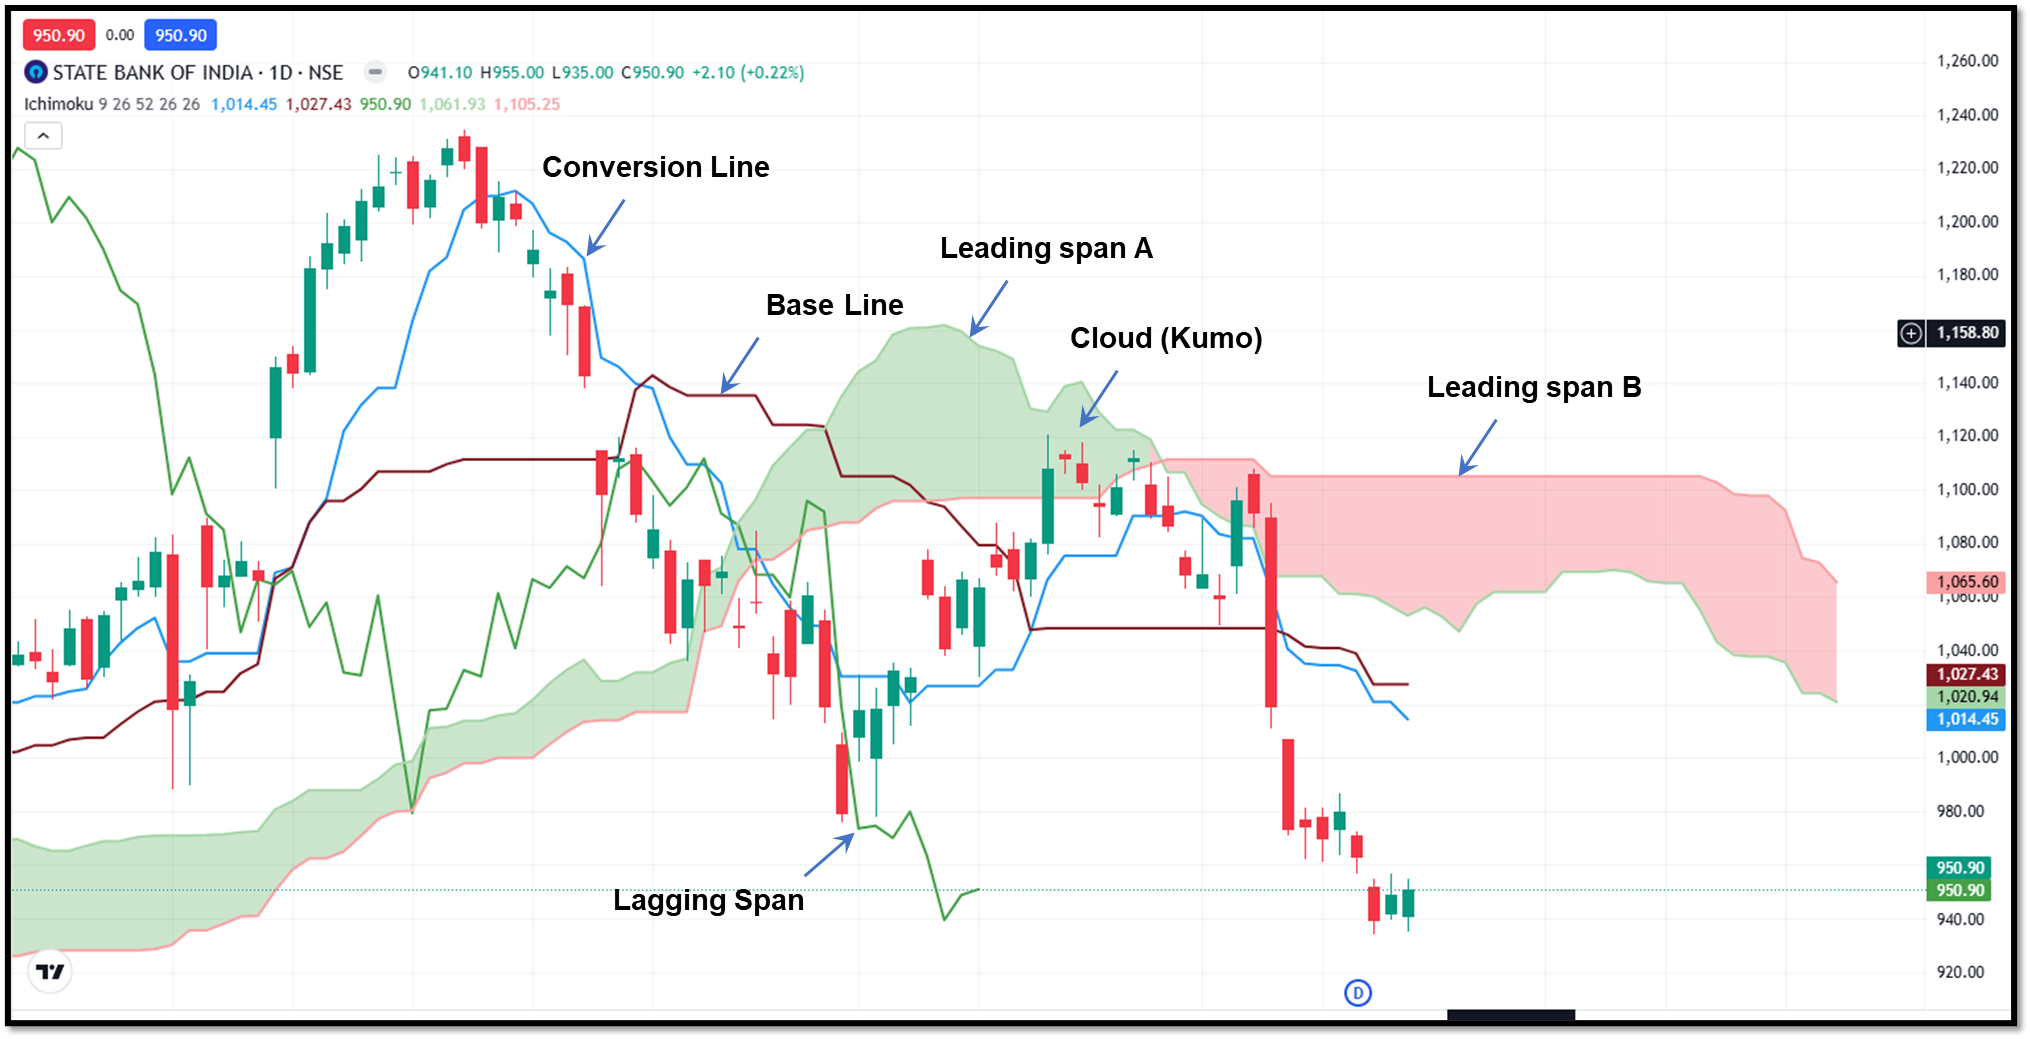
The Ichimoku Kinko Hyo i.e Ichimoku Clould is a comprehensive indicator system that defines support and resistance, identifies trend direction, gauges momentum, and provides trading signals, all in one single indicator system. The most important aspect is the central cloud (Kumo); if the price is above the Cloud, it indicates a bullish trend, and if it is below, it indicates a bearish trend.
The strength of the support or resistance is indicated by the thickness of the Cloud. Ichimoku is preferred by traders who need to have a quick look at the overall trend without going through a variety of charts.
Average Directional Index (ADX)
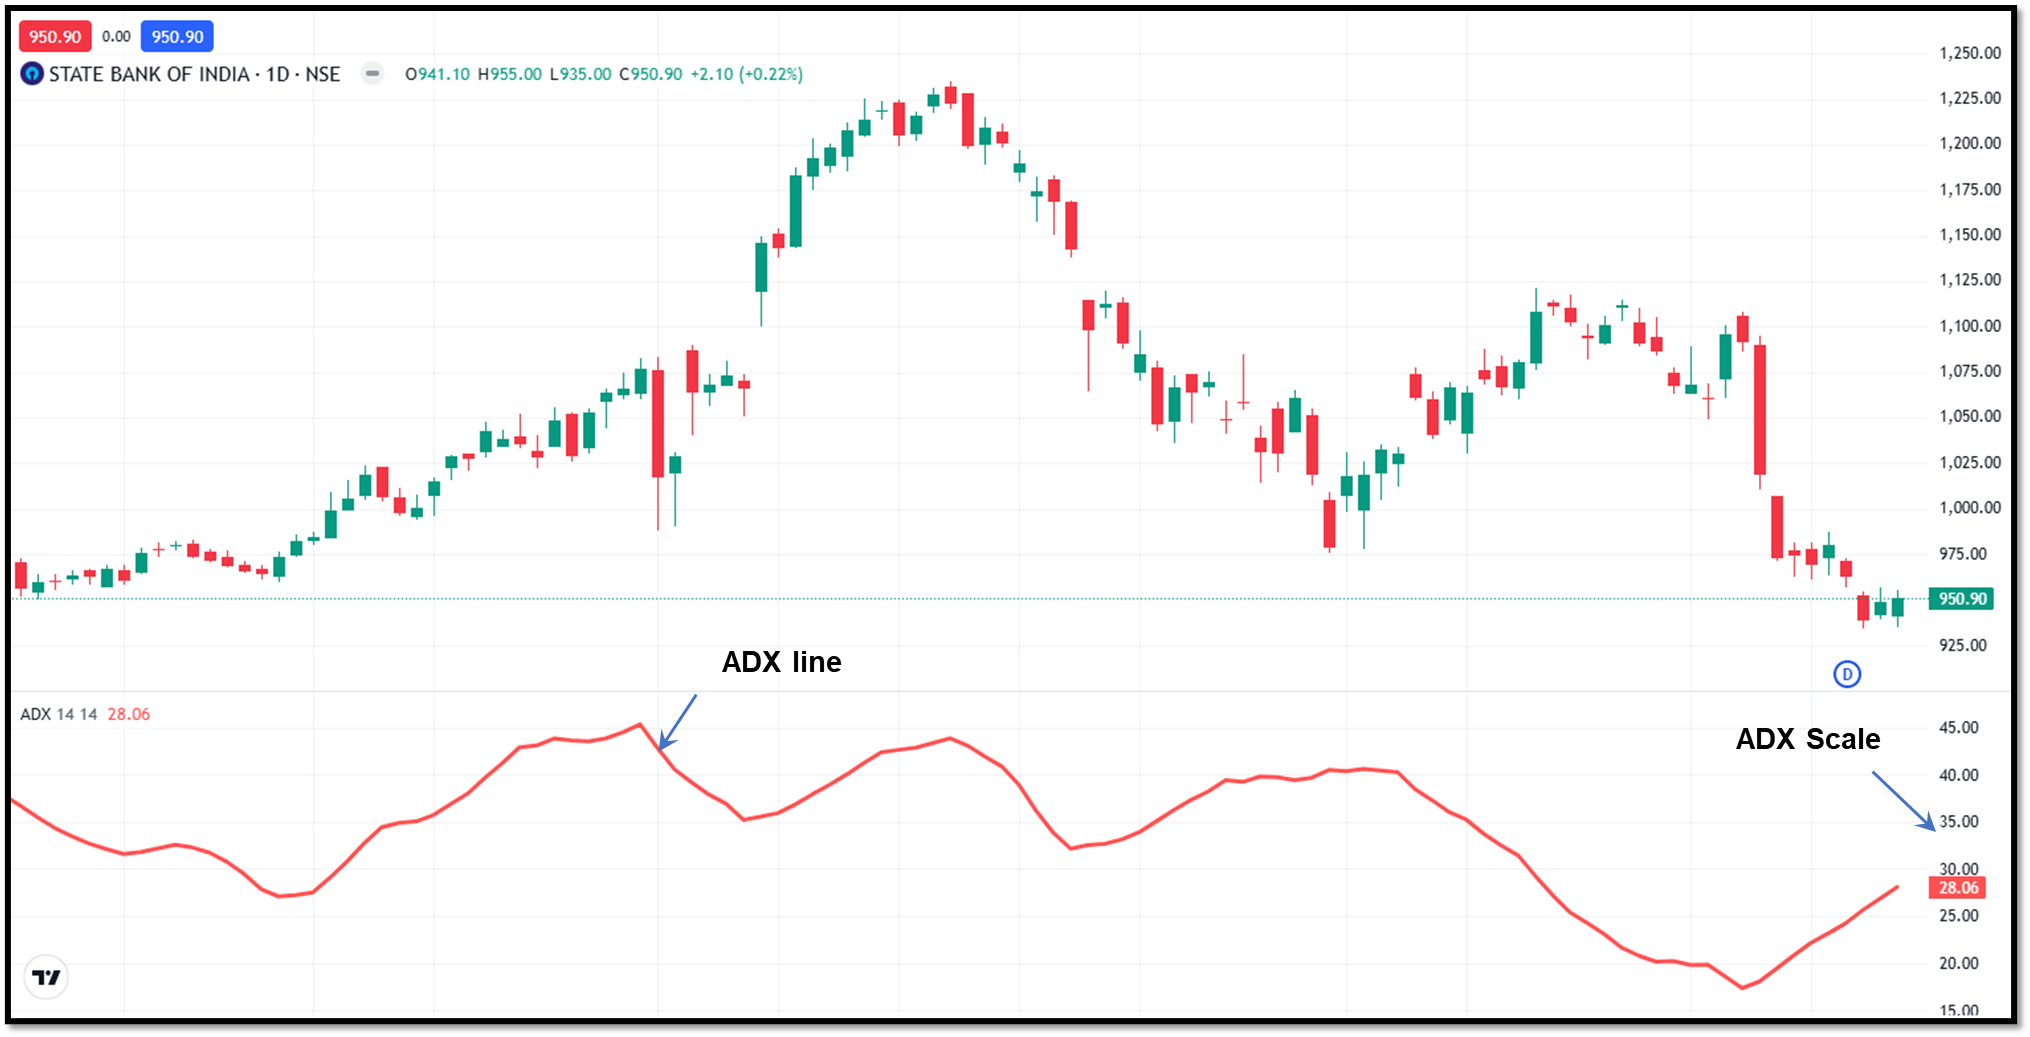
While other indicators focus on the direction of the trend, the ADX focuses on the strength of the trend. The ADX is plotted as a single line ranging from 0 to 100. A reading above 25 indicates a strong trend(whether up or down), while a reading below 20 indicates a weak or ranging market.
The ADX indicator is commonly used in screening bad trades in choppy, sideways markets where trend-following strategies often fail to give accurate analysis.
Parabolic SAR
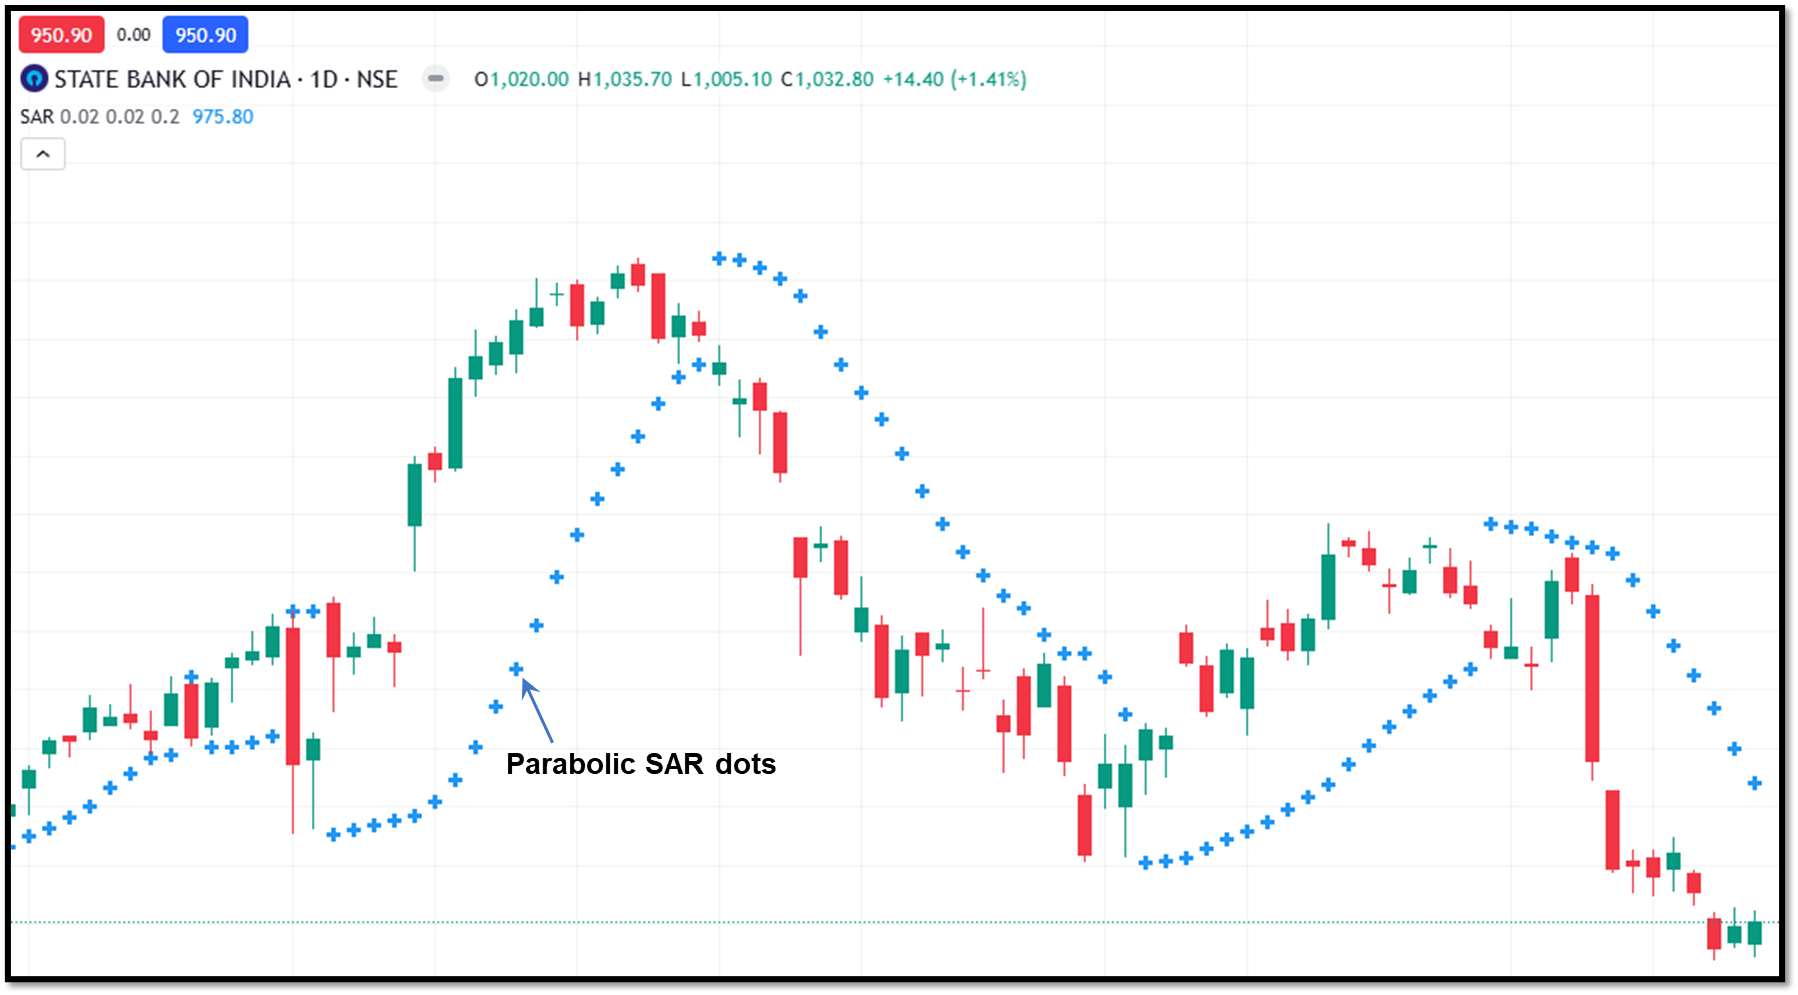
Parabolic SAR (Stop and Reverse) appears as a series of dots at the top or bottom of price candles. Dots below candles represent an uptrend, whereas dots above the candles signal a potential trend reversal or the start of a downtrend.
Most traders use parabolic SAR indicators to set trailing stop losses and lock in profits during active trends.
Volume Profile (VPVR)
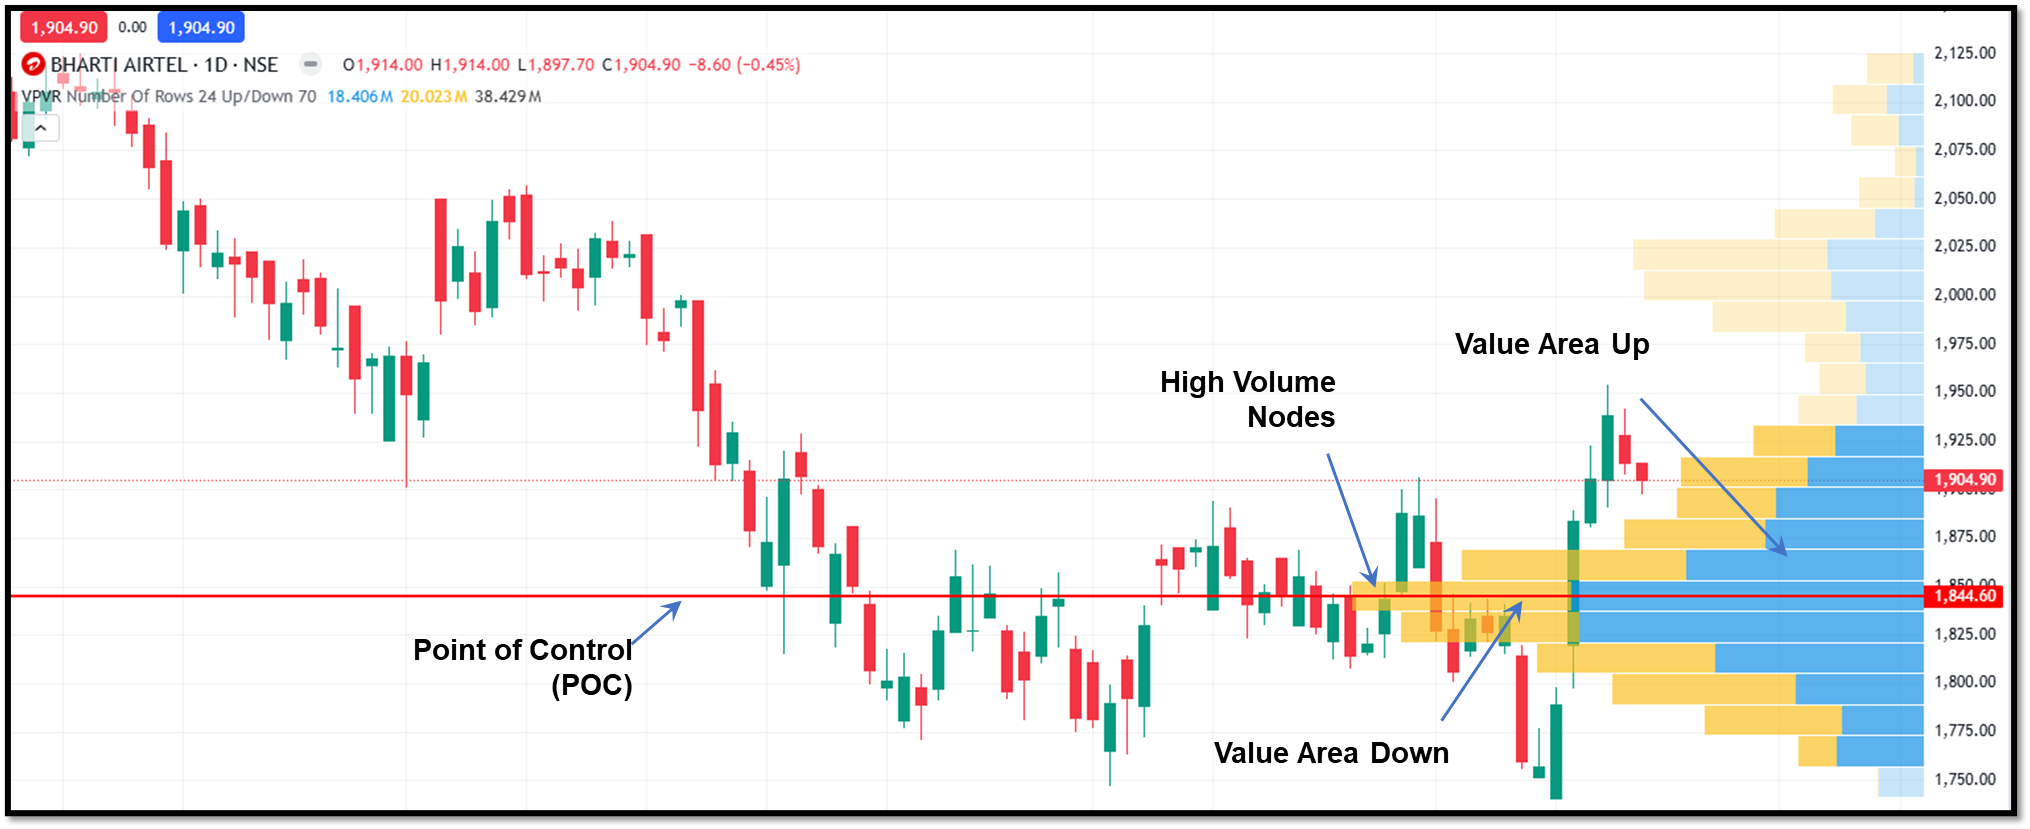
Volume Profile is an effective indicator that plots volume horizontally at specific price levels. It determines the point of control (POC), which represents the price level where the highest volume of trades occurred over a set period.
These high-volume nodes often act as massive support or resistance magnets for price, as they represent price levels where significant institutional activity occurred. It is best used for identifying where to enter or exit.
Volume Weighted Average Price (VWAP)
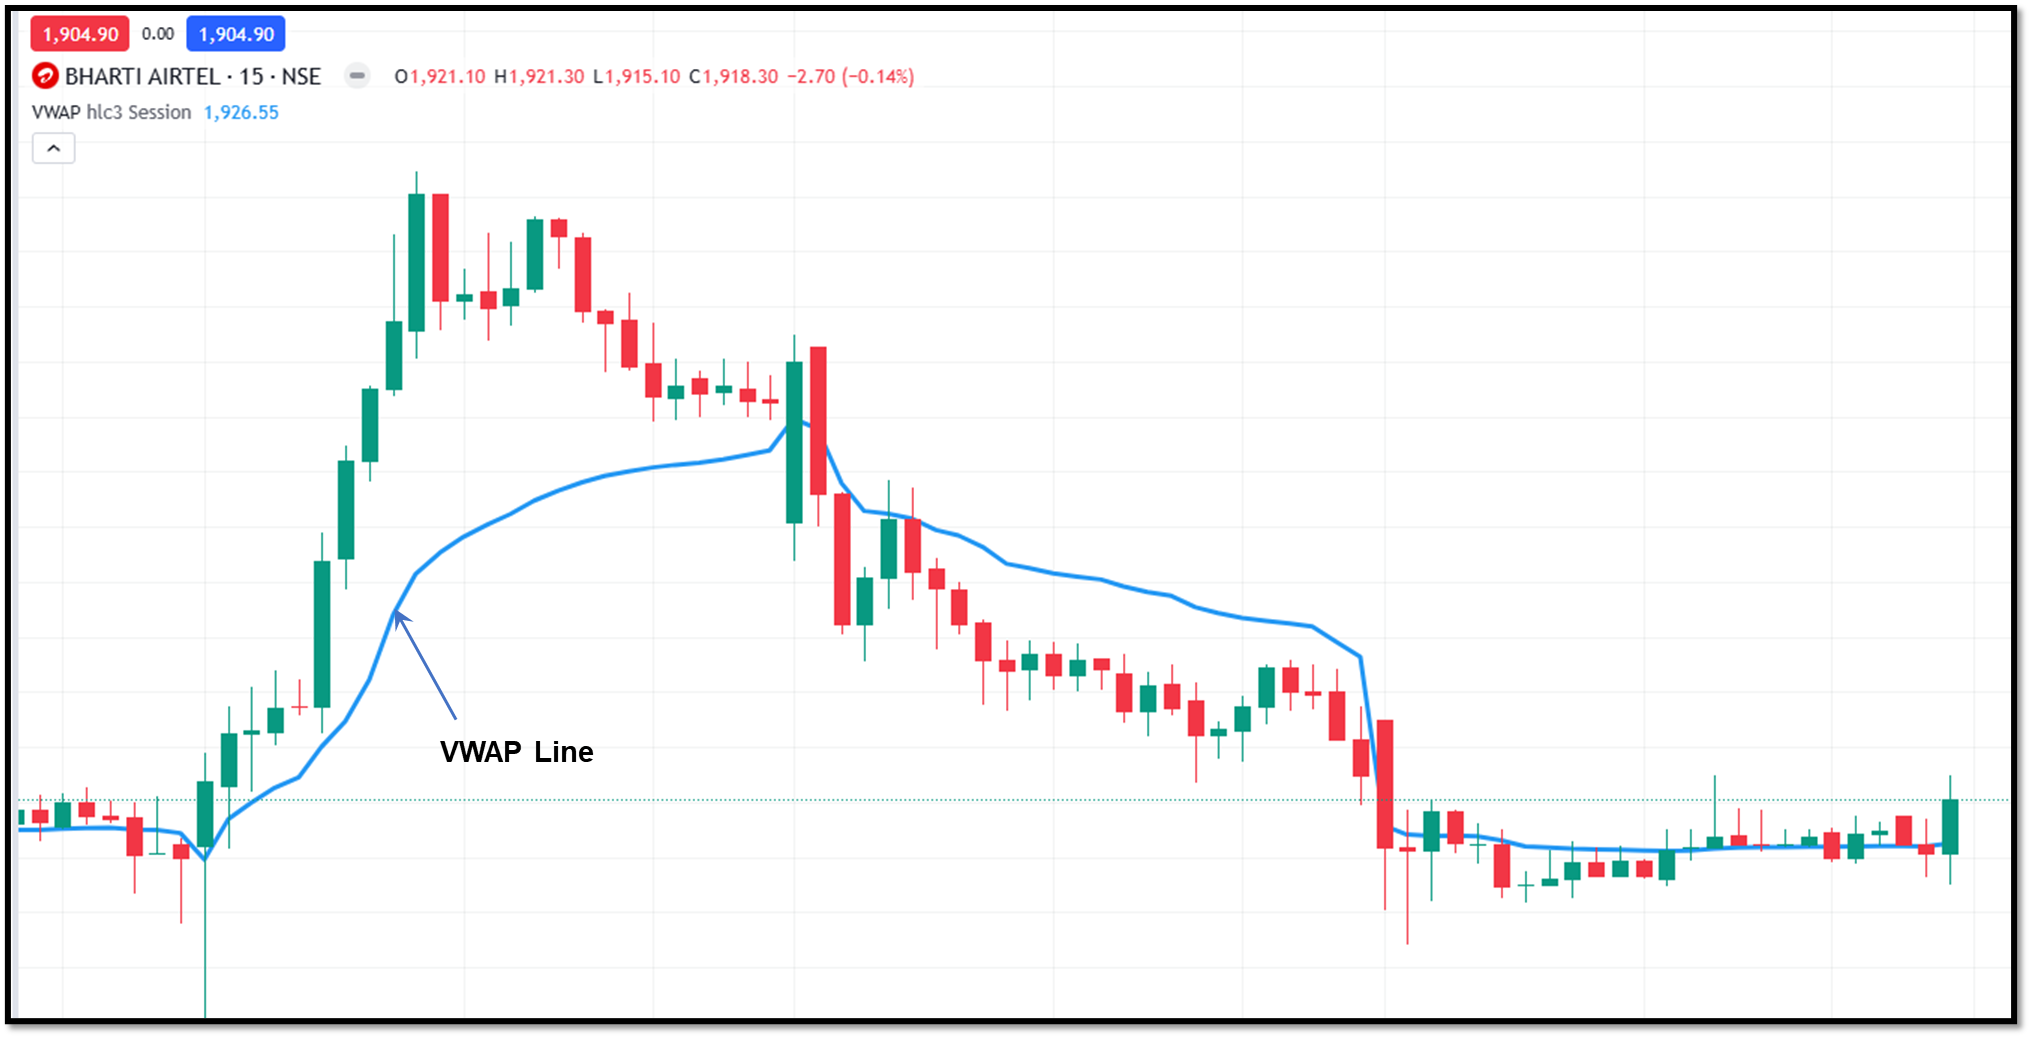
VWAP indicator is used by institutional traders to find the average price at which a stock traded during a day, based on both the volume and price. When the current price is above the VWAP, it indicates that the buyers are in control, which is a bullish sentiment.
When the price is below VWAP, the sellers are in control, indicating bearish sentiment. Traders and institutions use VWAP to ensure that they are receiving a fair price for large orders, making it an important trading tool for intraday traders looking to trade in line with the intraday mood of the market.
On-Balance Volume (OBV)
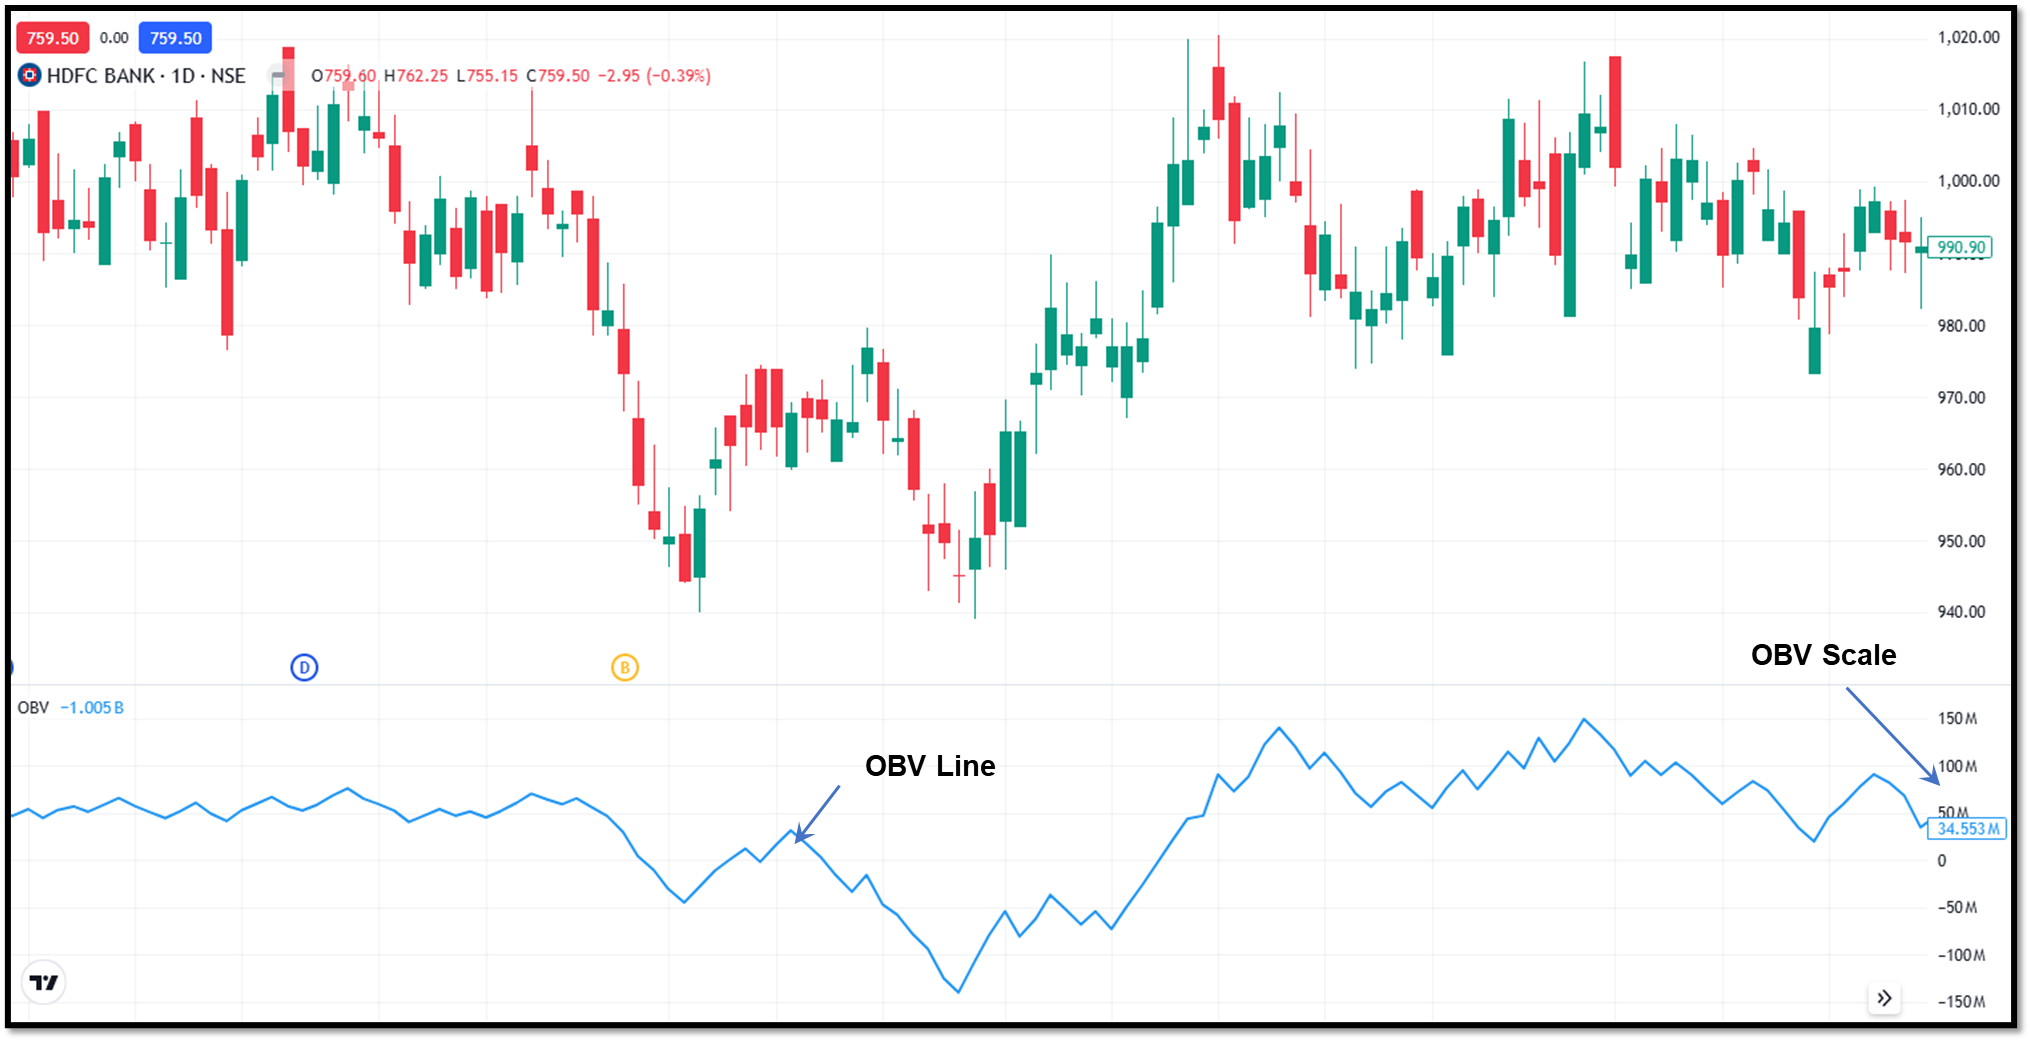
The OBV indicator can be used to identify accumulation or distribution phases before the market actually changes. A flat or declining market price with a rising OBV indicates that some investors are quietly accumulating, which often precedes a bullish breakout.
A declining OBV with a rising market price indicates a lack of strong buying conviction.
Average True Range (ATR)
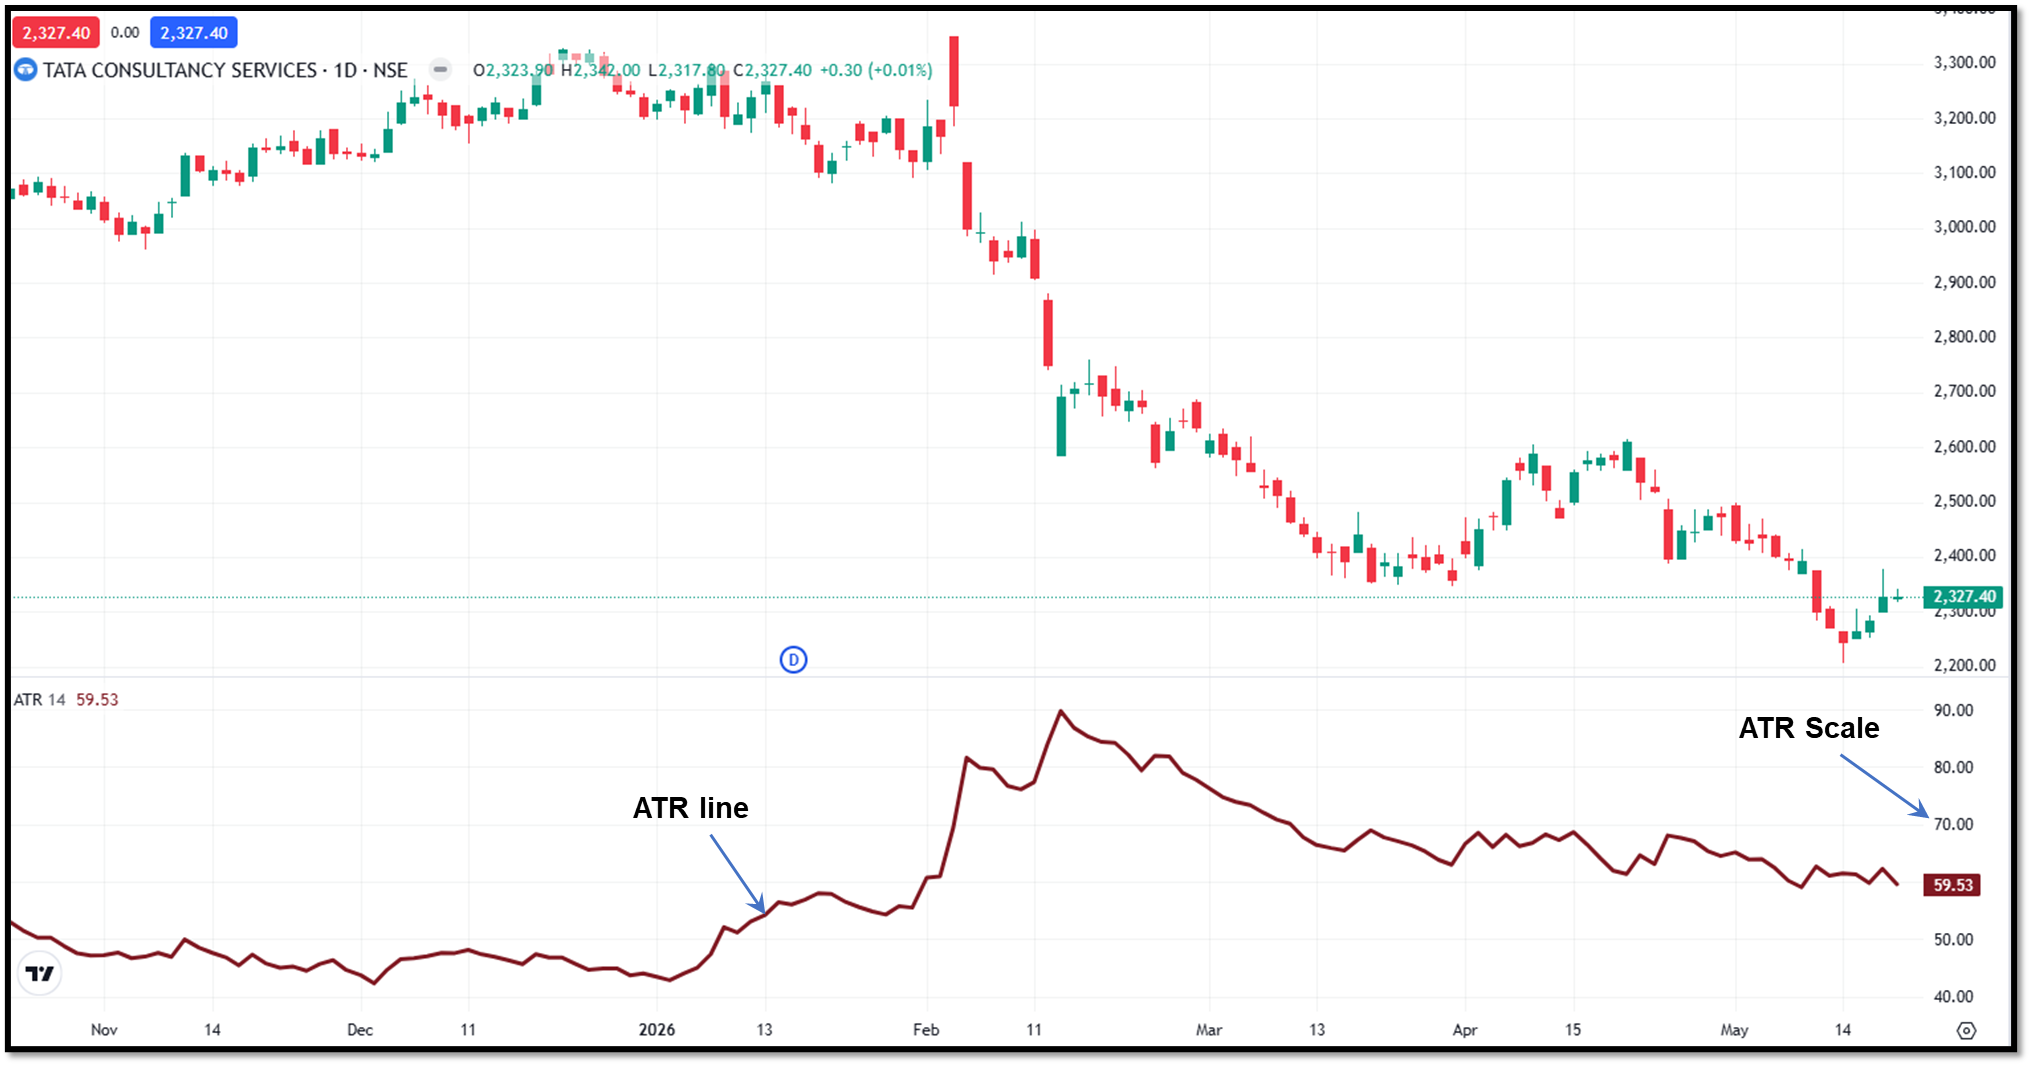
ATR does not indicate the direction of the trend. Instead, it measures market volatility by decomposing the entire range of asset prices during a specific period. A high ATR indicates large price swings or high volatility, while a low ATR is a sign of consolidation.
Traders use ATR to determine safe stop loss levels. The ATR indicator is important in risk management and position sizing trades.
Fibonacci Retracement
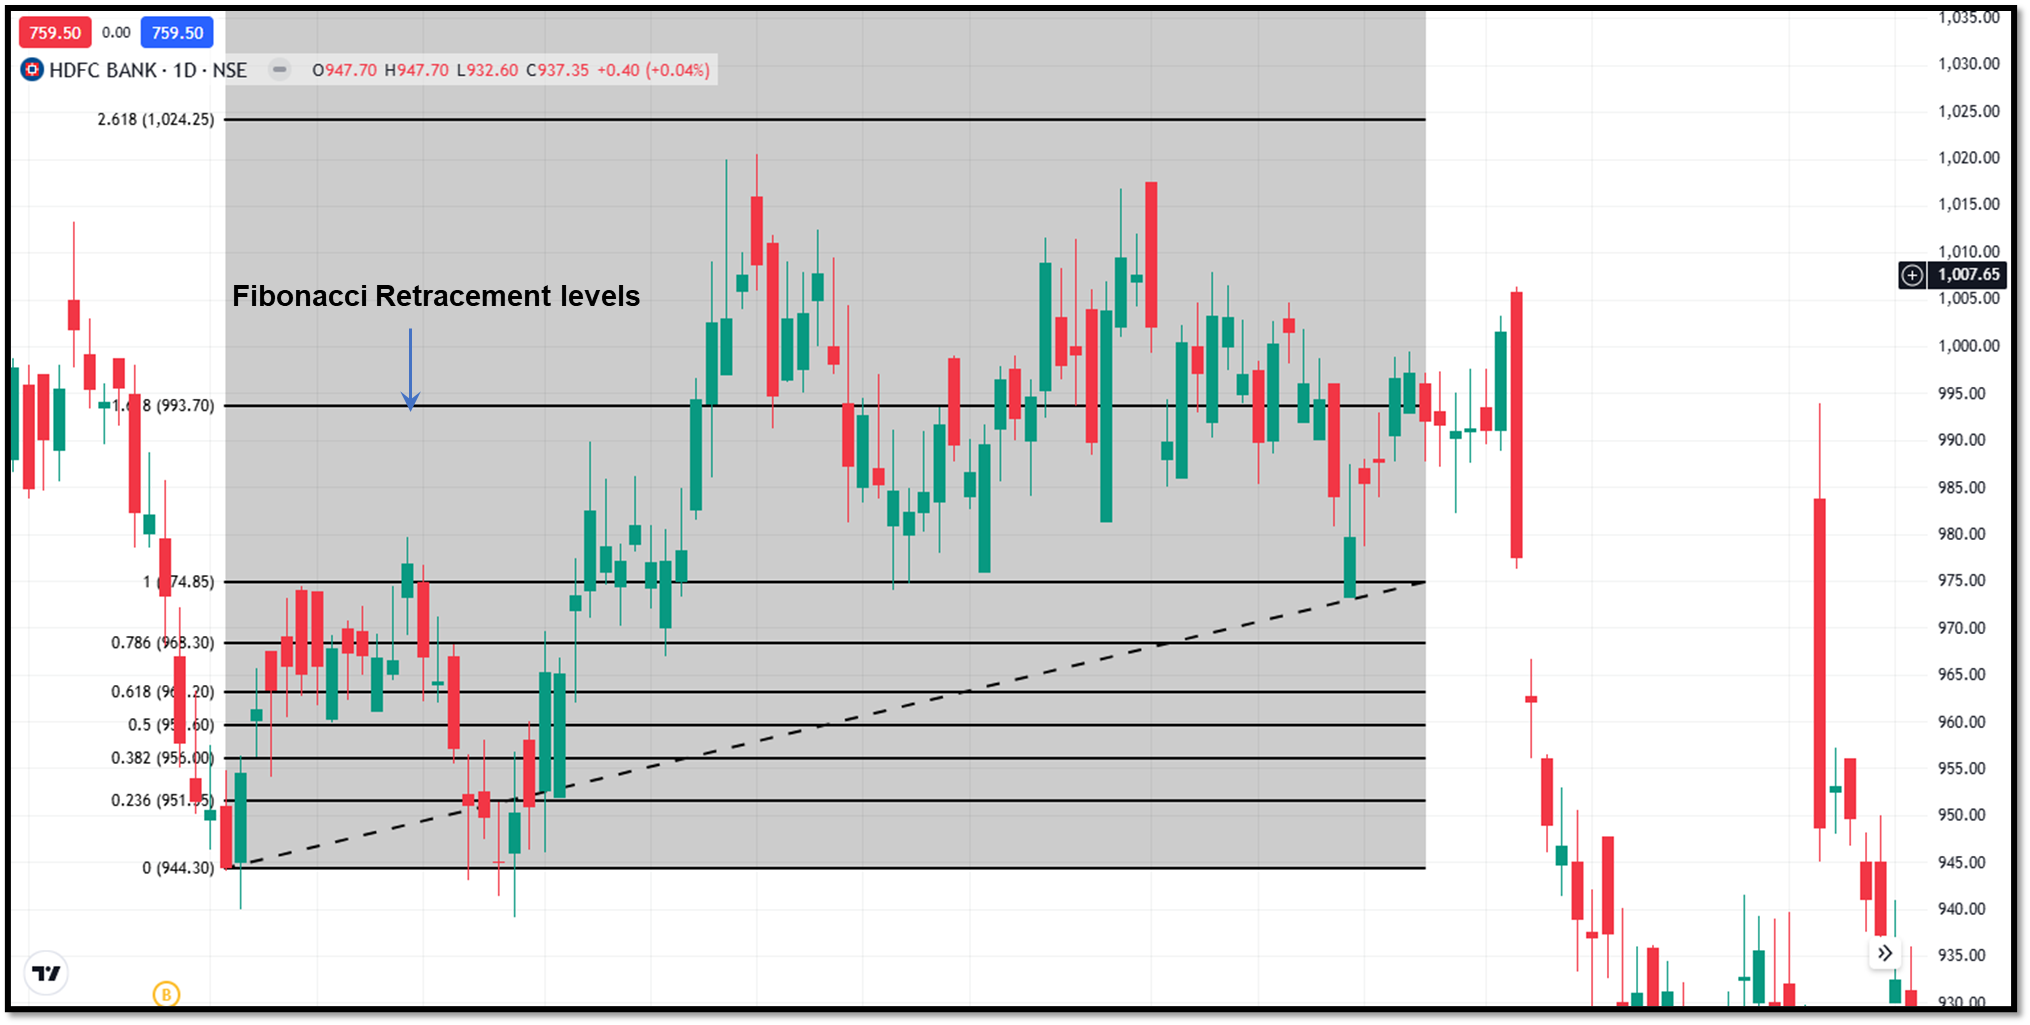
TradingView's Fibonacci retracement indicator offers an Auto Fib Retracement that automatically plots important horizontal levels from a swing low to a swing high at ratios such as 23.6%, 38.2% and 61.8%.
The 61.8% level, also known as the Golden Ratio, is a zone where the pullbacks tend to reverse, and it is closely watched by traders. The Fibonacci retracement indicator is used to identify entry points in a market pullback.
Pivot Points Standard
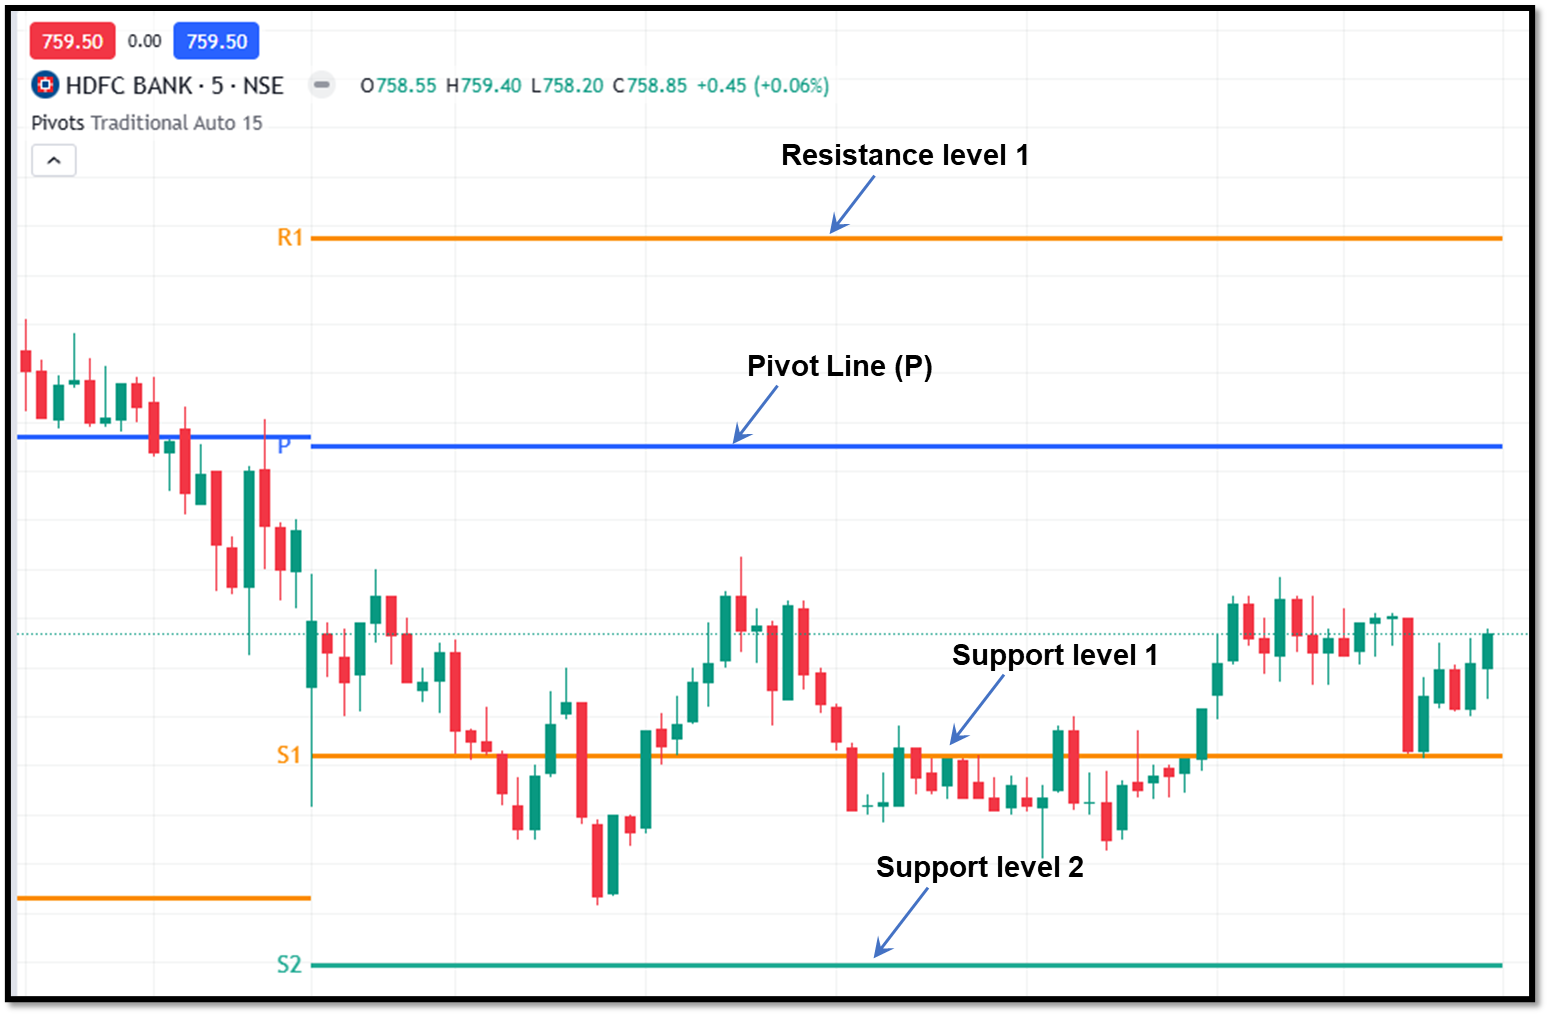
Before electronic trading, floor traders determined daily levels based on the previous day's High, Low and Close. Pivot Points indicator automatically plots a central Pivot Point (P) and Support and Resistance levels (S1, S2 and R1, R2).
These lines are objective areas where prices tend to react or pause. It is useful for intraday traders who need automatic, mathematical profit targets and entry zones.
Stochastic Oscillator
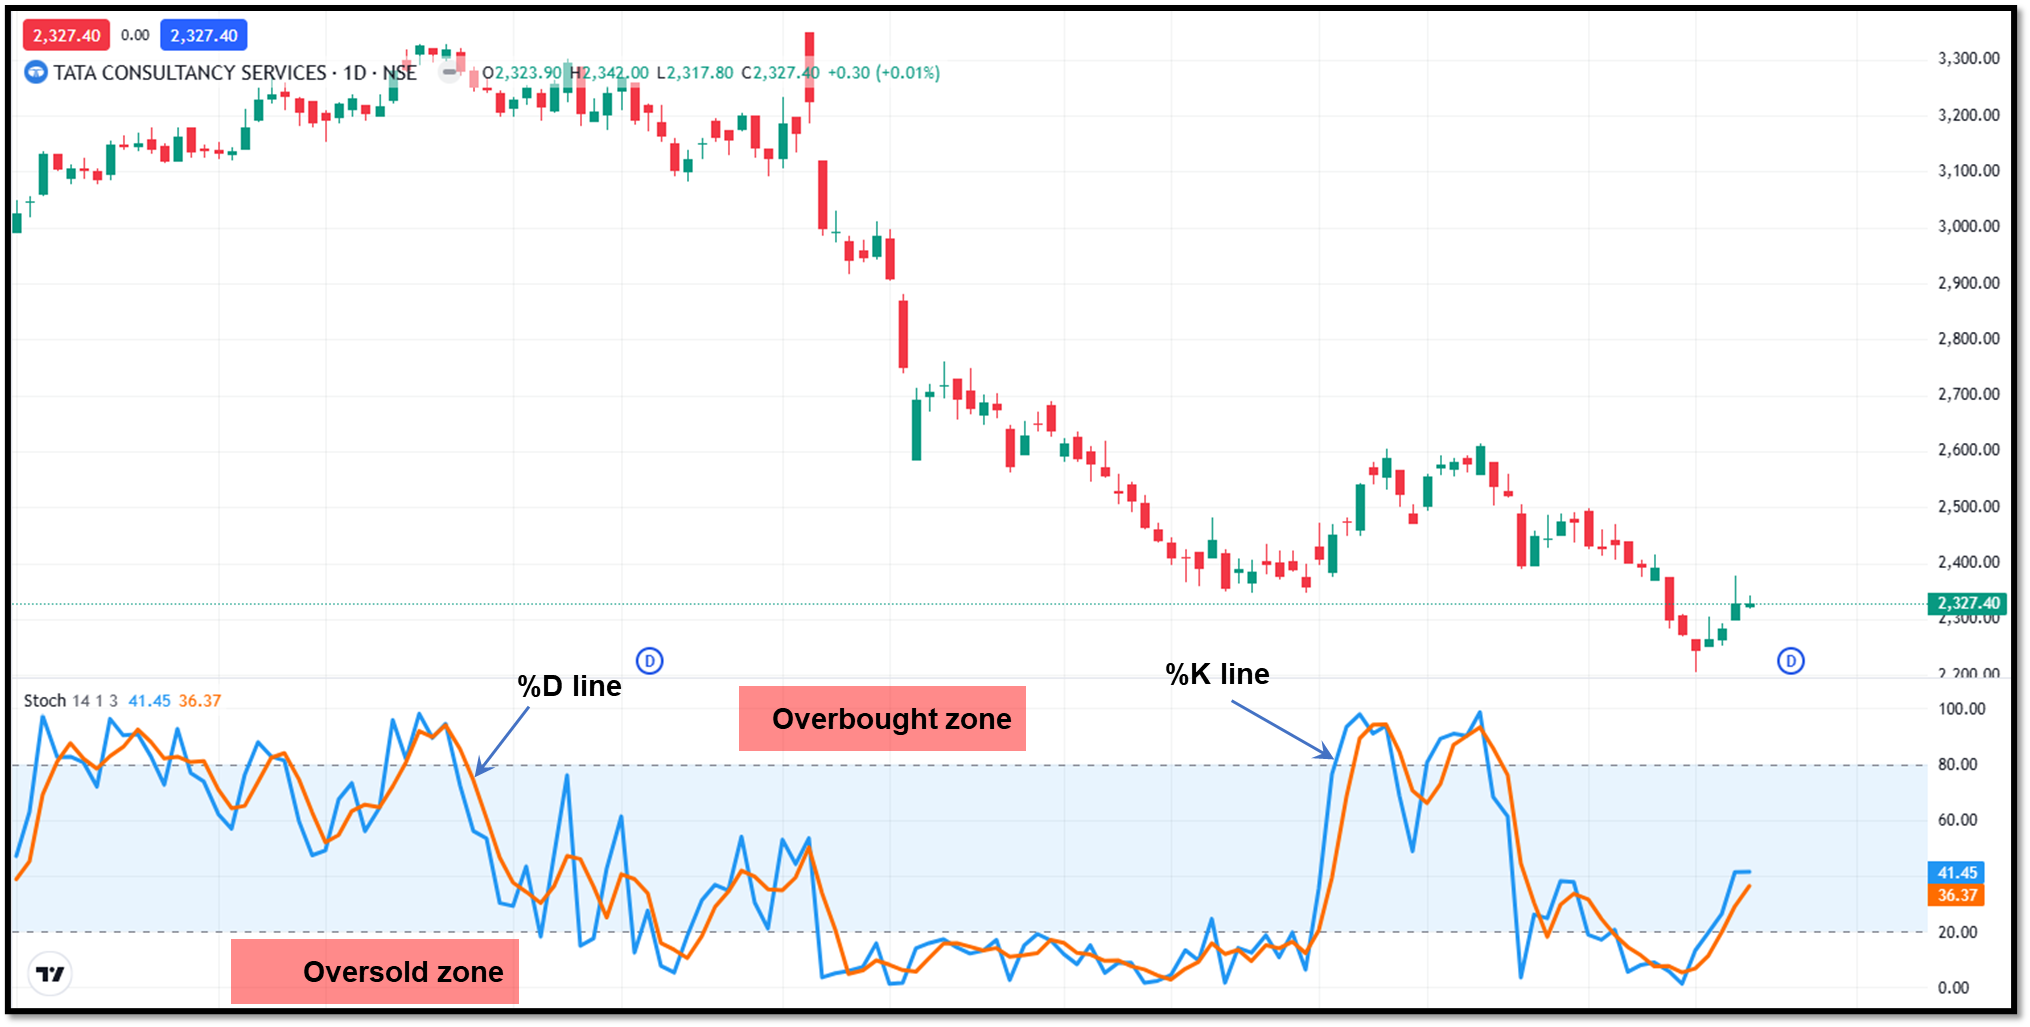
The Stochastic Oscillator is another similar indicator, but it is more sensitive than RSI. It compares the specific closing price of a security with respect to its price range over a given period and displays two lines, namely, %K and %D.
Crossovers in the overbought zone (above 80) or oversold zone (below 20) provide buy or sell signals, respectively. Due to its faster reaction time than RSI, the Stochastic is ideal for scalping and trading in range-bound markets.
Conclusion
Understanding the specific purpose of each indicator is the first step towards successful trading. Successful traders on TradingView frequently use a combination of two or three indicators from different categories to create a strong system according to their individual needs. The key lies in instead of adding too many indicators that give conflicting signals, and traders should master a few different tools according to their needs. With Dhan, you can trade using these indicators directly on TradingView Charts.
FAQs
Which is the best TradingView indicator for beginners?
Beginners should start with simple yet widely tested tools such as Moving Averages, RSI and Volume. These indicators show the direction of trends, the momentum and participation in the market. These tools aid new traders in understanding price behaviour without overwhelming them with complexity. Once they are comfortable, they can add more indicators over time to enhance the analysis.
Can different TradingView indicators be used on the same chart?
Yes. TradingView allows traders to add more than one indicator at the same time on a single chart. Traders can add moving averages oscillators like RSI or MACD, along with the volume-based indicators on the same chart. However, it's best to avoid adding indicators that measure the same data in a similar way, as this can lead to redundant signals and confusion.
Are TradingView indicators suitable for intraday as well as long-term trading?
TradingView's indicators are time frame independent and therefore they can be applied for intraday, weekly, or monthly charts. The effectiveness of the TradingView indicator is dependent on how it is configured and interpreted, rather than the timeframe itself.
Are TradingView indicators free to use?
TradingView offers a large number of indicators for free, including popular tools such as RSI, MACD, Bollinger Bands, Moving Averages, and Volume. It offers core technical indicators for free to all its users.
Do TradingView indicators ensure accurate or profitable trading signals?
No indicator can be used to ensure accurate or profitable signals. As indicators are analytical tools intended to assist traders in their decision-making, they do not forecast results in advance. They work best when combined with price action analysis, risk management, and an understanding of broader market conditions. Successful trading relies on disciplined execution rather than indicator signals alone.







