



Multiple Candlestick Patterns








Key takeaways
- Candlestick patterns that form with two or more consecutive candles are known as multiple candlestick patterns. They give a stronger insight into the sentiment of the market than a single candle pattern.
- Multiple candlestick patterns can signal potential trend reversals, continuations, or periods of indecision.
- While multiple candlestick patterns are more reliable than single candlestick patterns, they should always be used along with support and resistance levels, volume, and technical indicators.
Candlestick charts are one of the most popular tools in technical analysis as they help traders understand how buyers and sellers interact over time. While a single candlestick can reveal useful information about one trading session, analysing multiple trading sessions can reveal a clearer picture of the market.
Multiple candlestick patterns examine the relationship between two, three, or sometimes more consecutive candles. The combined price action often gives a fuller picture of changing market sentiment and possible future direction.
Multiple candlestick patterns usually appear in stocks, forex, commodities, cryptocurrencies, and indices. They help identify possible trend reversals and trend continuations. However, they assure nothing about future price movement. When combined with market analysis and confirmation signals, you can improve their reliability.
What are Multiple Candlestick Patterns?
Multiple candlestick patterns are chart formations that consist of two or more consecutive candlesticks. These candlestick formations analyse how several sessions interact with each other.
Each candle contributes information about buying pressure, selling pressure, momentum, and trader sentiment. When seen together, these candles can reveal glimpses of future price movements. Multiple candlestick patterns are generally categorised as follows:
- Bullish reversal patterns, which suggest a possible upward reversal after a downtrend.
- Bearish reversal patterns, which indicate a potential downward reversal after an uptrend.
- Continuation patterns, which suggest that the existing trend may resume after a brief pause.
Bullish reversal patterns
Bullish reversal patterns generally appear after a downtrend and suggest that buyers may be beginning to regain control.
Bullish engulfing
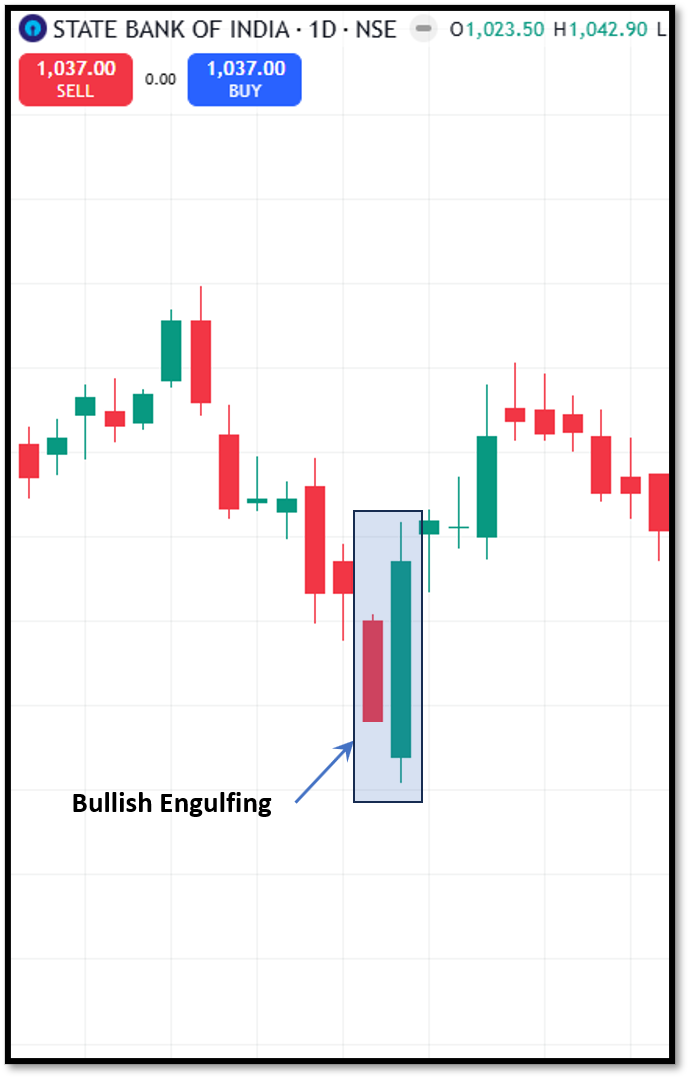
The Bullish Engulfing pattern is a two-candlestick formation. The first candle is bearish, reflecting continued selling pressure. The second candle is bullish and completely covers the real body of the previous bearish candle.
This pattern suggests that buyers have overwhelmed sellers and may be attempting to reverse the existing downtrend. Some of the key characteristics of the bullish engulfing pattern:
- Two-candle pattern
- Appears after a downtrend
- First candle is bearish
- Second candle is a larger bullish candle
- Bullish candle completely covers the previous candle's body
Piercing Line
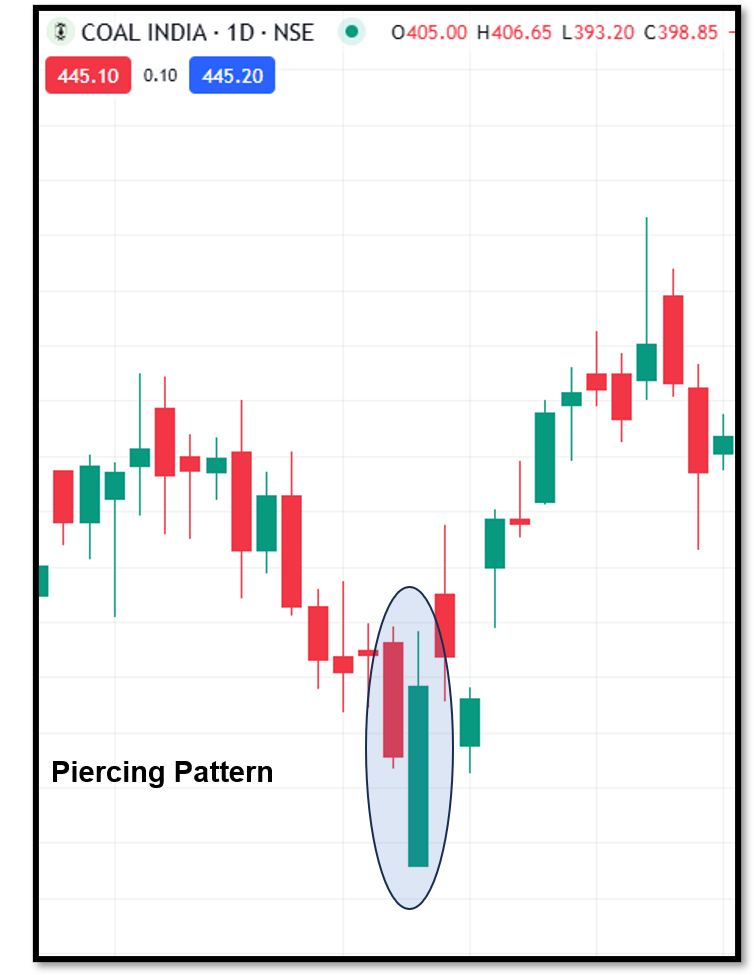
The Piercing Line is another two-candlestick bullish reversal pattern.
It begins with a strong bearish candle followed by a bullish candle which opens below the previous close but closes above the midpoint of the first candle. This shows that buyers are beginning to challenge selling pressure.
Morning Star
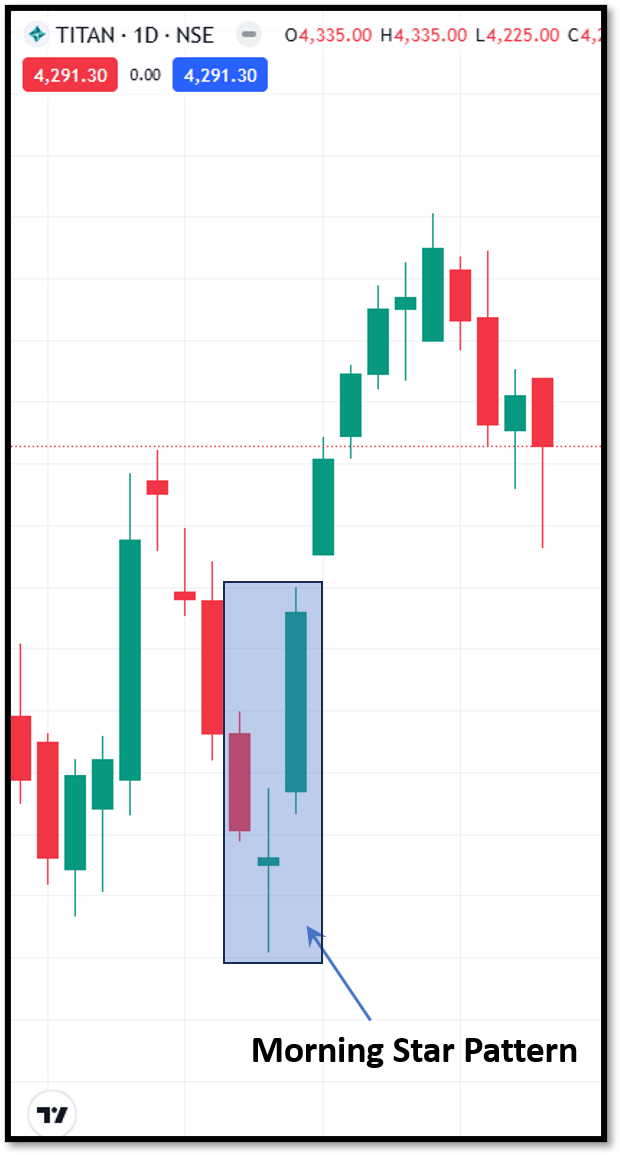
The Morning Star is a three-candlestick bullish reversal pattern. The first candle is a strong bearish candle while the following candle has a small body, indicating indecision. The third candle is a bullish candle with a close well into the body of the first candle. The pattern is showing a gradual shift from bearish sentiment to bullish sentiment.
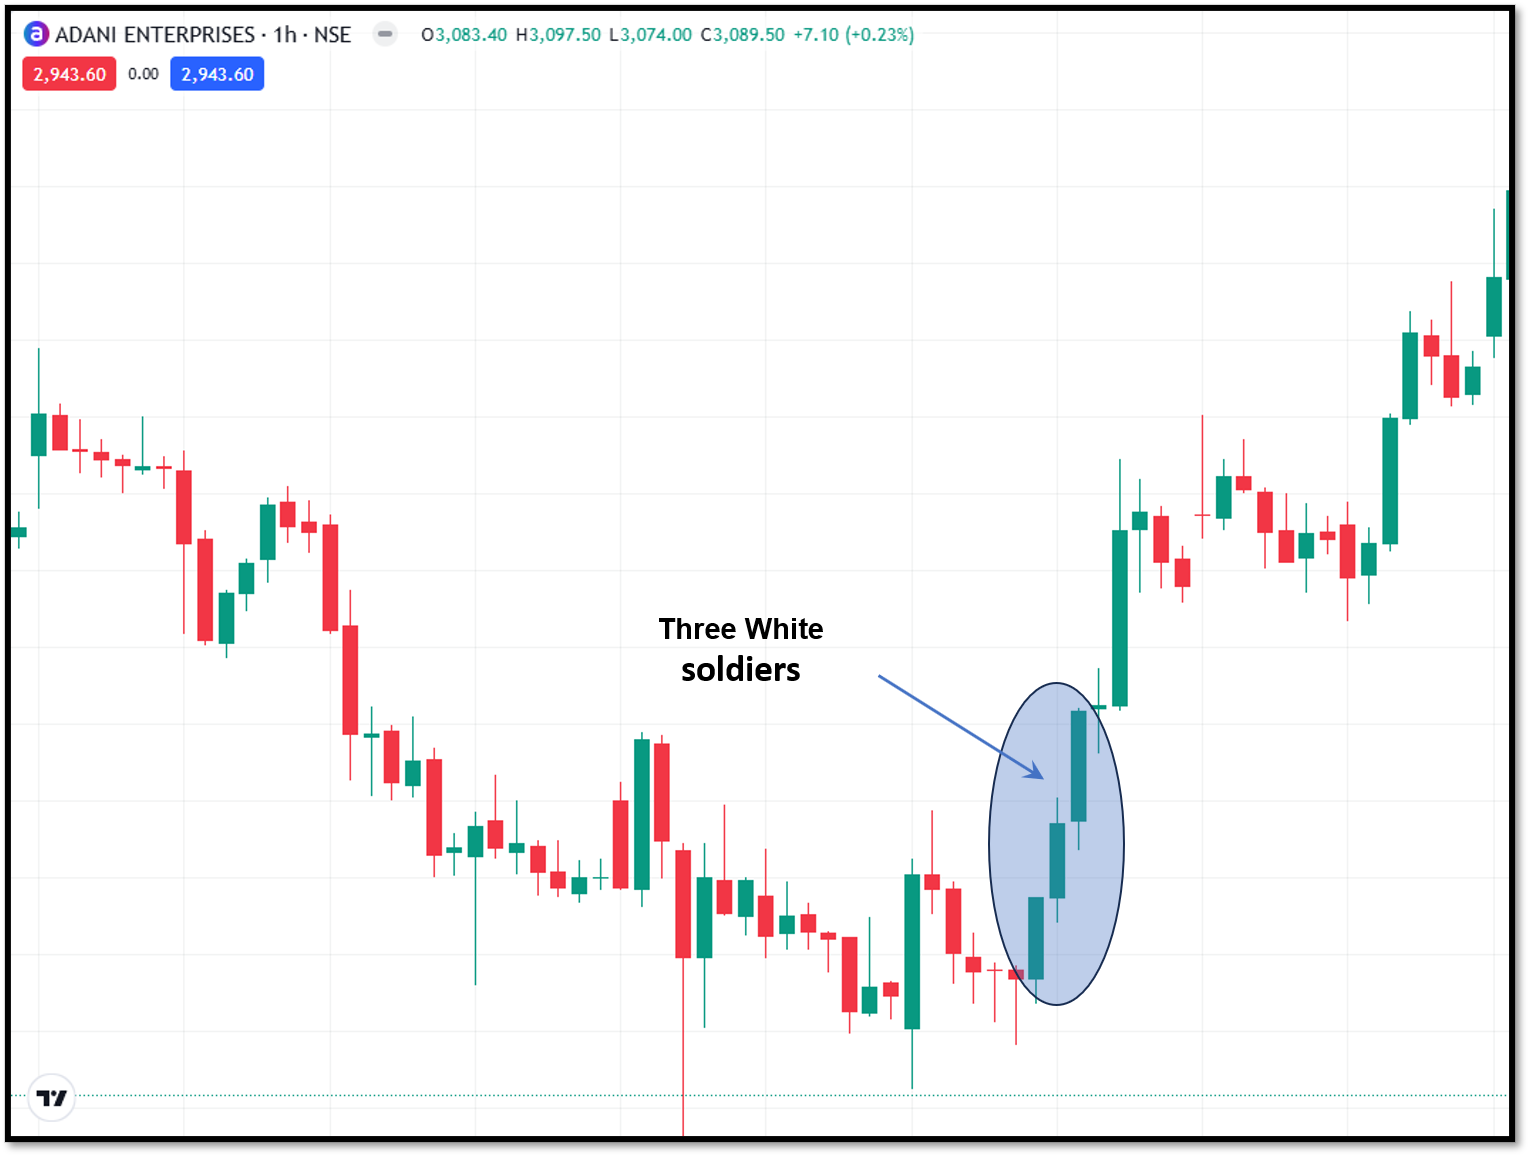
Three White Soldiers
The Three White Soldiers pattern is a bullish reversal pattern that forms after a strong sell-off and represents a possible reversal. It consists of three back-to-back bullish candles. Every candle opens inside the body of the prior candle and closes near the high. This pattern indicates sustained buying pressure, and often marks the start of a stronger uptrend.
The three white soldiers pattern has the following key features:
- Three bullish candles
- Consecutive higher closes
- Small or no upper shadows
- Strong buying momentum
Tweezer Bottom
The Tweezer Bottom is a two-candle bullish reversal pattern. Both candles form nearly identical lows. The pattern indicates that sellers failed to push prices below an important support level, allowing buyers to regain strength.
Bearish reversal patterns
Bearish reversal patterns usually develop after an uptrend and indicate that sellers may be taking control.
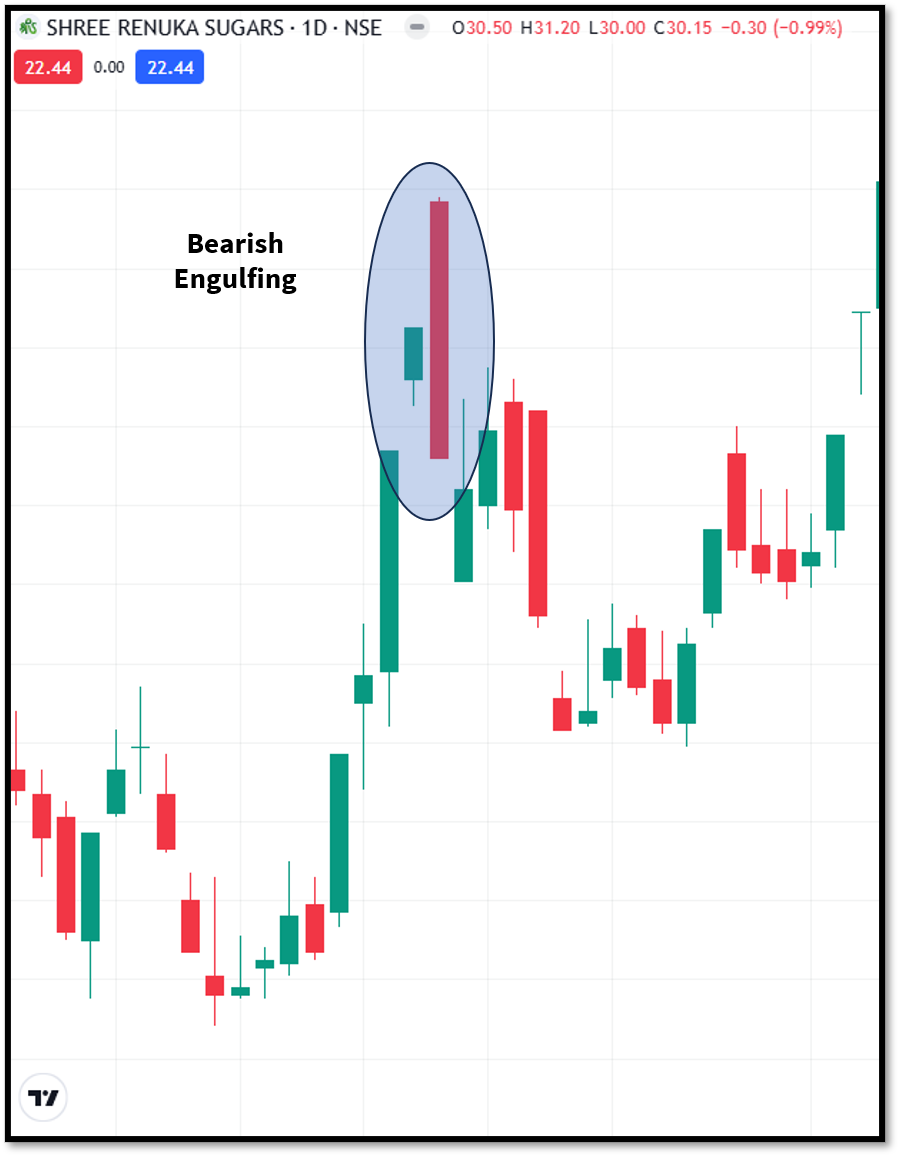
Bearish engulfing
The Bearish Engulfing pattern is the opposite of the Bullish Engulfing. It begins with a bullish candle followed by a larger bearish candle that completely covers the previous candle's body. The pattern suggests that sellers have gained control after an uptrend.
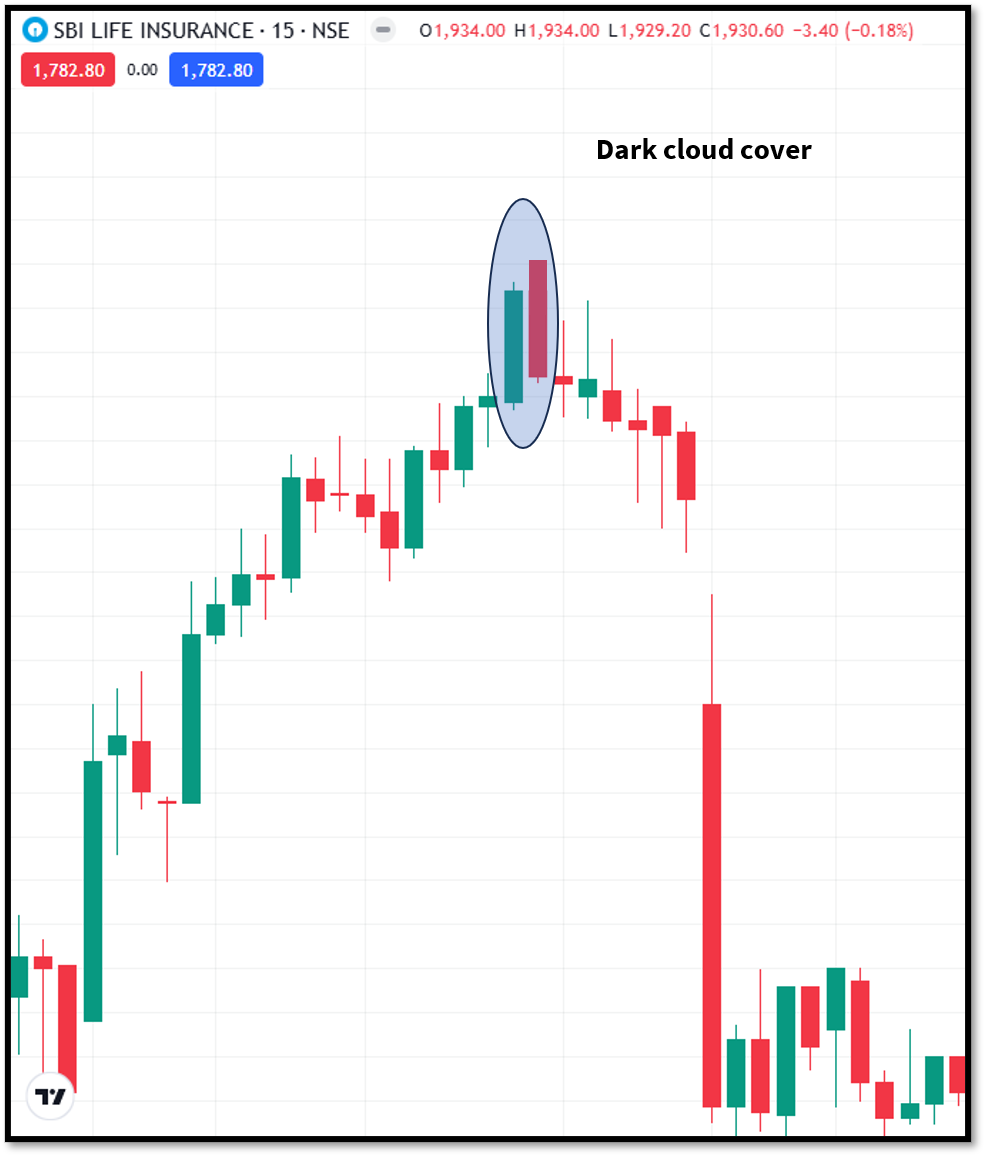
Dark Cloud Cover
The Dark Cloud Cover is a two-candlestick bearish reversal pattern. The first candle is strongly bullish. The second candle opens above the previous high but closes below the midpoint of the first candle. This shows that buyers initially dominated before sellers took control.
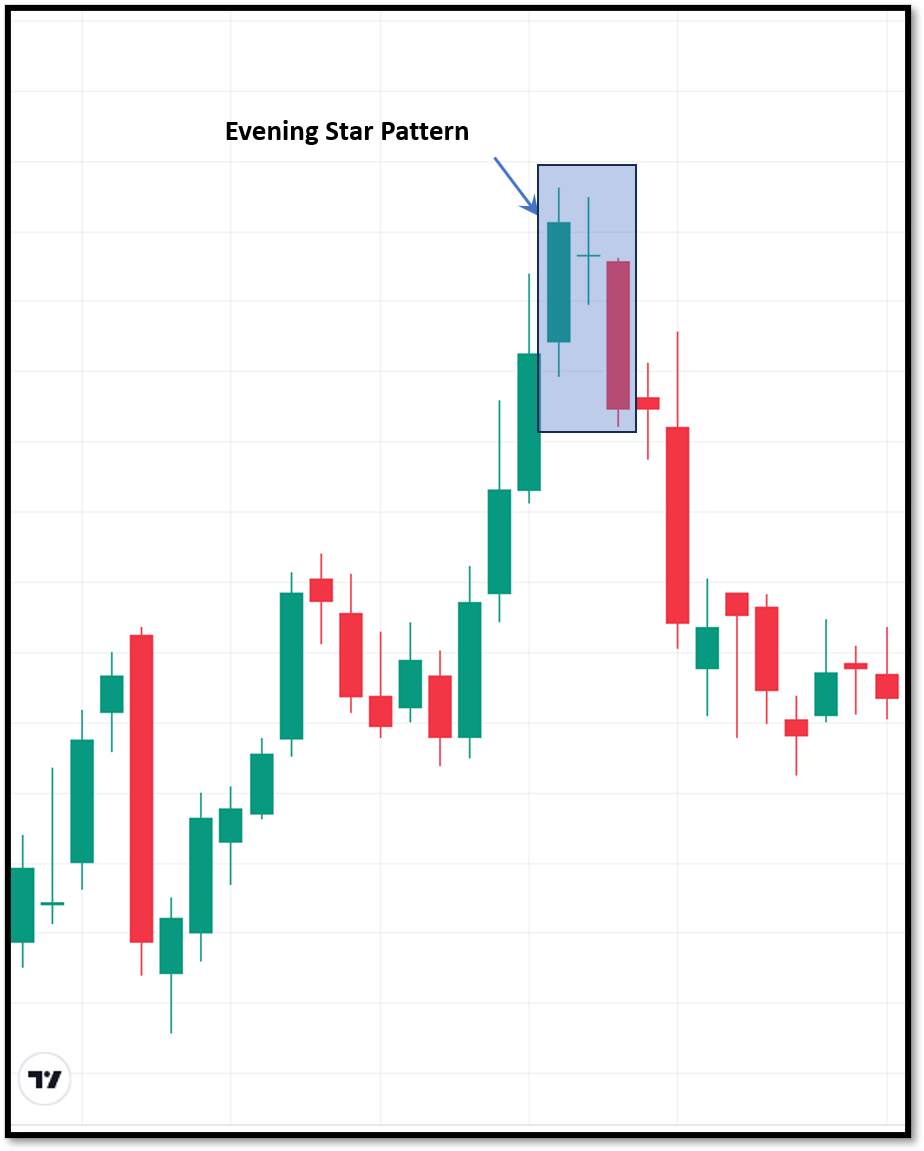
Evening Star
The Evening Star is a three-candlestick bearish reversal pattern. It usually appears after a strong uptrend. The pattern starts with a strong bullish candle, which represents the continuation of the prior trend. The second candle may open within the body of the previous candle or slightly upward. It may move up and down but closes near the opening value, forming a doji. This represents that the market participants are unclear about higher prices.
The third candle is a strong bearish candle that closes deep into the first candle's body. The whole pattern collectively represents that the buying momentum is weakened and selling pressure is increasing.
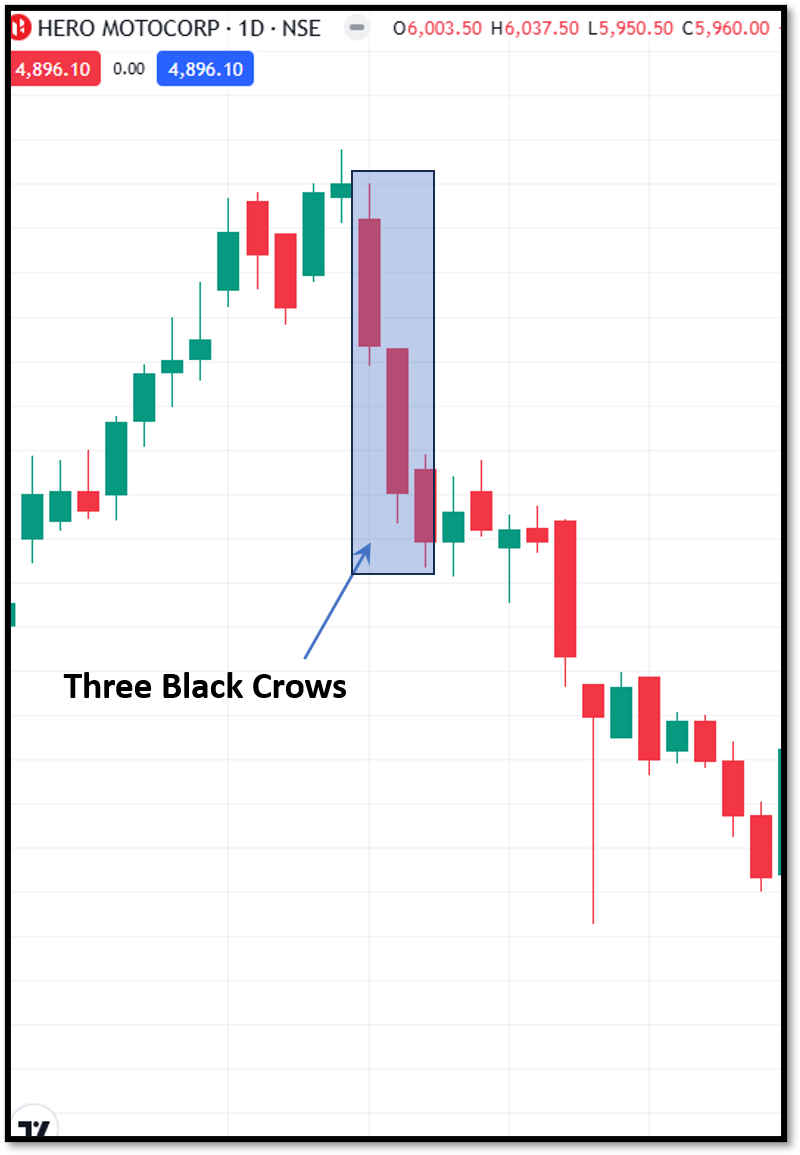
Three Black Crows
The Three Black Crows pattern is a bearish reversal pattern that forms after an uptrend. It consists of three consecutive bearish candles, each opening within the body of the preceding candle and closing lower. The pattern indicates strong selling pressure and is usually the beginning of a bearish trend.
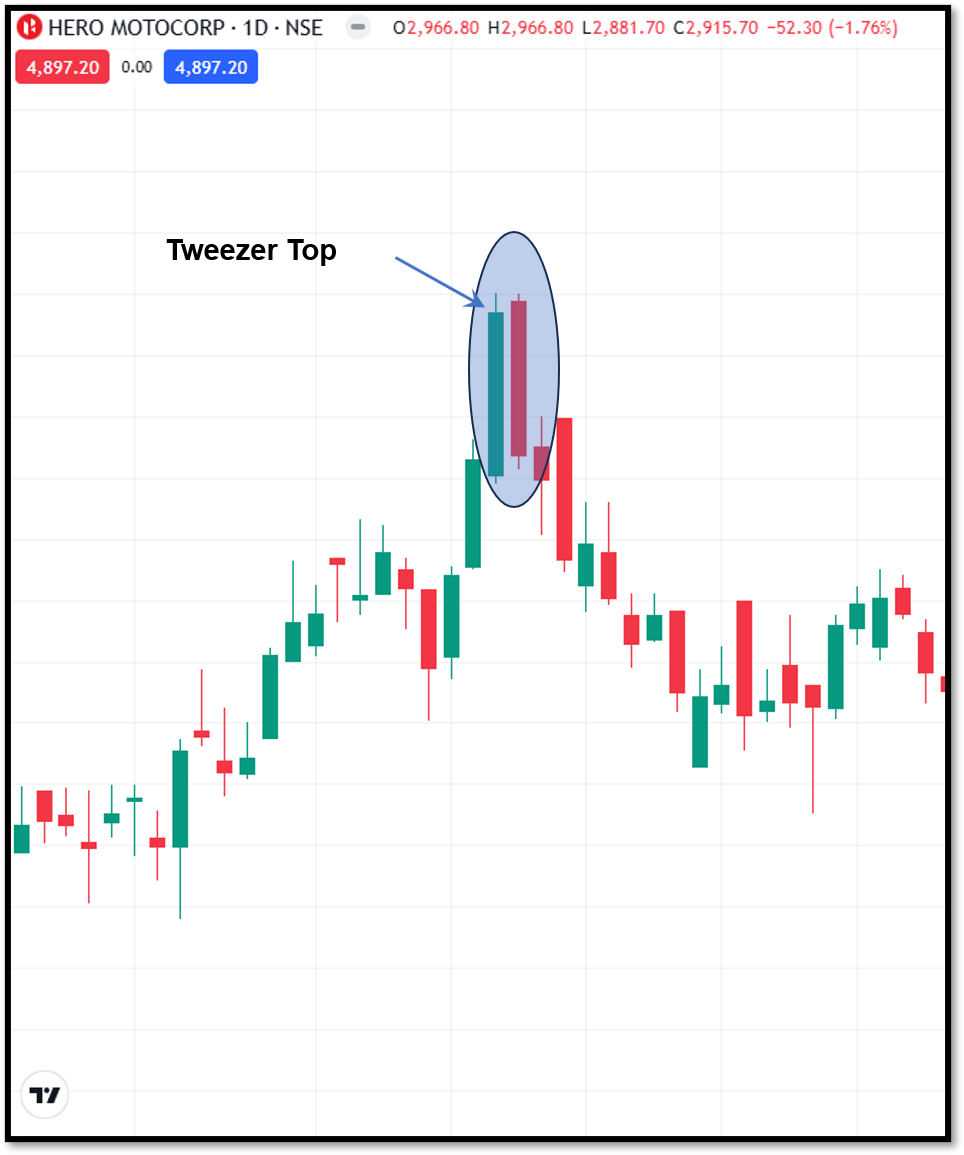
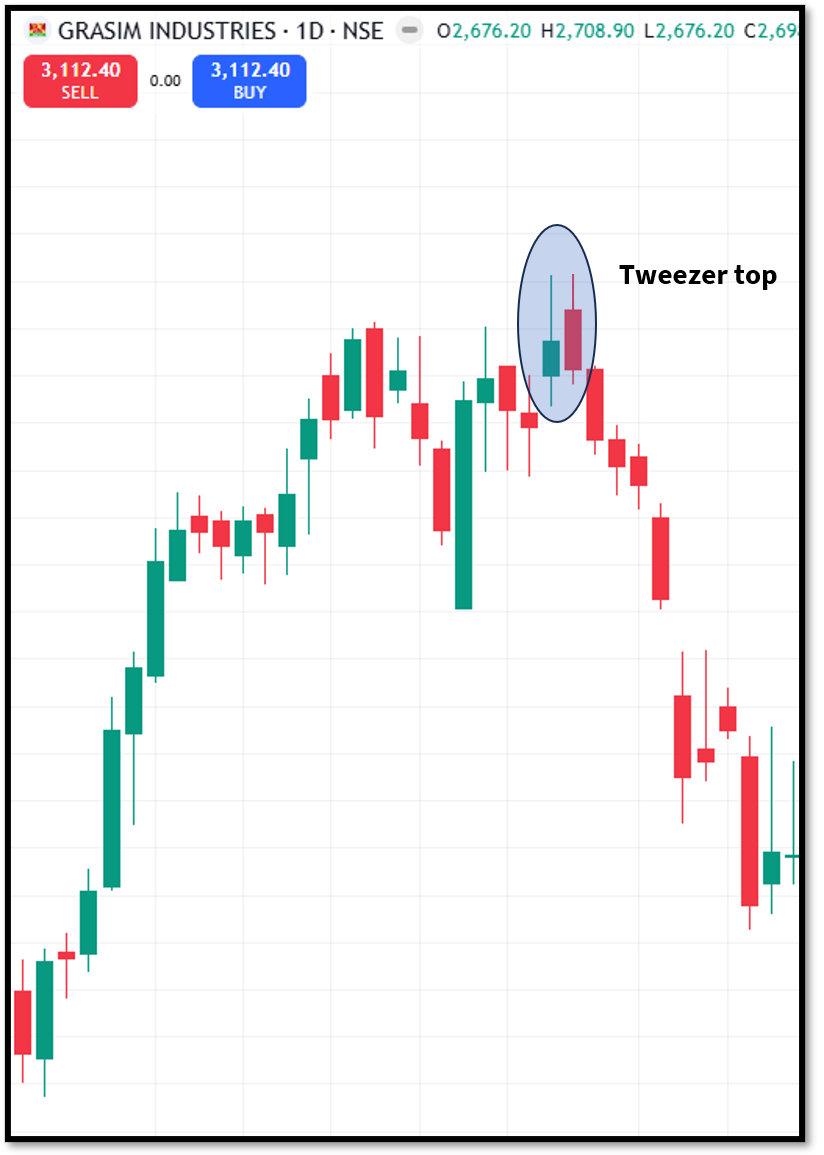
Tweezer Top
The Tweezer Top is a bearish reversal pattern of two candlesticks. The pattern occurs when two consecutive candles make the same high, and then the market starts to reverse. This formation shows that buyers were not able to break through an important resistance level.
Continuation candlestick patterns
Not every multiple candlestick pattern signals a reversal. Some suggest that the existing trend is likely to continue after a brief pause.
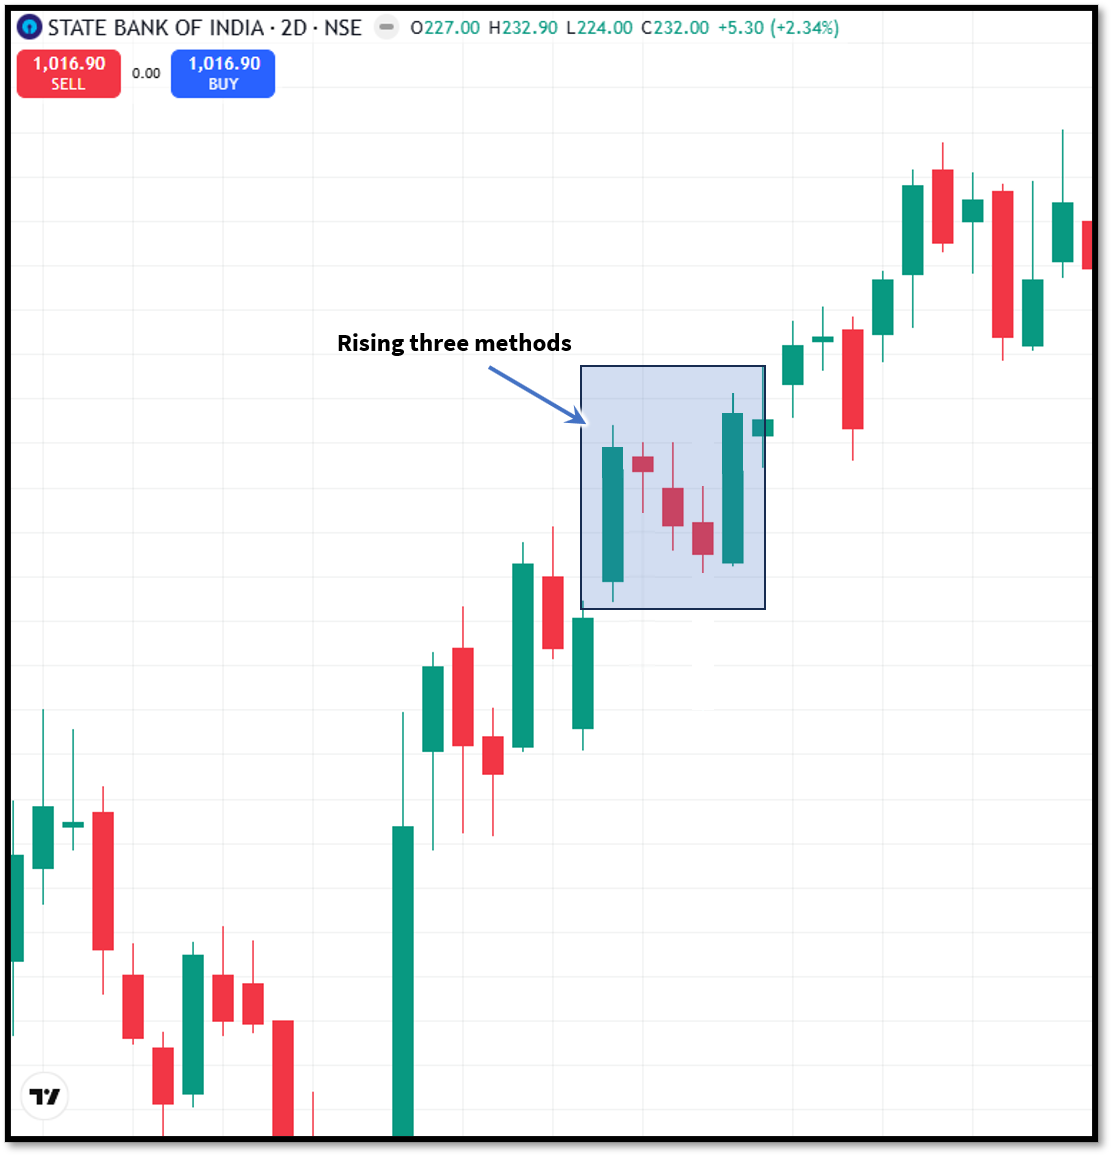
Rising Three Methods
The Rising Three Methods is a bullish continuation pattern. It starts with a strong bullish candle followed by several small bearish candles that remain within the range of the first candle.
The final candle is another strong bullish candle that closes above the first candle's high. The pattern indicates a temporary pause before the uptrend resumes.
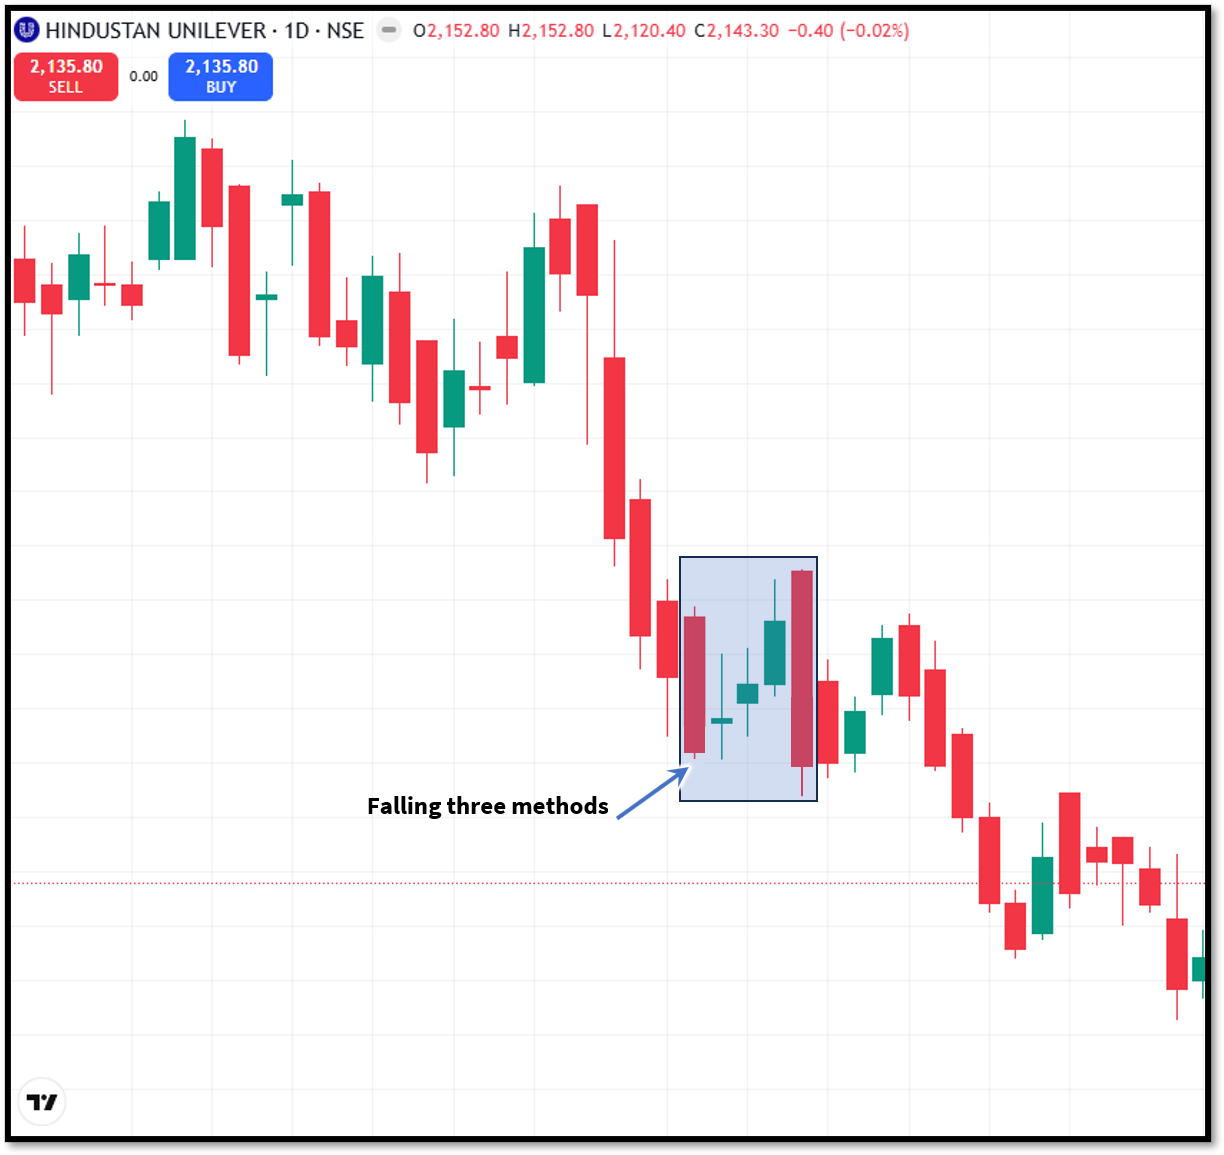
Falling Three Methods
The Falling Three Methods is the bearish counterpart of the Rising Three Methods. The pattern begins with a large bearish candle followed by several small bullish candles that remain within its range. The final bearish candle breaks below the first candle's low, suggesting the downtrend is continuing.
To wrap up
Multiple candlestick patterns give a broader view of market behaviour by examining price action over several trading sessions. These patterns are usually considered more reliable than the single candlestick pattern. Traders use them to identify possible reversals and trend continuation.
As a trader, you must understand these patterns as they help you identify possible reversals and trend continuation, which can result in rewarding opportunities.
FAQs
What are multiple candlestick patterns?
Multiple candlestick patterns are chart formations composed of two or more consecutive candlesticks, which traders can use to analyse changes in market sentiment and price direction.
Which are the most common bullish multiple candlestick patterns?
Some of the most common bullish patterns include the Bullish Engulfing, Morning Star, Piercing Line, Three White Soldiers, and Tweezer Bottom.
What are continuation candlestick patterns?
Continuation patterns suggest that the existing trend is likely to resume after a temporary pause rather than reverse. Rising Three Methods and Falling Three Methods are common examples.
Can multiple candlestick patterns be used in all financial markets?
Yes. These patterns are widely used in stocks, forex, commodities, indices, and cryptocurrencies because they are based on price action.
Which timeframe is best for multiple candlestick patterns?
Multiple candlestick patterns can appear on any timeframe. However, many traders consider signals on higher timeframes, such as daily and weekly charts, to be more reliable.







