Most Successful Chart Patterns








Key takeaways
- Chart patterns help traders identify potential trend continuations and reversals by analysing recurring price formations on a chart.
- Combining chart patterns with volume, support and resistance, and risk management can improve the effectiveness of the pattern.
- Understanding the strengths and limitations of different chart patterns enables traders to choose the right setup for different market conditions.
Price charts always show more than the up and down moves of the price. Every rise, fall, and period of consolidation reflects the ongoing battle between buyers and sellers. While price movements may seem random at first, markets usually create recurring formations that traders have studied for decades. These formations, known as chart patterns, can offer valuable clues about the likely direction of future price movements.
Chart patterns are among the most widely used tools in technical analysis because they simplify market behaviour into recognisable structures. Rather than predicting the future with certainty, they help traders estimate the probability of a trend continuing or reversing based on historical price action.
Although the appearance of a pattern does not guarantee the expected results, as it can be influenced by market conditions, trading volume, and broader trends. Hence, experienced traders use them in combination with technical indicators and proper risk management.
What are Chart Patterns?
Chart patterns are recurring price formations created by the movement of an asset over time. They develop because market participants often react similarly to changing prices, resulting in repeated buying and selling behaviour.
Most chart patterns fall into two broad categories:
- Continuation patterns - Suggest the existing trend is likely to continue after a temporary pause.
- Reversal patterns - Indicate that the current trend may be losing momentum and could change direction.
Most Successful Chart Patterns
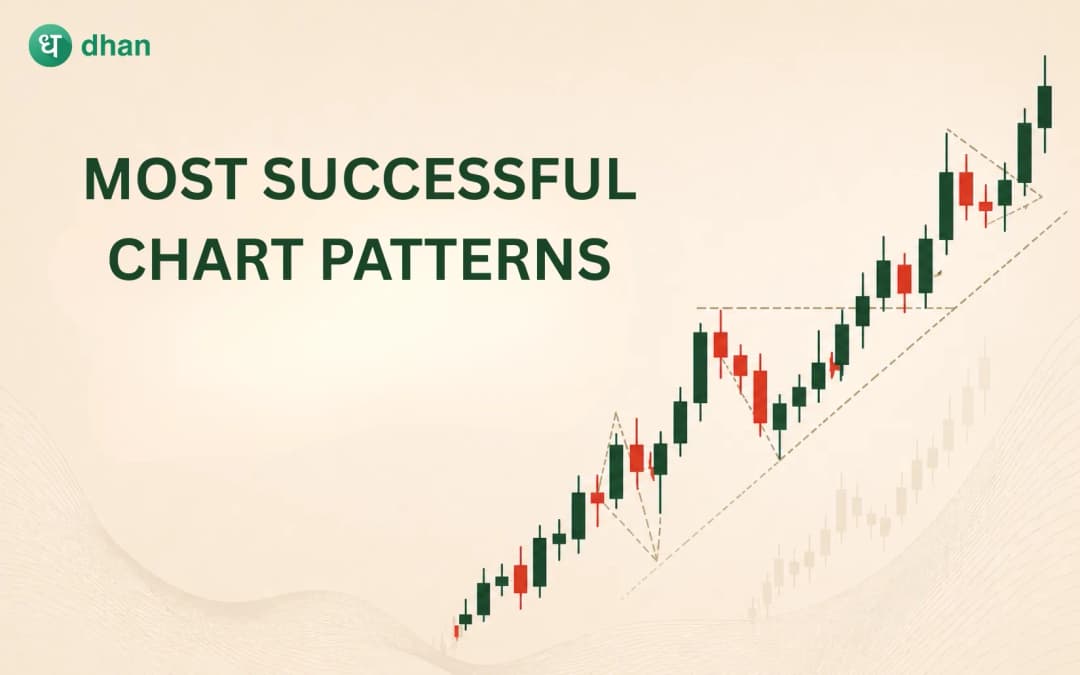
There are many patterns that traders have identified over the years. Some of which are more effective than the others. The following chart patterns are the most successful of them.
Head and shoulders
The Head and Shoulders is one of the most recognised bearish reversal patterns in technical analysis. It usually appears after a sustained uptrend and signals that buyers may be losing control.
The pattern consists of three peaks. The middle peak, known as the head, is higher than the two surrounding peaks, called the shoulders. A support line connecting the lows between the peaks forms the neckline.
A bearish signal is confirmed when the price closes below the neckline. Many traders then look for short-selling opportunities or consider exiting existing long positions.
Double top and double bottom
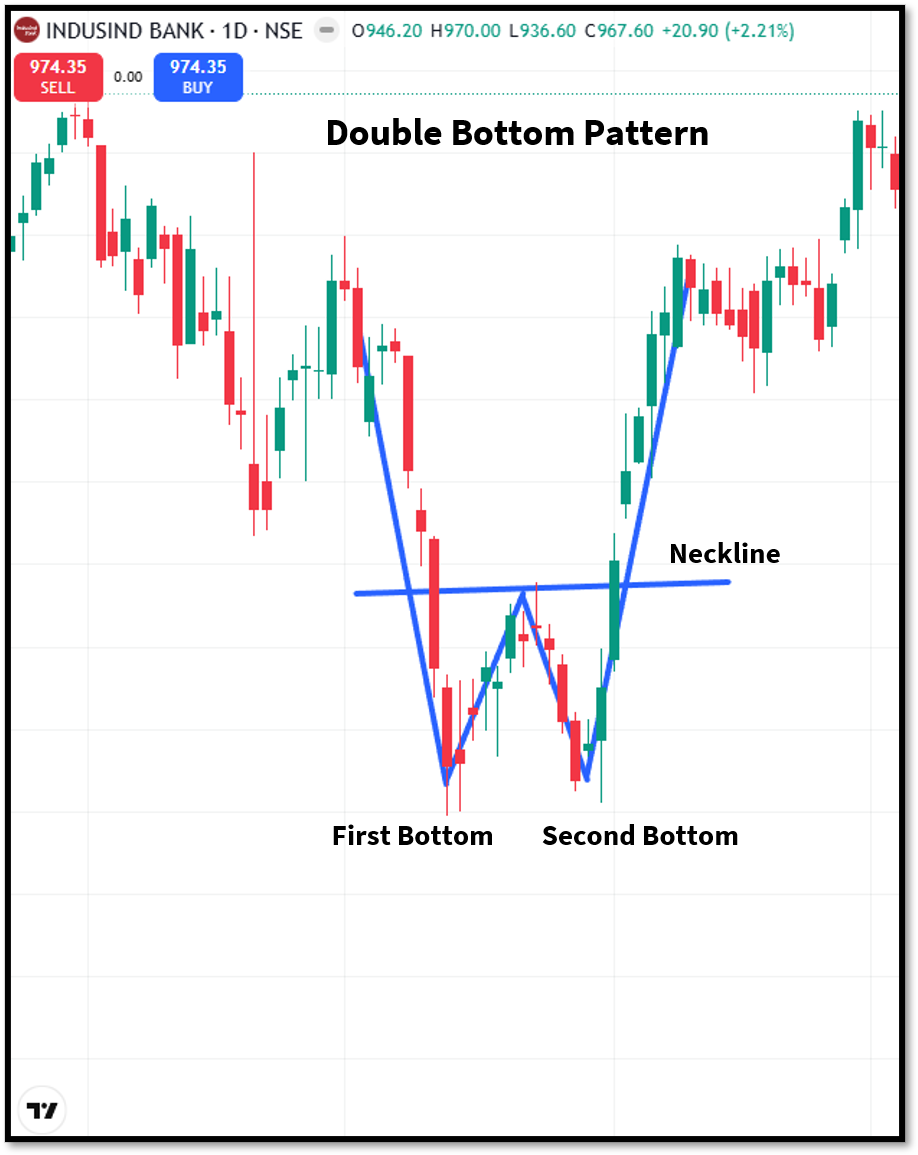
Double Top and Double Bottom are classic reversal patterns that frequently appear in trending markets.
A Double Top forms after an uptrend when the price reaches approximately the same resistance level twice but fails to move higher. This suggests buyers are struggling to maintain upward momentum, increasing the possibility of a downward reversal.
A Double Bottom develops after a downtrend. Here, the price tests the same support level twice before moving higher, indicating that selling pressure may be weakening.
Inverse head and shoulders
The Inverse Head and Shoulders is a bullish reversal pattern that typically forms after a prolonged downtrend. It signals that selling pressure is gradually weakening and buyers may soon take control, leading to the start of a new upward trend.
The pattern consists of three consecutive troughs. The middle trough, known as the head, is deeper than the two surrounding troughs, called the shoulders. A trendline connecting the highs between these troughs forms the neckline, which acts as the key resistance level.
Ascending triangle
The Ascending Triangle is generally considered a bullish continuation pattern.
It occurs when price tests a horizontal level of resistance more than once and makes higher lows. The buyers are slowly becoming more aggressive, even though sellers continue defending the same resistance area.
Eventually, buying pressure may become strong enough to push the price above resistance, confirming the breakout.
Many traders use the height of the triangle to estimate a potential price target after the breakout.
Descending triangle
The Descending Triangle is the bearish counterpart of the Ascending Triangle. It has a horizontal support level and a series of lower highs. This structure suggests that sellers are becoming increasingly dominant while buyers continue defending the same support level.
Once the price breaks below support, selling pressure often increases, creating opportunities for bearish trades.
Bullish and bearish rectangle
Rectangle patterns represent periods of market consolidation where prices move sideways between clearly defined support and resistance levels.
A Bullish Rectangle forms during an uptrend. After a temporary pause, buyers regain control and push the price above resistance, allowing the original trend to continue.
A Bearish Rectangle develops during a downtrend. The market consolidates briefly before sellers resume control by breaking below support.
Since rectangles indicate temporary equilibrium between buyers and sellers, traders usually wait for the breakout before taking a position.
Cup and handle
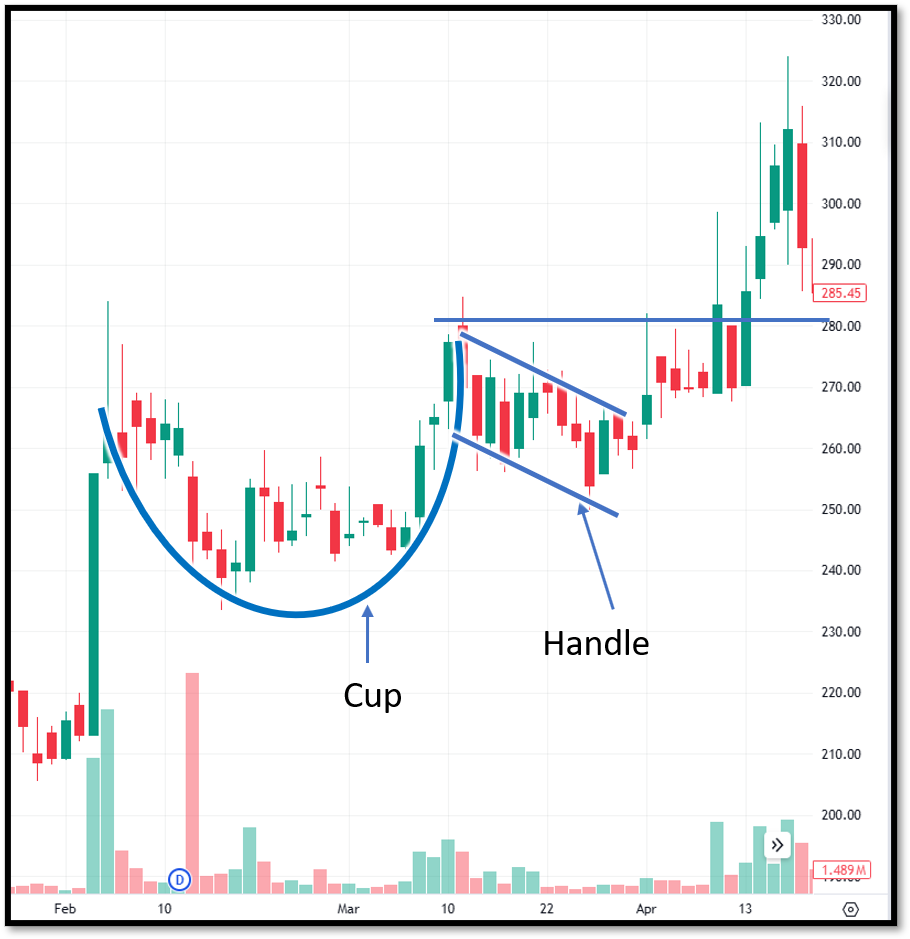
The Cup and Handle is a bullish continuation pattern. It forms in the shape of a teacup. The cup forms as prices gradually decline and recover, creating a rounded bottom. This is followed by a smaller pullback known as the handle.
Once the price breaks above the handle's resistance, buyers often regain momentum, signalling the continuation of the existing uptrend.
Flag pattern
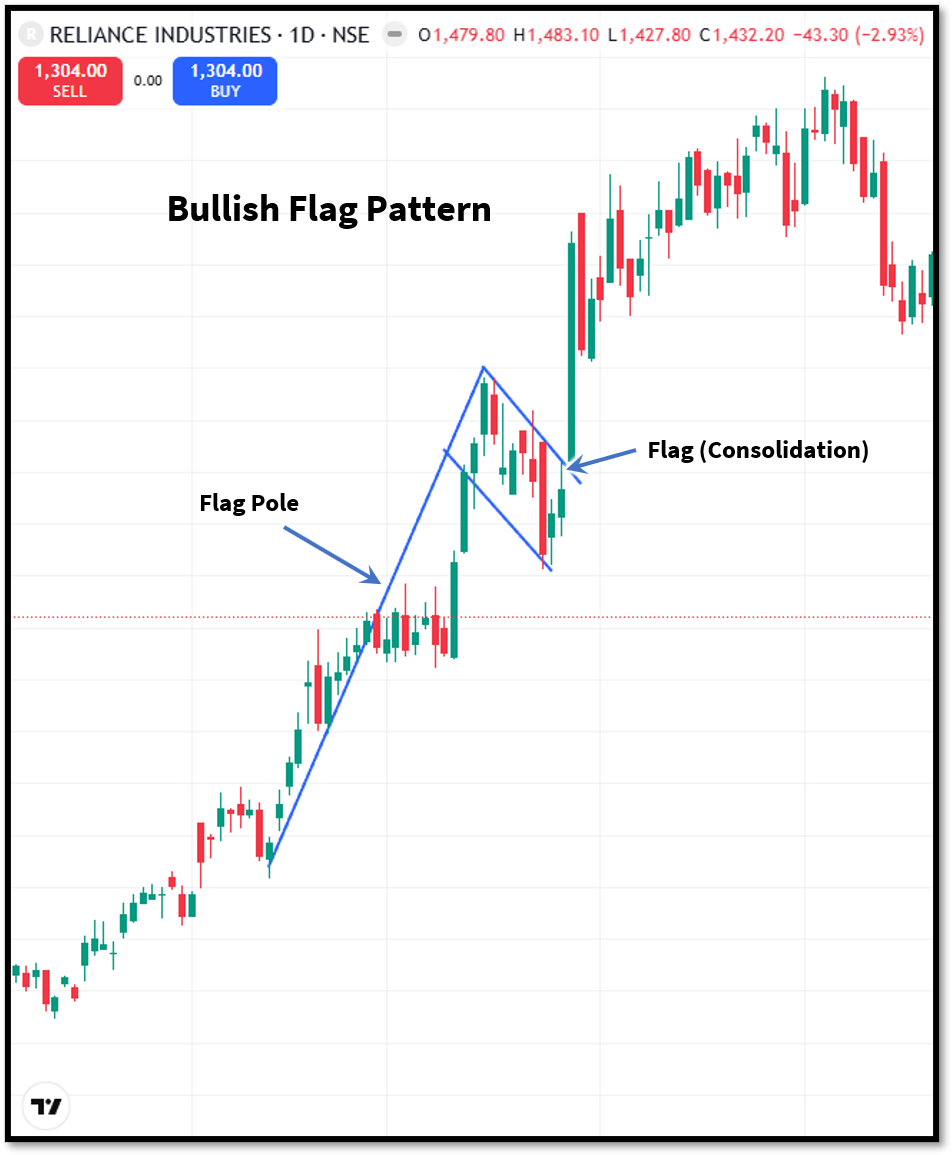
The Flag pattern is a continuation pattern that forms after a strong directional price move, known as the flagpole. Following this sharp movement, the market enters a brief consolidation phase where prices move within two parallel trendlines, creating the flag.
A Bullish Flag is a pattern that develops after an upward move. It indicates buyers are temporarily exiting the market. A Bearish Flag forms after a sharp decline and signals a short consolidation before the downtrend may continue.
Pennant pattern
The Pennant pattern is another continuation pattern that often appears after a significant price movement. Unlike a Flag pattern, the consolidation phase forms a small symmetrical triangle instead of parallel trendlines.
During this period, buying and selling pressure gradually balance out, resulting in narrowing price movements. As the pattern approaches its apex, volatility decreases until a breakout occurs.
The direction of the breakout usually follows the direction of the previous trend, making the Pennant a popular pattern among momentum traders.
To wrap up
Chart patterns are one of the most widely used tools in technical analysis as they provide a structured way to interpret price action and market sentiment. There are two types of chart patterns: reversal patterns and continuation patterns. Reversal patterns are patterns that suggest a possible reversal, while continuation patterns suggest that the trend may continue further. There are various chart patterns that are observed by traders, but some of them are most effective.
But traders should know that there is no single "most successful" chart pattern that works in every market condition. As with any pattern, its effectiveness depends on the prevailing trend, volume, confirmation signals and overall market environment.
FAQs
Can chart patterns be used for intraday trading?
Yes. Chart patterns can be applied to intraday, swing, and positional trading. But shorter timeframes tend to generate more false signals.
Are chart patterns suitable for beginners?
Yes. Beginners can start with easy patterns like Double Top, Double Bottom, Triangles, and Rectangles before progressing to more advanced harmonic patterns.
Why do chart patterns sometimes fail?
Chart patterns can fail due to false breakouts, low trading volume, unexpected news events, or sudden changes in market sentiment.
Which chart pattern has the highest success rate?
There is no chart pattern with a guaranteed or universally highest success rate. The reliability of a pattern depends on factors such as market conditions, confirmation signals, and trading volume.
What is the difference between continuation and reversal chart patterns?
Continuation patterns indicate that the existing trend is likely to continue after a temporary consolidation, while reversal patterns signal that the current trend may reverse soon.