



Top 20 Trading Indicators in 2026








Indicators help traders to interpret the price behaviour, analyse momentum, and volatility shifts. Indicators act as a decision support tool and not a decision maker. This article covers the top 20 trading indicators in 2026 that traders still rely on across intraday, swing, and positional trading.
How to choose the right trading indicators
Before learning about the indicators, you must note that no indicator works alone. Indicators should be used in combination to get confirmation from different perspectives. The effectiveness of the indicators also depends on your trading style (intraday, swing or long-term), market conditions and timeframes.
Indicators can be grouped into trend, momentum, volatility, volume, and market-structure tools. Traders make a common mistake of using multiple indicators which are showing the same information, instead of using three to four indicators which can show different information and support each other for decision making.
Advanced trading platforms like Dhan provide these indicators free of cost for a better user experience.
Top 20 Trading Indicators
Here are the top 20 trading indicators based on different categories.
Moving Averages (SMA & EMA)
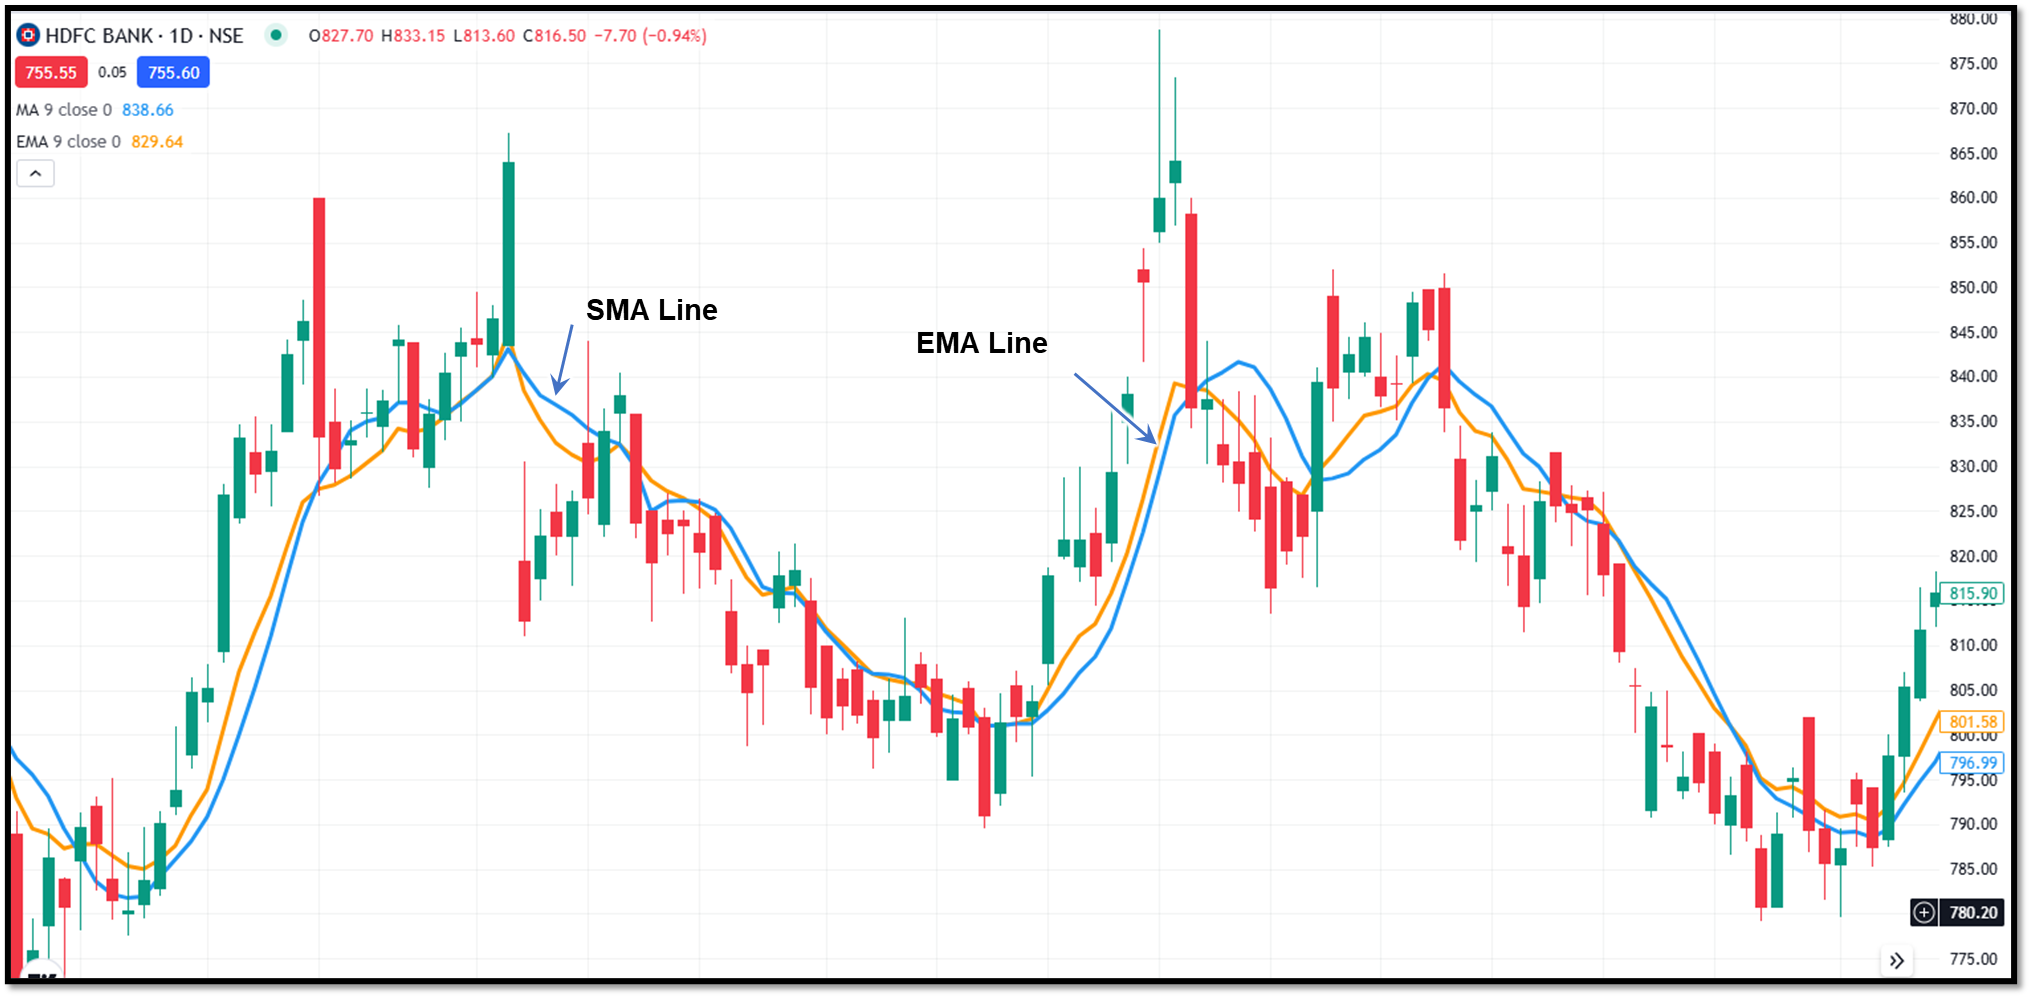
Moving averages are the most popular and widely used tools across the world. There are two types of moving averages: Exponential Moving Average (EMA) and Simple Moving Average (SMA). You can identify trend direction, dynamic support and resistance, and crossover signals using moving averages.
MACD (Moving Average Convergence Divergence)
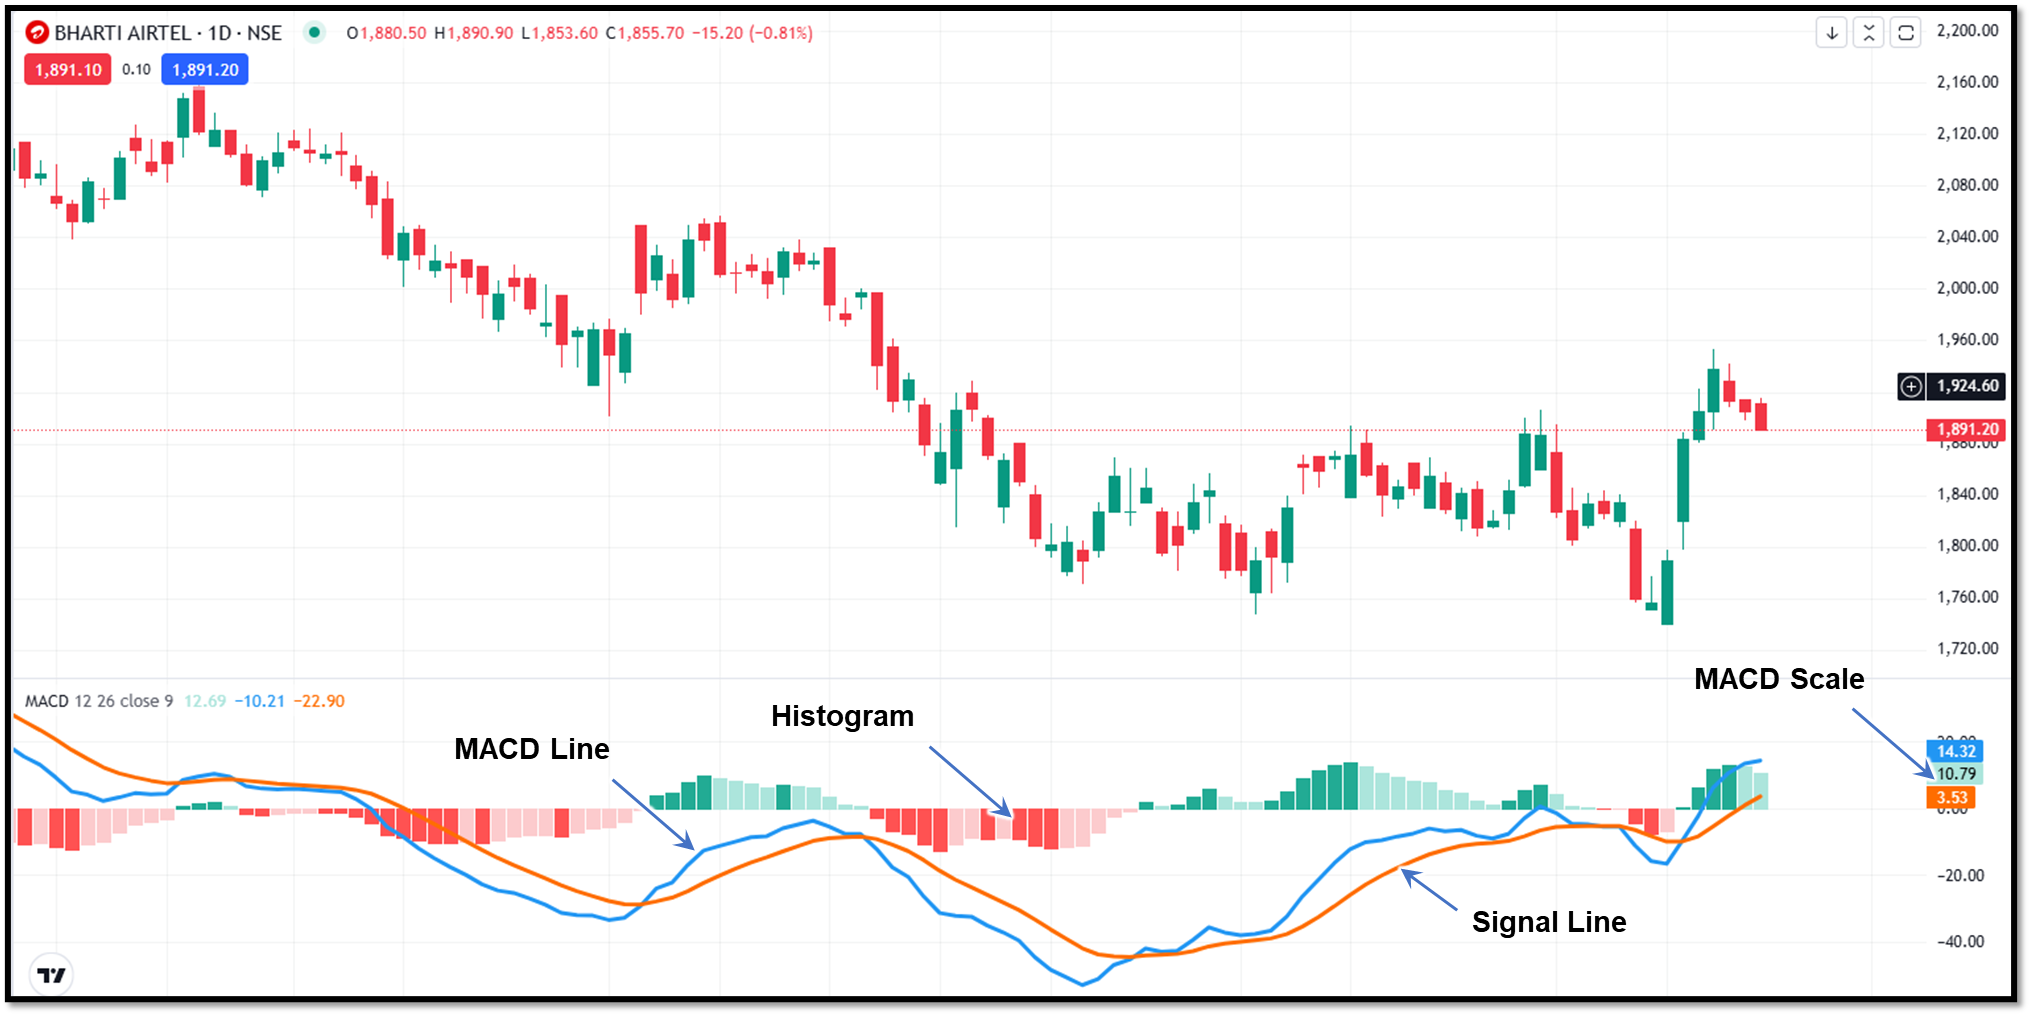
Moving Average Convergence Divergence or MACD uses two moving averages for trend and momentum identification. It will help you identify potential trend shifts, momentum strength, and reversals through crossovers and divergence.
Supertrend
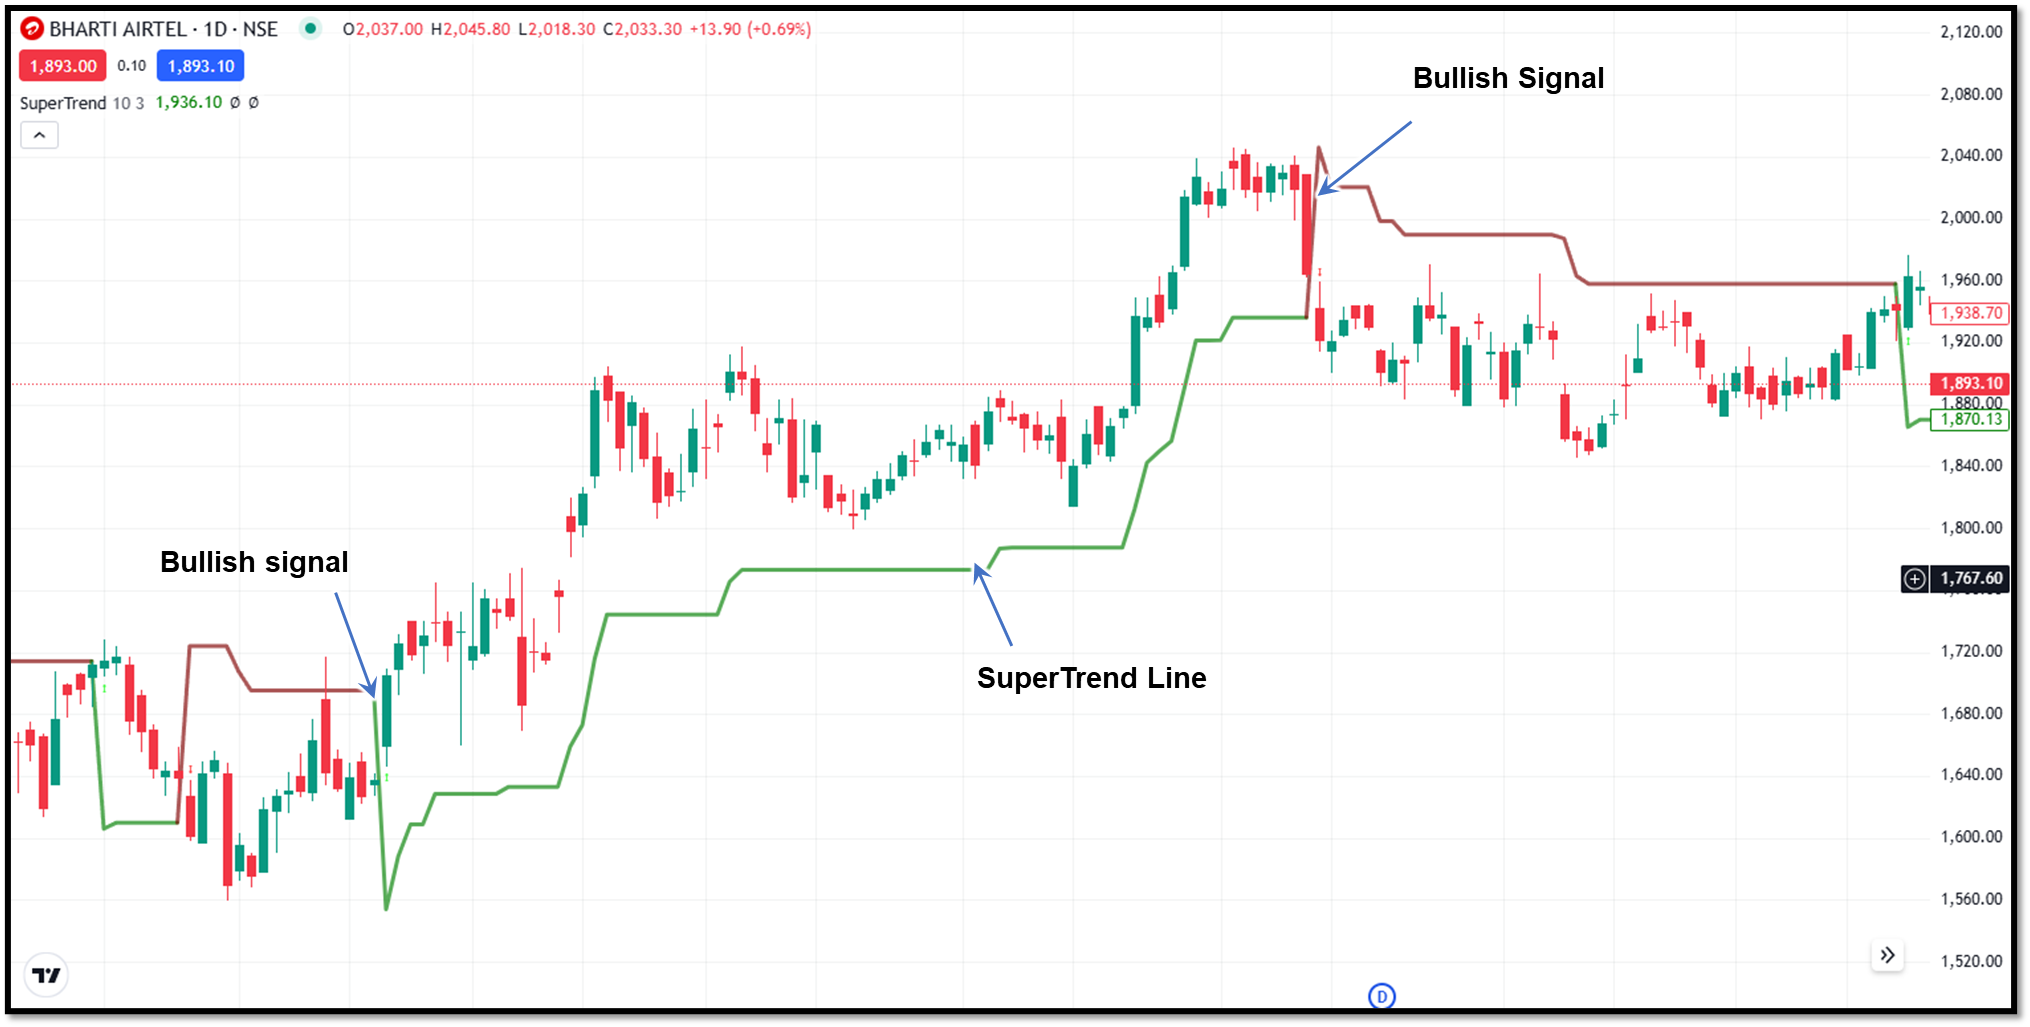
The supertrend indicator is popular among intraday traders. By using the price and volatility, Supertrend gives trend direction and trailing stop levels. Supertrend is useful in trend following systems.
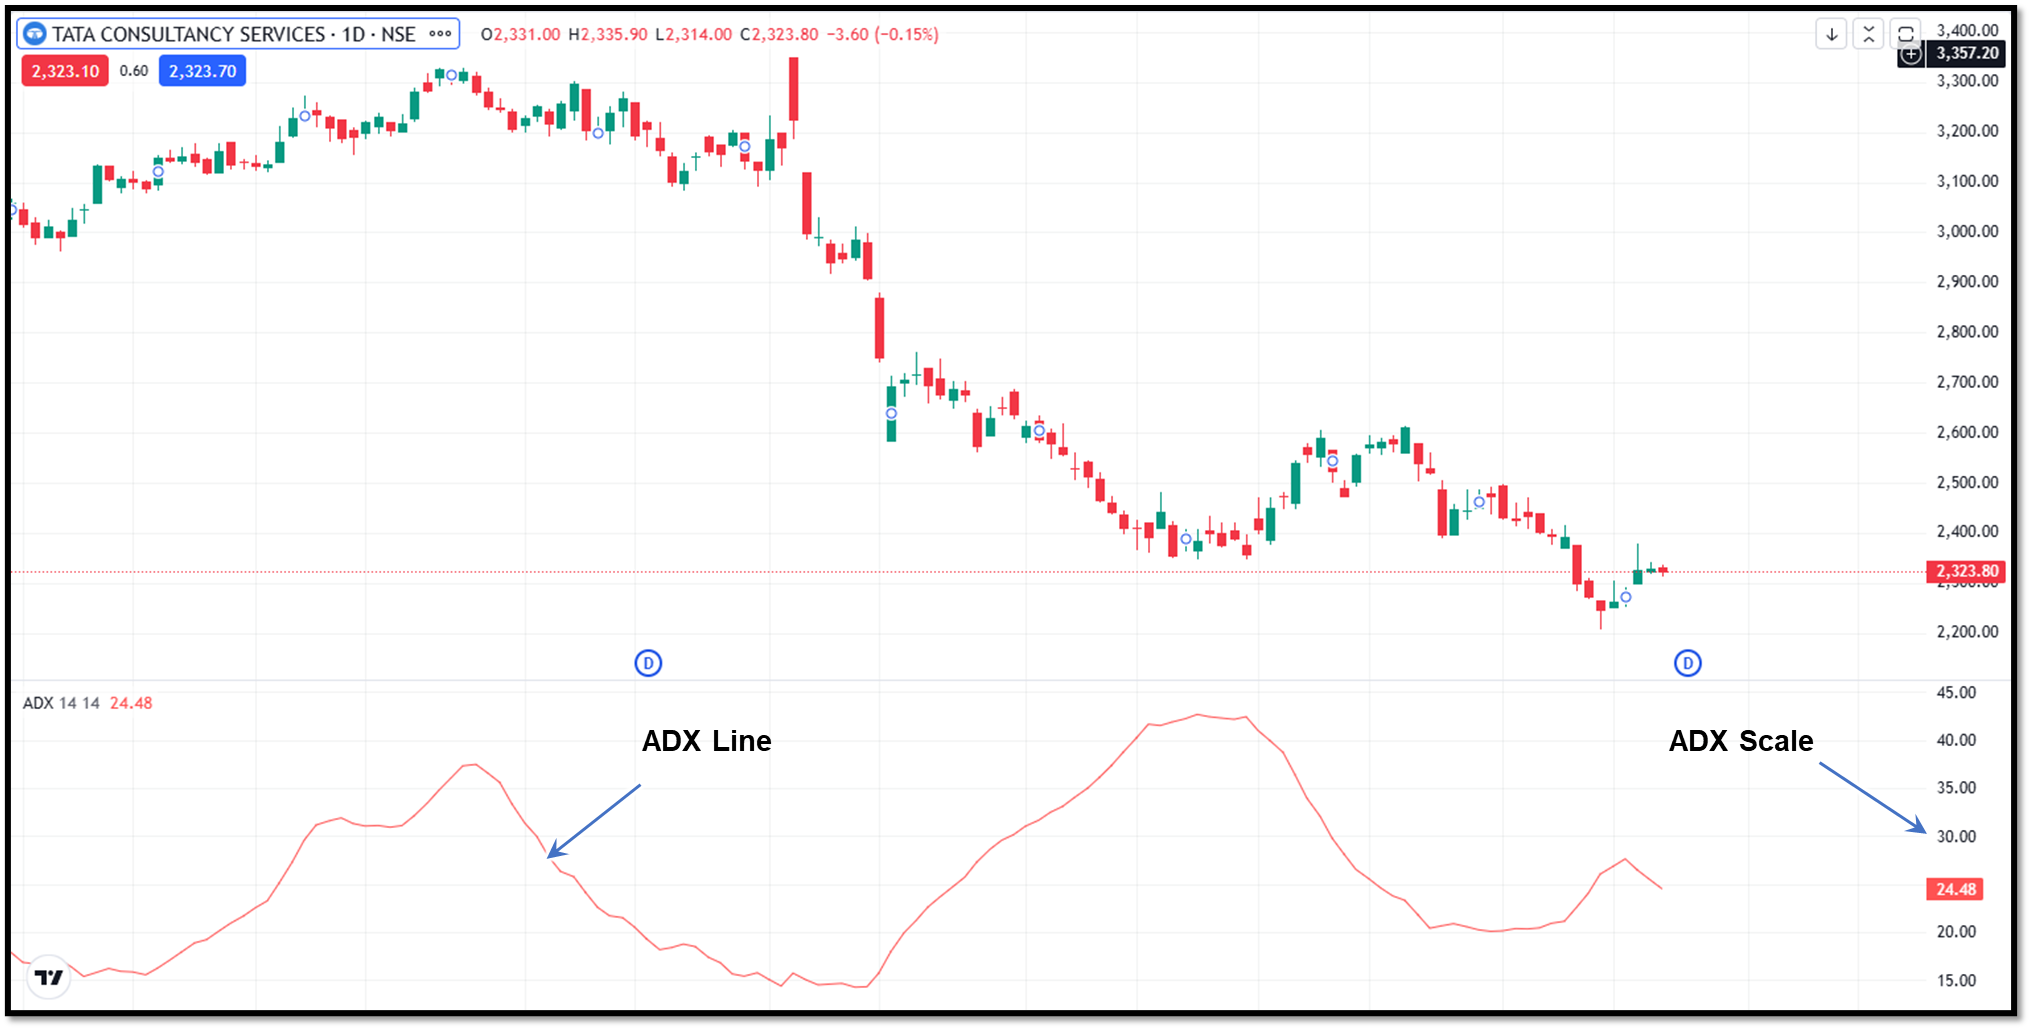
ADX (Average Directional Index)
When determining whether a trend is strong enough to trade, many traders consult ADX. A stronger trend is indicated by a higher ADX value (above 25, for example), whereas a weaker or sideways market is suggested by a lower value (below 20). It helps traders determine whether the market is range-bound or if trend-following tactics are appropriate.
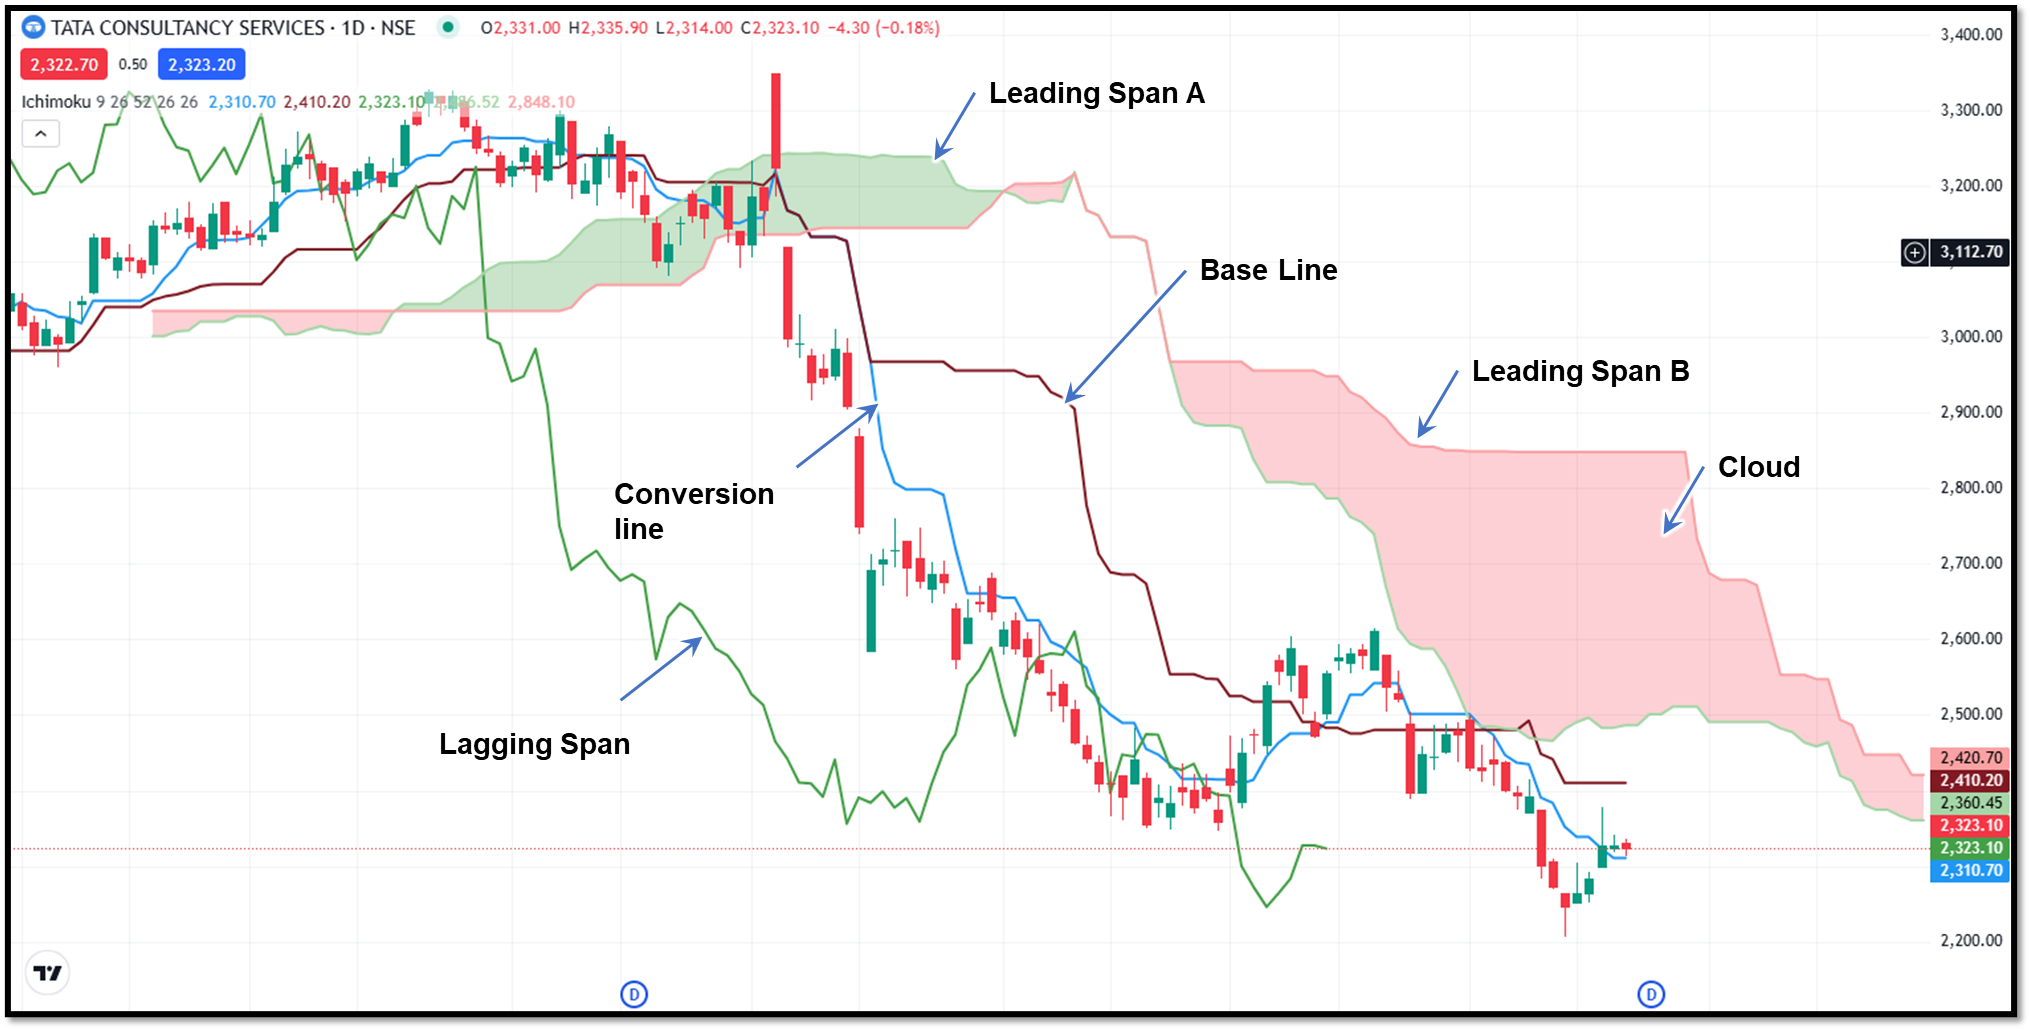
Ichimoku Cloud
Ichimoku provides a complete view of trend, momentum, and support–resistance. If you are a positional trader, then it will help you to assess the overall market structure rather than short-term signals.
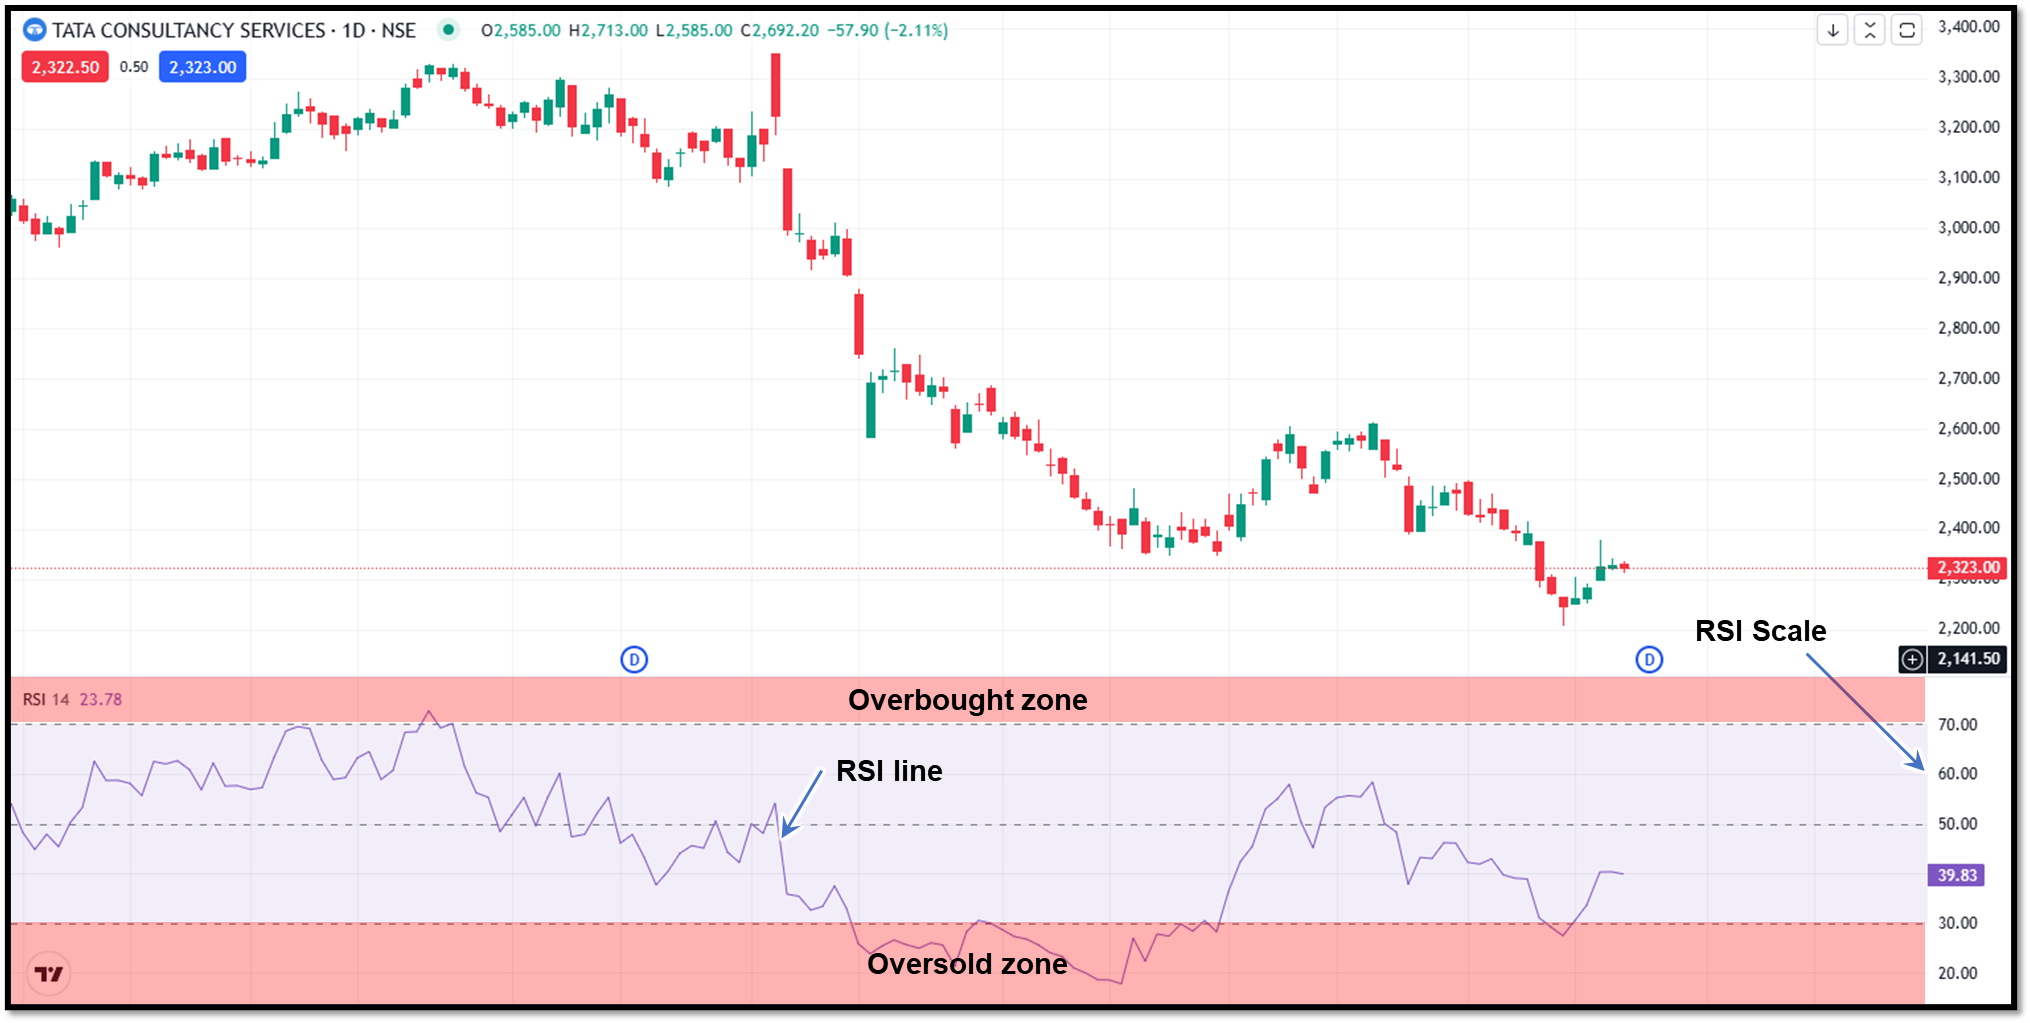
RSI (Relative Strength Index)
Relative Strength Index or RSI is a momentum indicator which measures price change to identify overbought and oversold conditions. It has a momentum oscillator, ranging from 0 to 100. When the oscillator line crosses above 70, the asset is considered overbought, and when it is below 30, the asset is considered oversold.
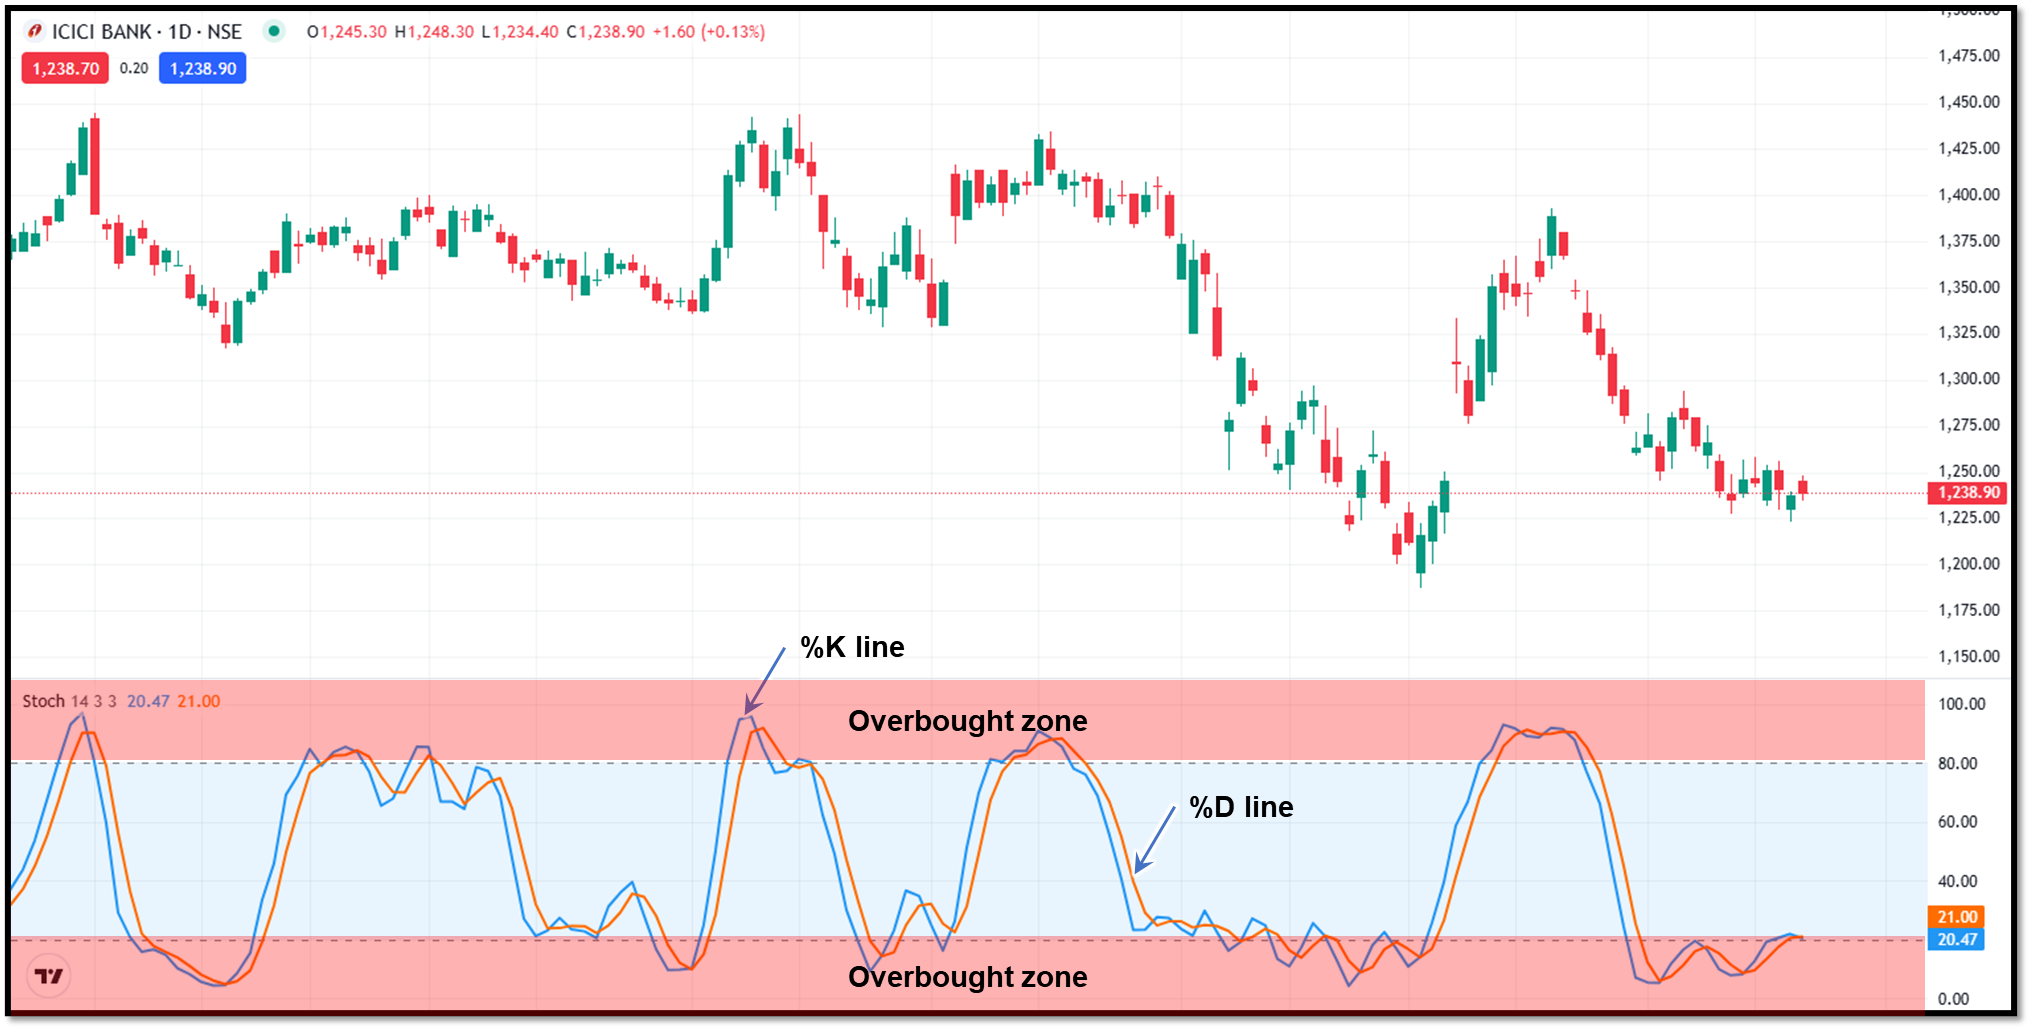
Stochastic Oscillator
A stochastic oscillator is used when the market is range-bound. You can use it for identifying short-term momentum shifts and possible reversals near support.
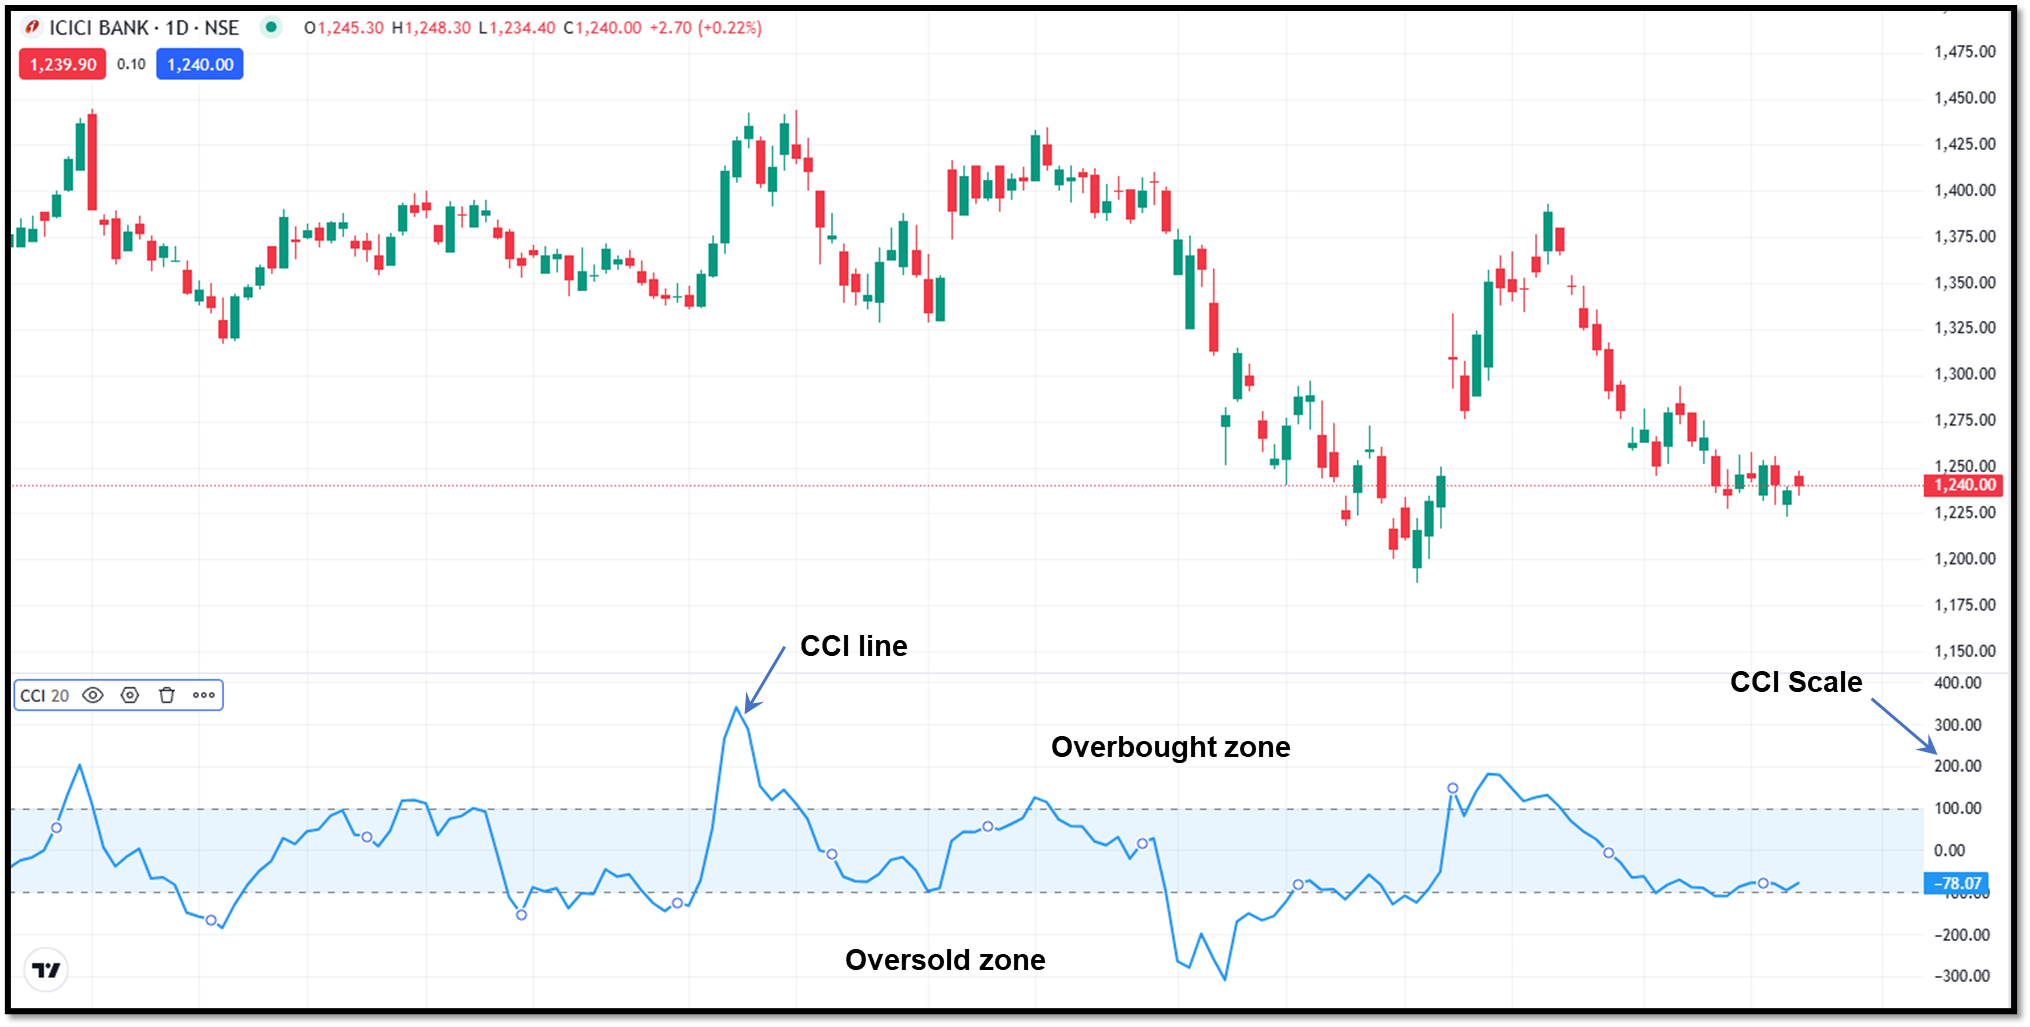
CCI (Commodity Channel Index)
It is a momentum oscillator which measures an asset's current price relative to its average price over a certain period. You can spot overbought/oversold conditions, trend strength, and potential reversals by using Commodity Channel Index.
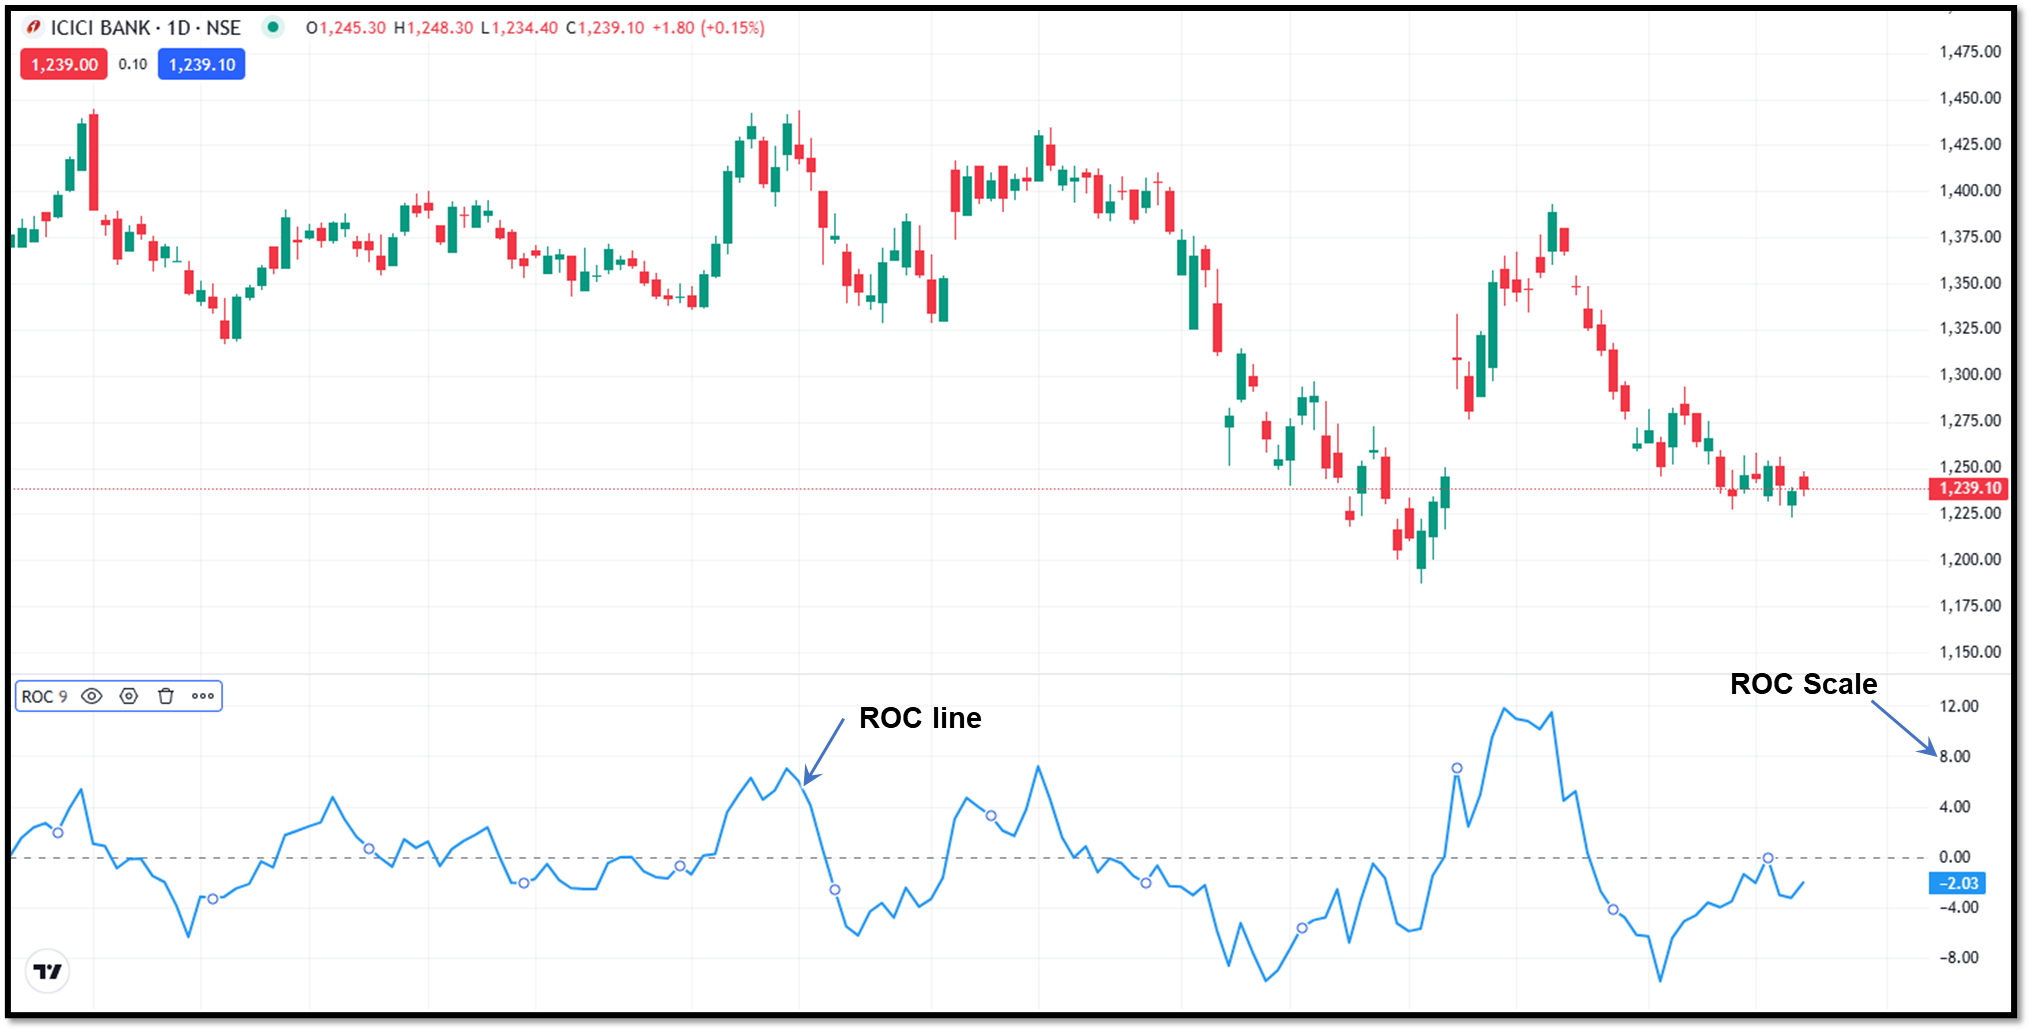
Rate of Change (ROC)
ROC gives the percentage change of an asset’s price over a certain time period. ROC gives price speed and trend strength.
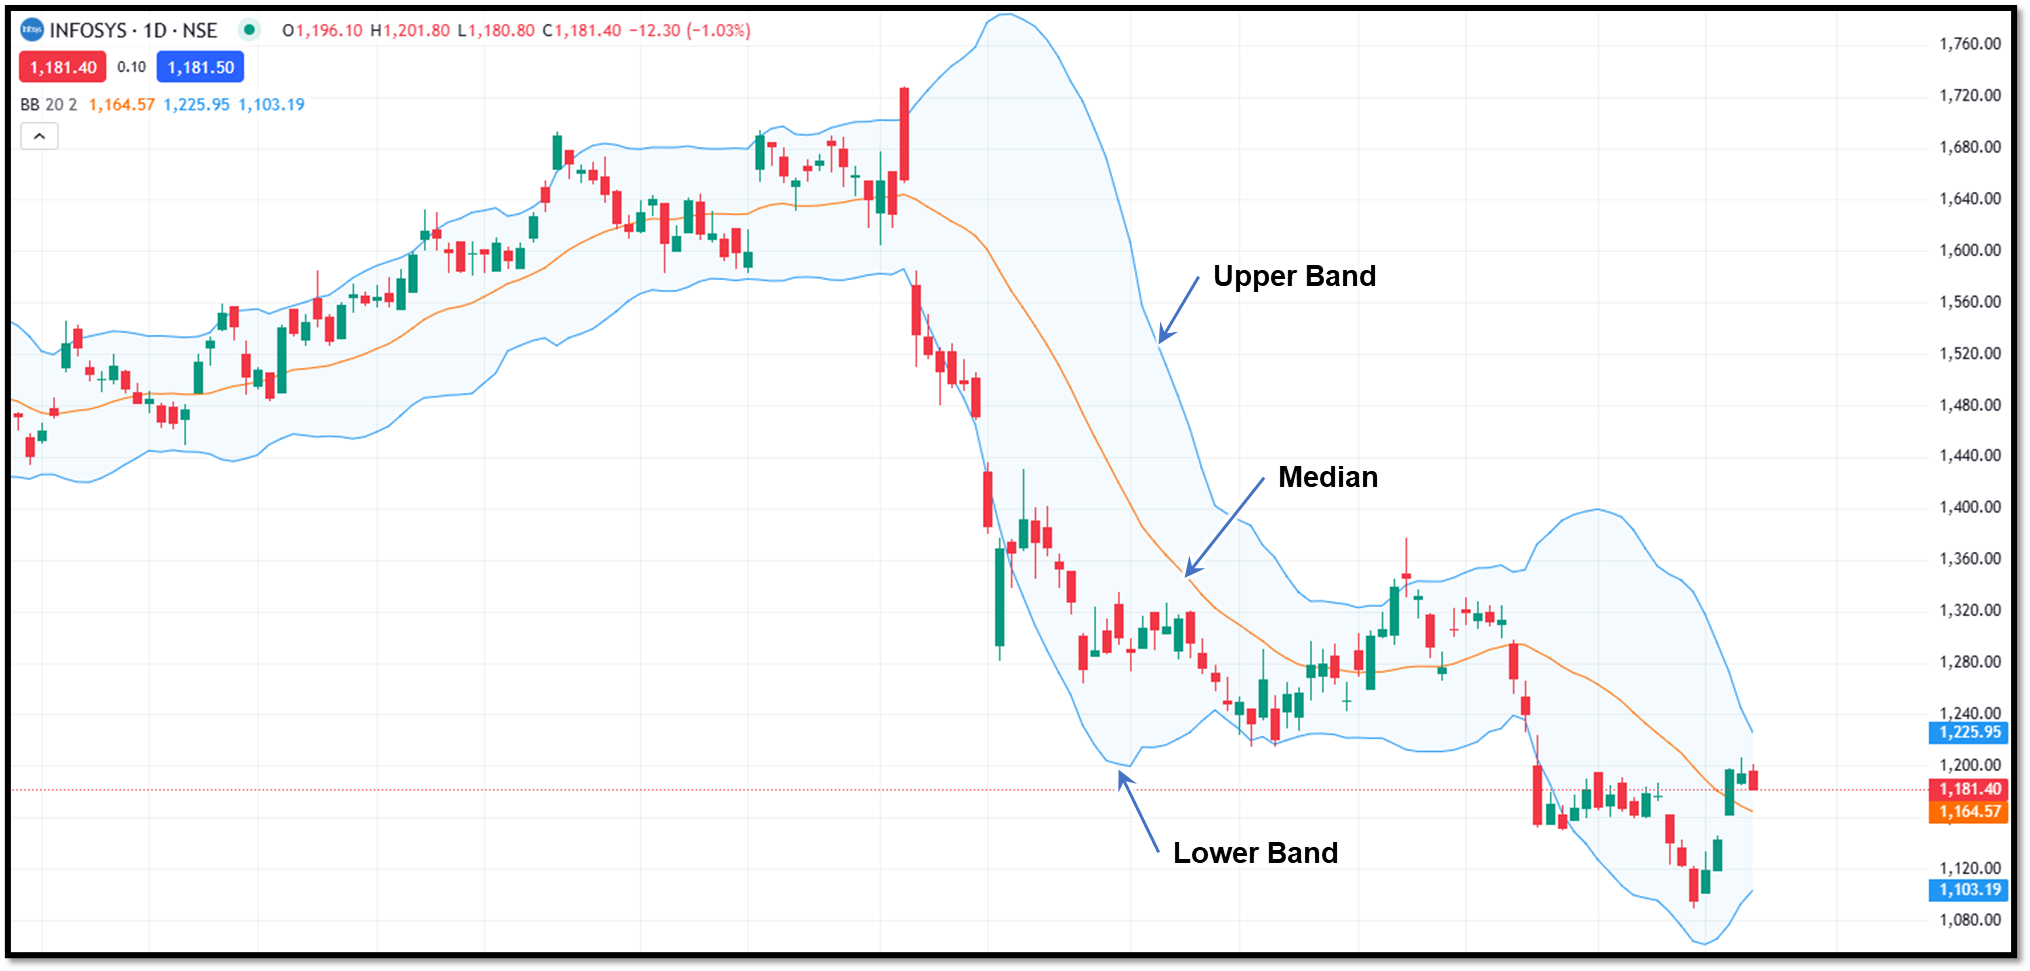
Bollinger Bands
Bollinger bands are very popular for volatility. Bollinger bands expand during high volatility and contract when there is low volatility. You can use them to identify squeezes and volatility breakouts.
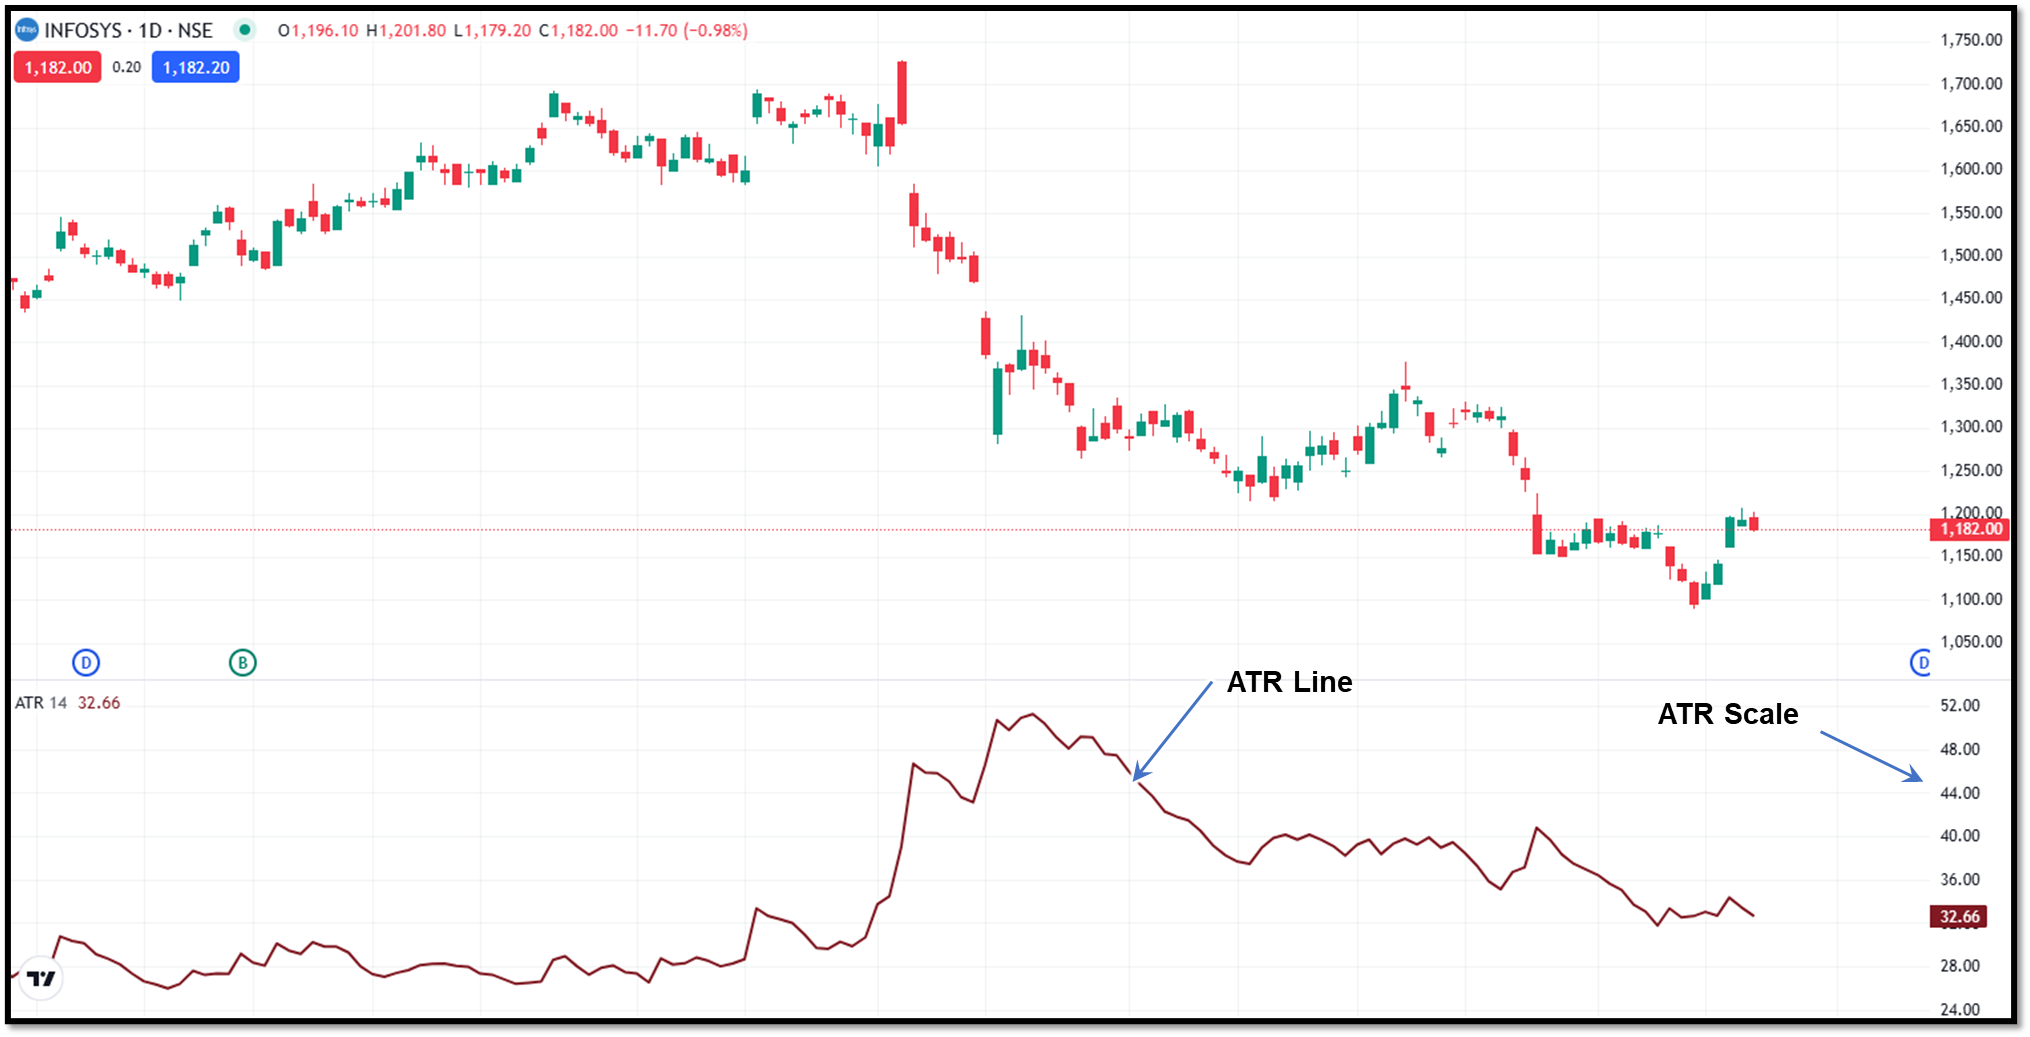
ATR (Average True Range)
ATR shows how much an asset's price typically moves over a specific period. A rising ATR signals increasing volatility, while a falling ATR indicates decreasing volatility, helping traders set stops and position sizes.
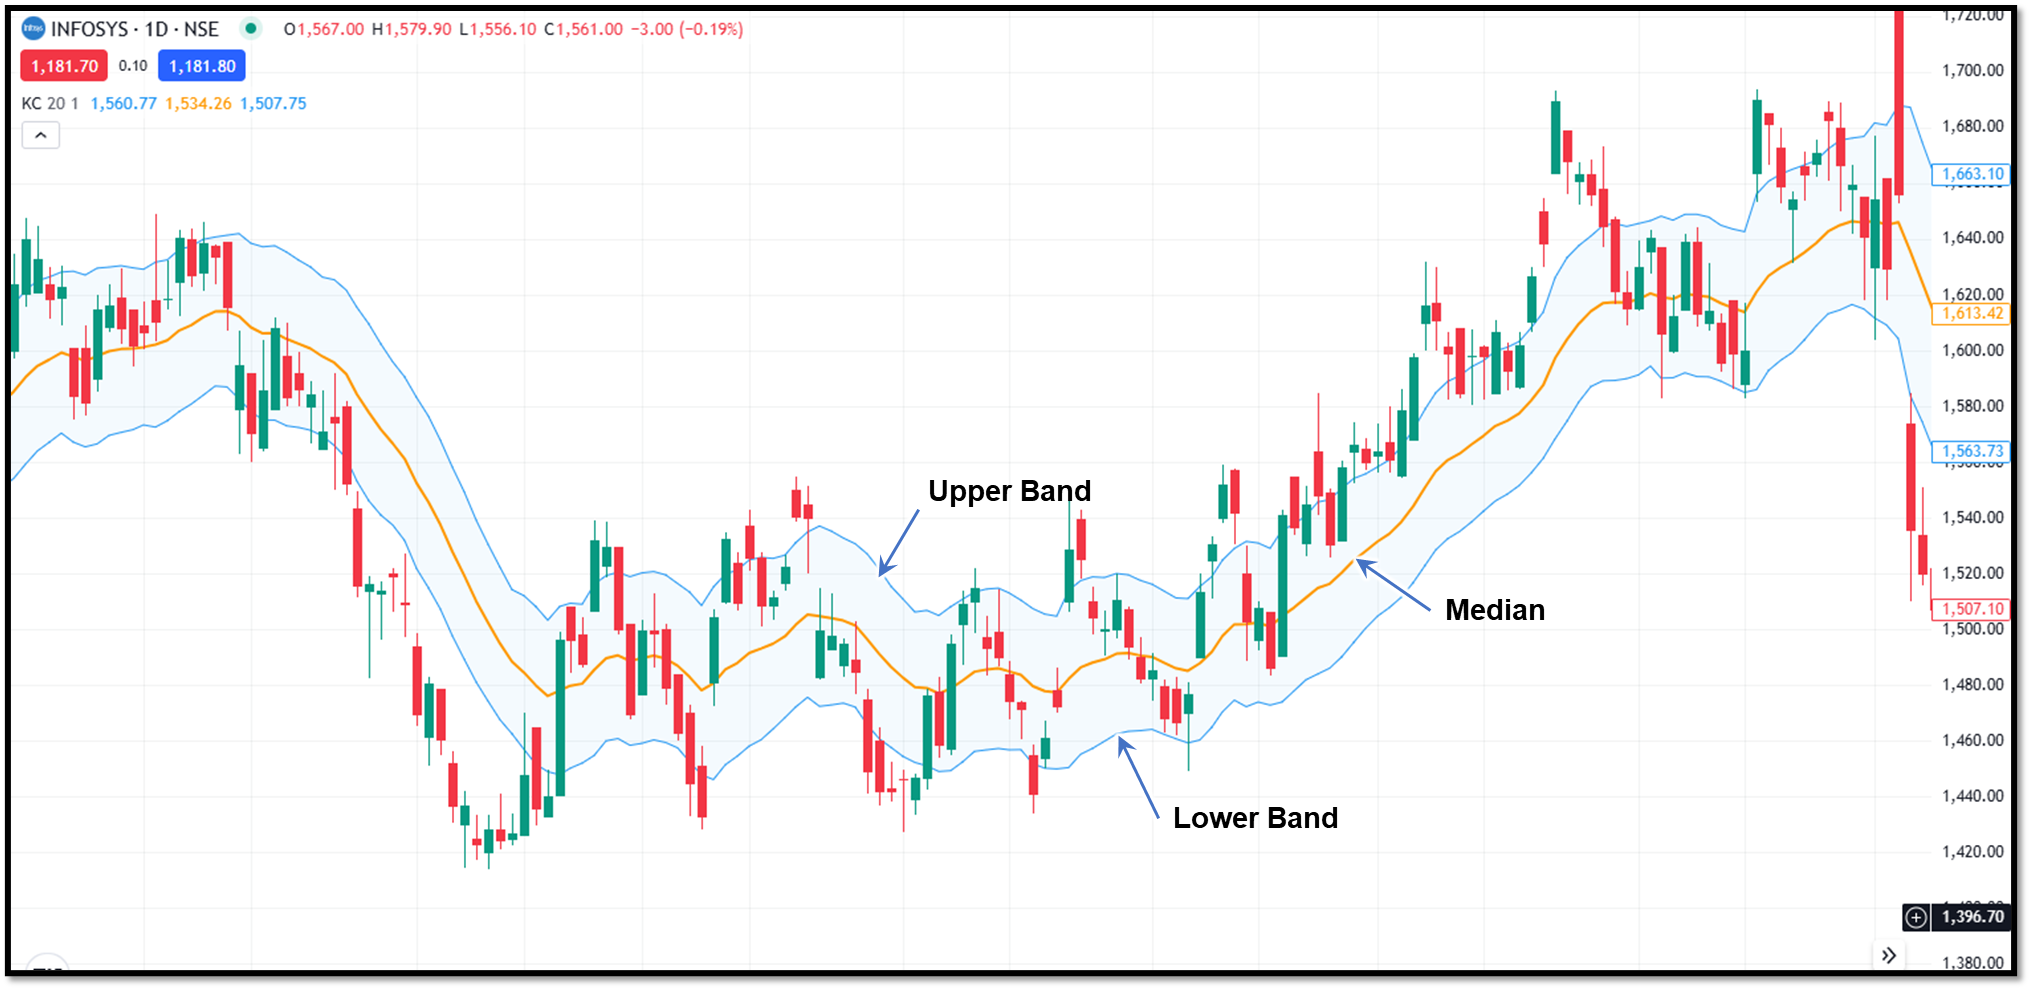
Keltner Channels
Similar to Bollinger bands, Keltner channels employ ATR as the standard deviation and Exponential Moving Average (EMA) as the middle line. It will assist you in identifying overbought/oversold conditions, trends, and reversals.
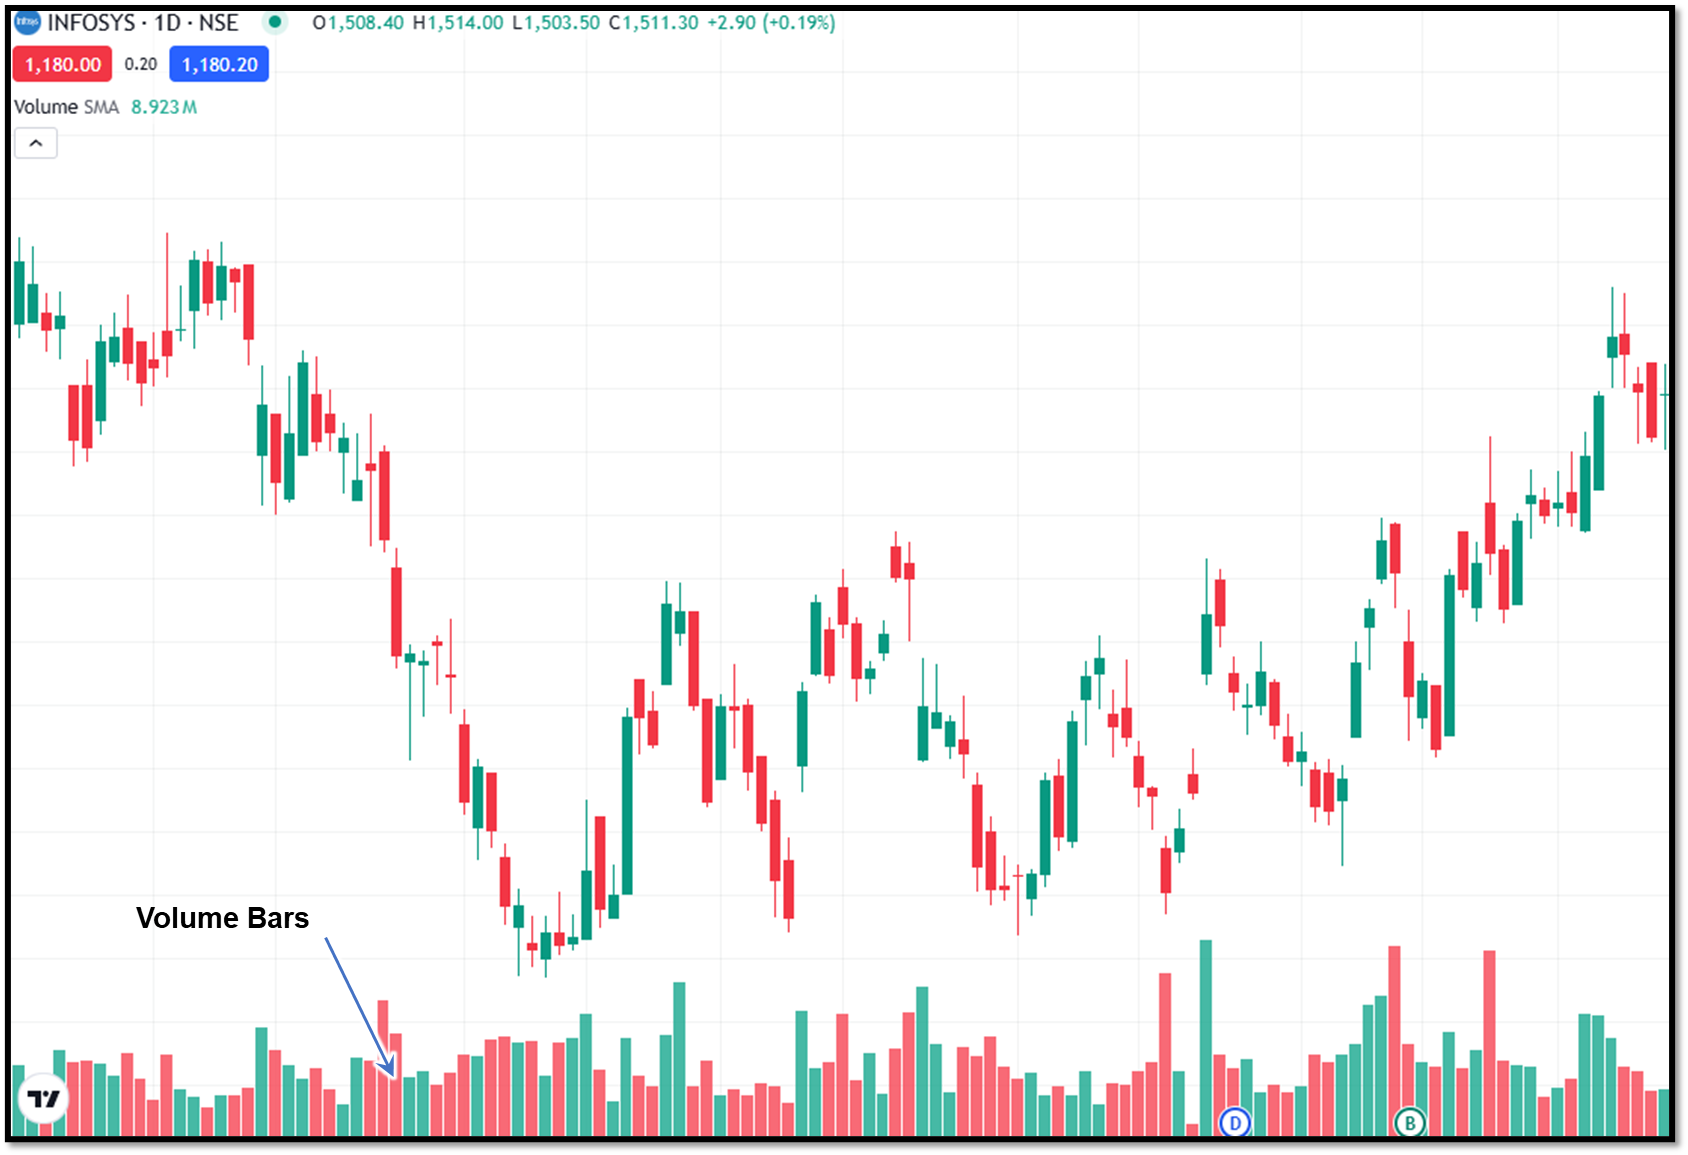
Volume
Volume indicator is shown on the chart by default on most trading platforms. Volume is a foundation of technical analysis. Price movements supported by strong volume carry more significance than low-volume moves.
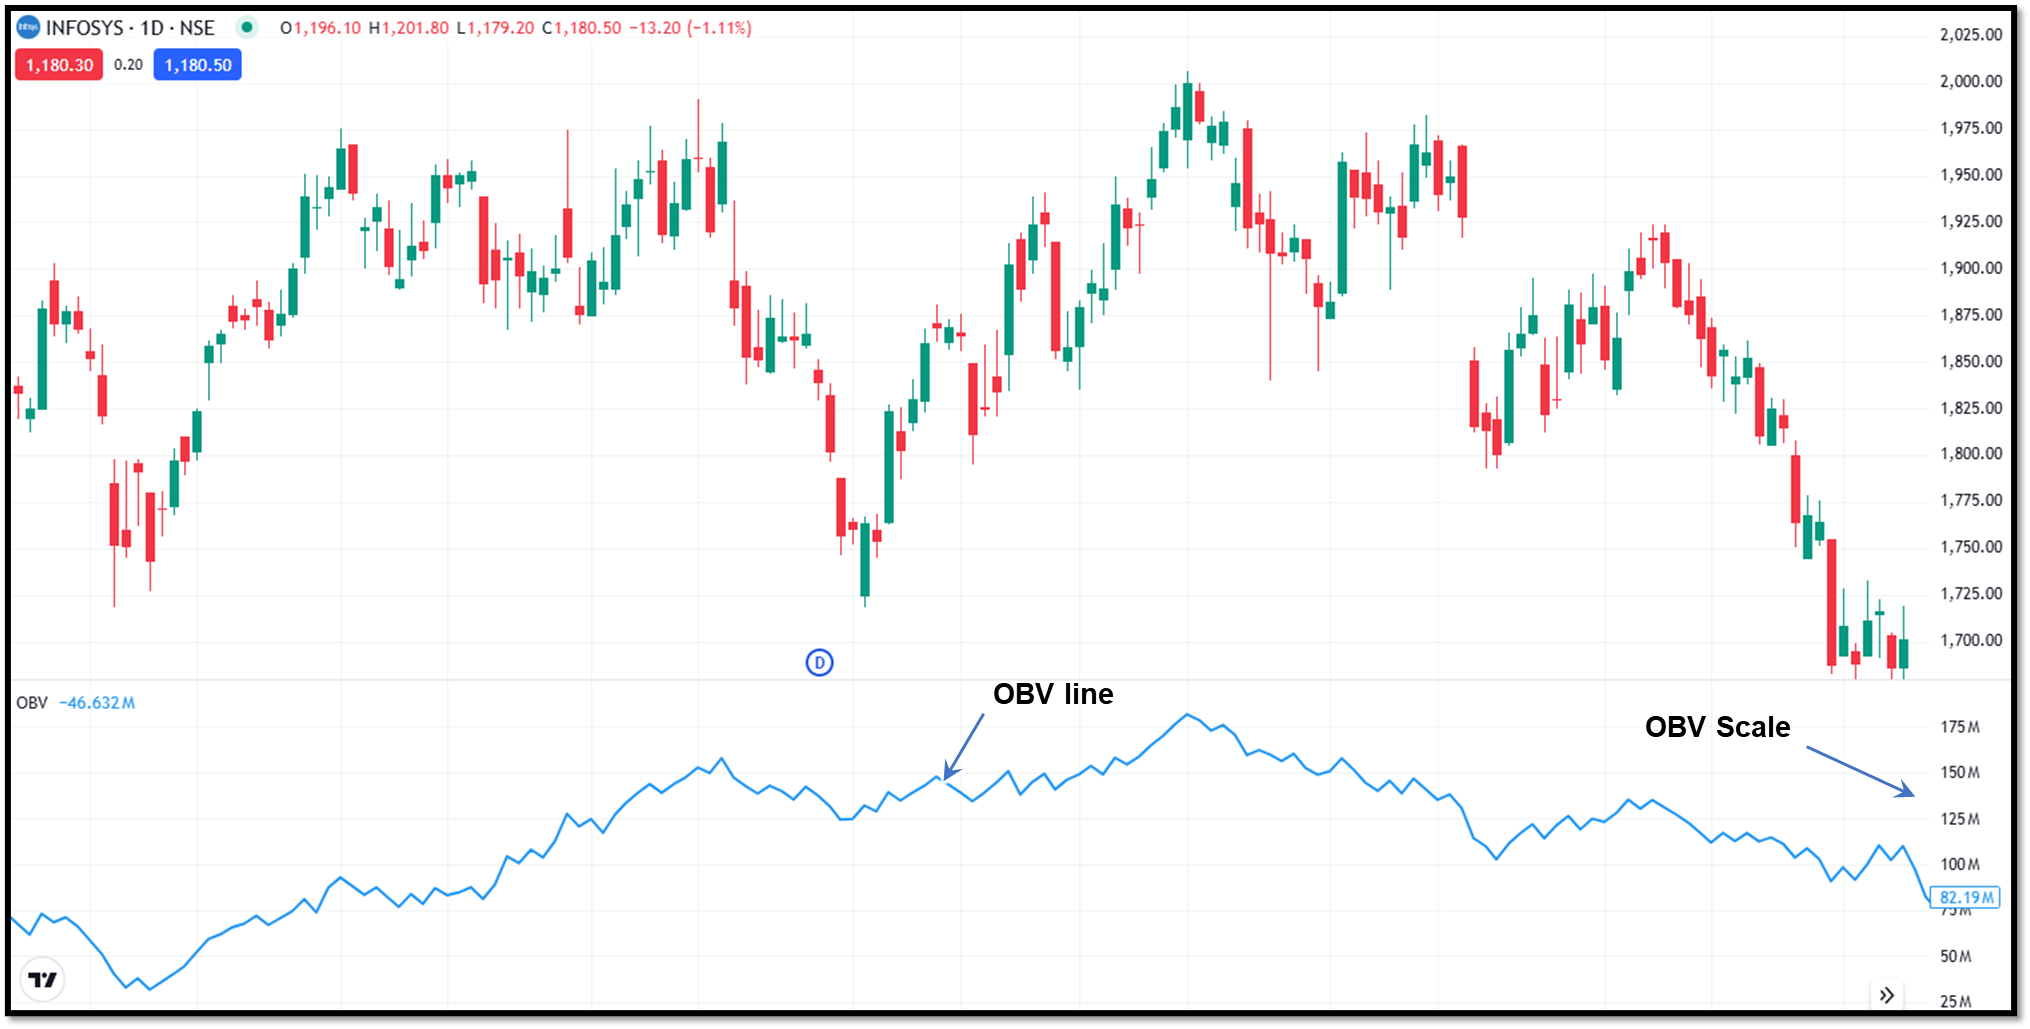
On-Balance Volume (OBV)
OBV subtracts volume on down-days and adds volume on up-days, and gives the signal accumulation or distribution. The accumulation (rising OBV) with rising price confirms an uptrend. The distribution (falling OBV) with falling price confirms a downtrend. While diversion, for example, price rising but OBV is falling, represents weakness.
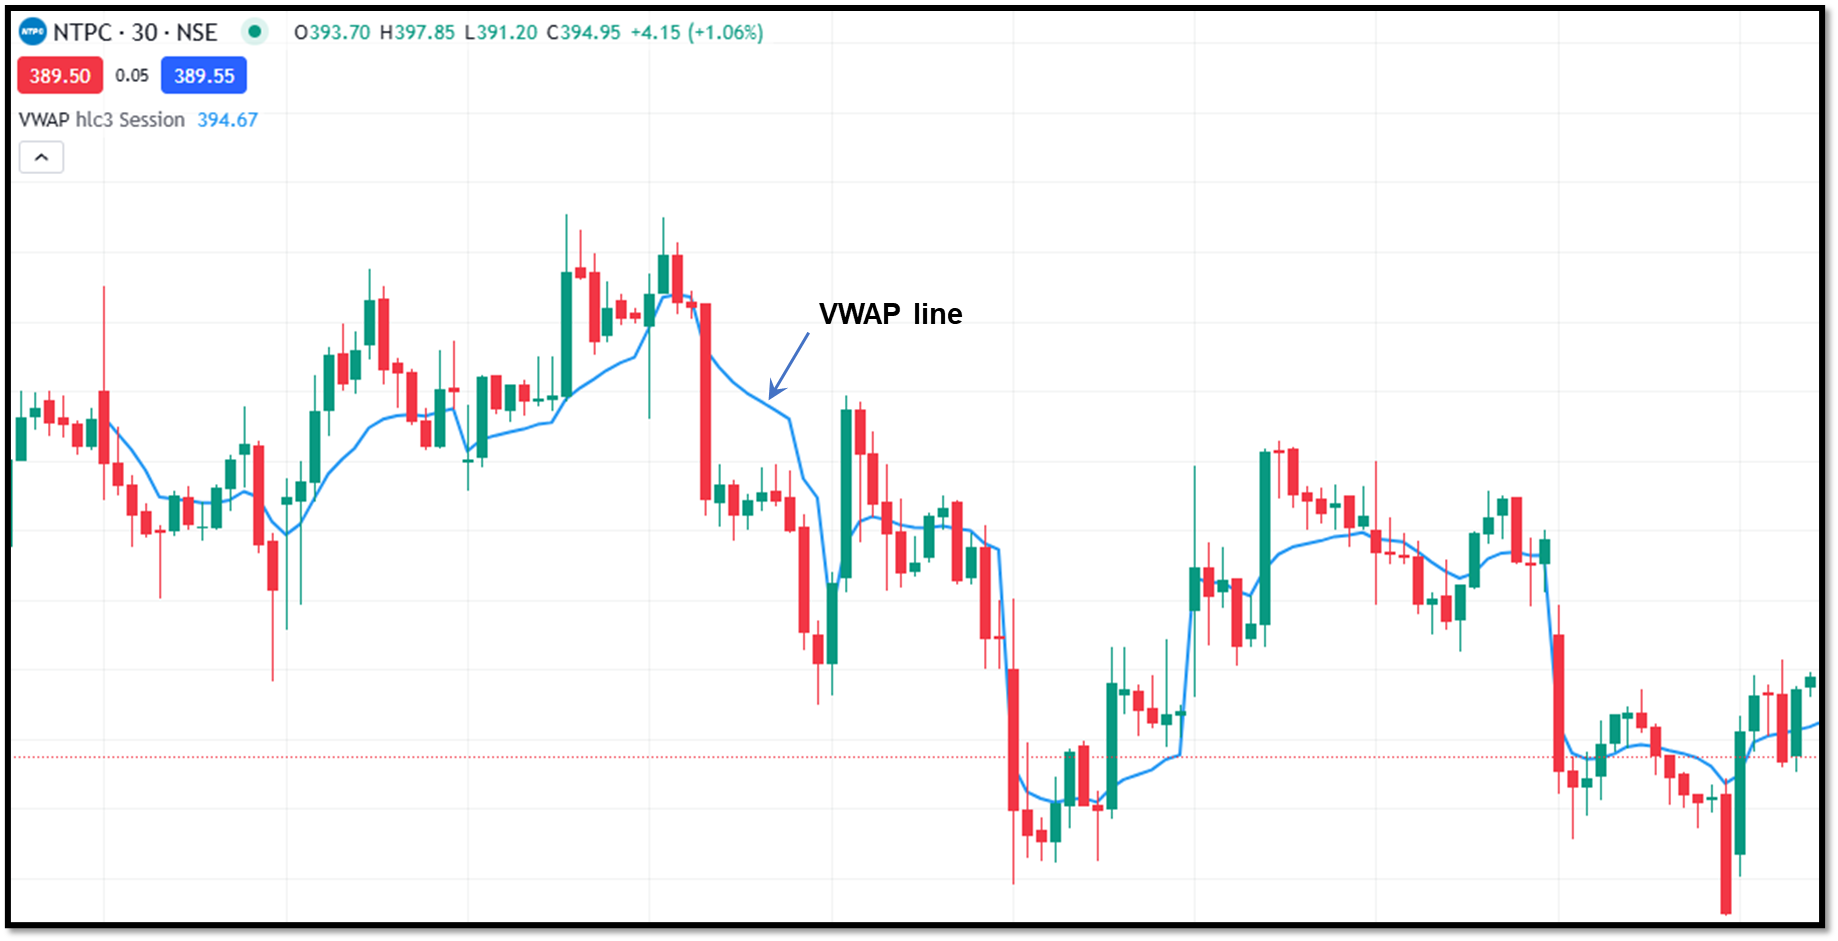
VWAP (Volume Weighted Average Price)
VWAP is calculated by summing the trade values (price X volume) and dividing by total shares traded. VWAP helps traders gauge fair market value and market sentiment. This tool gives data which is very important for intraday traders.
Money Flow Index (MFI)
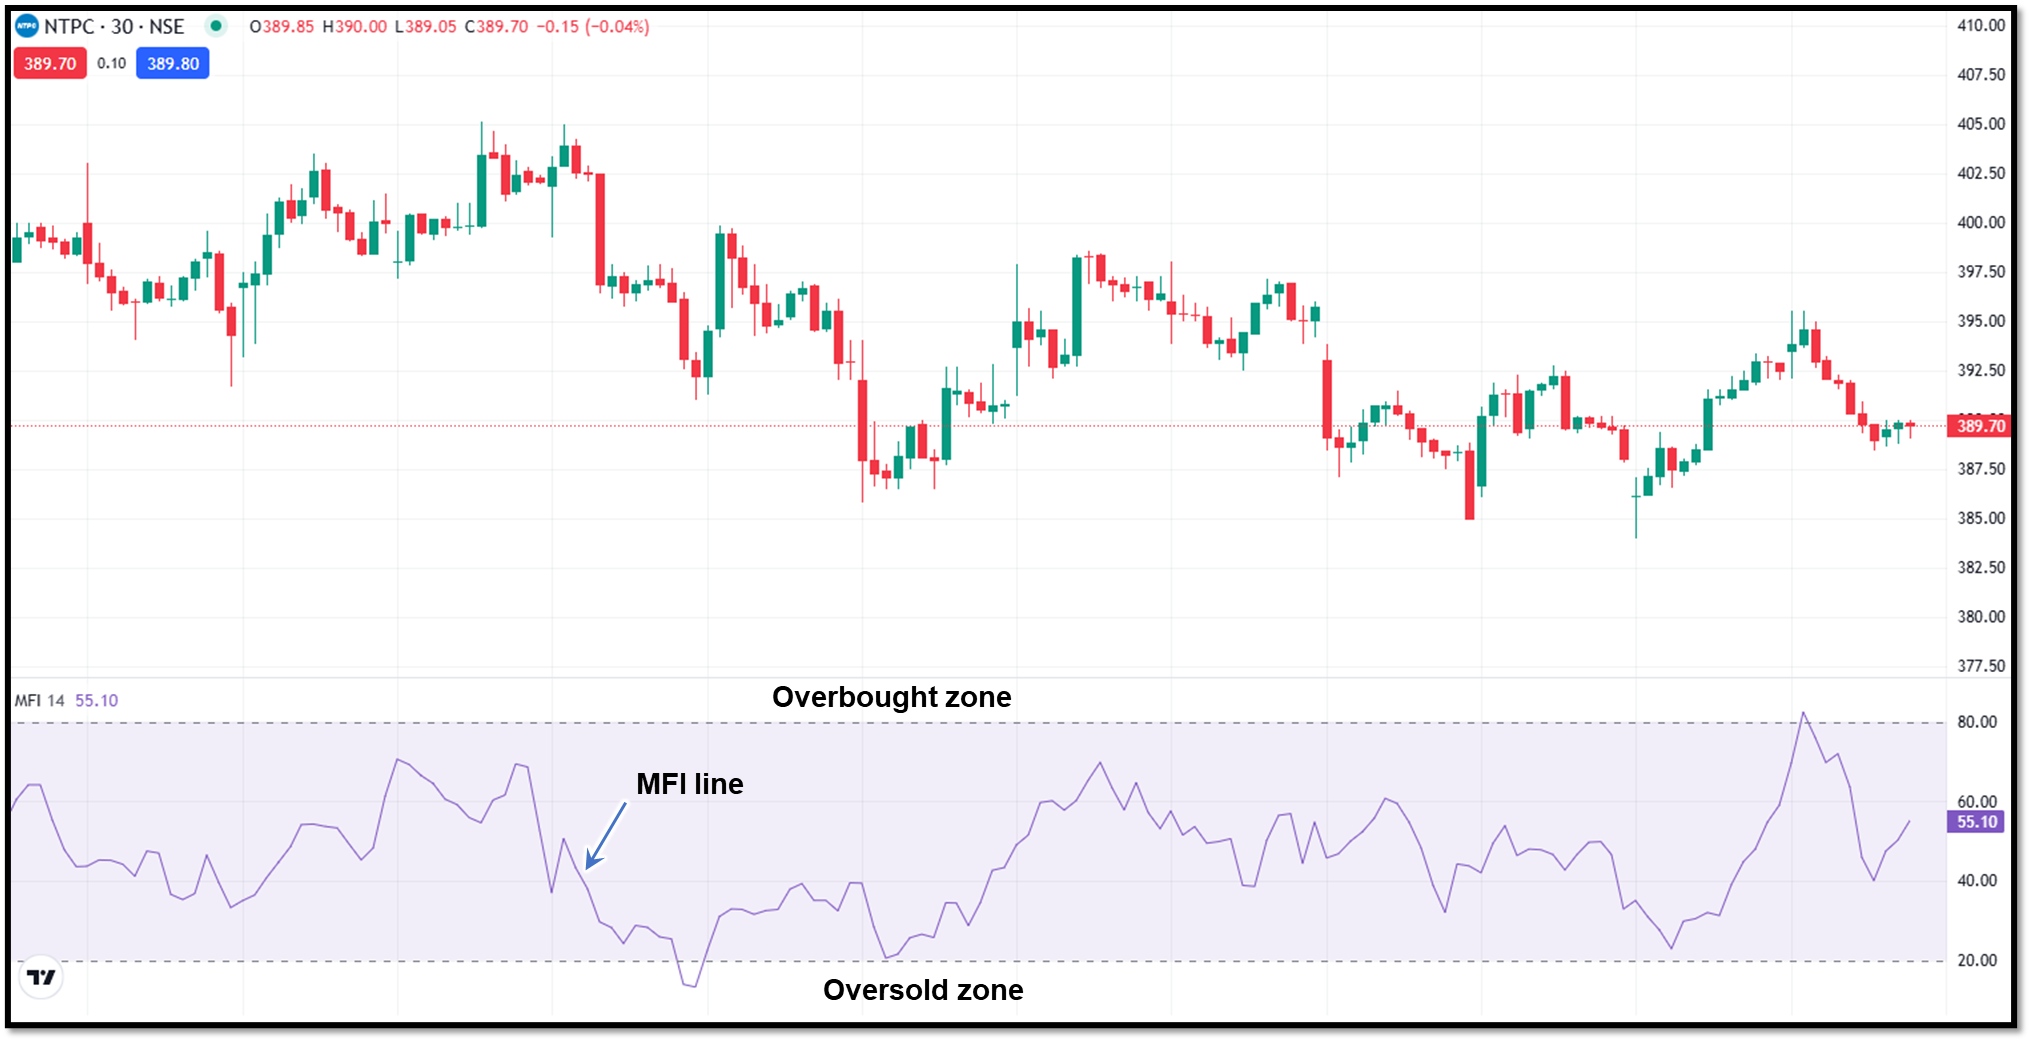
MFI combines price and volume. It will show you whether the money is getting added to an asset or it is going out.
Pivot Points
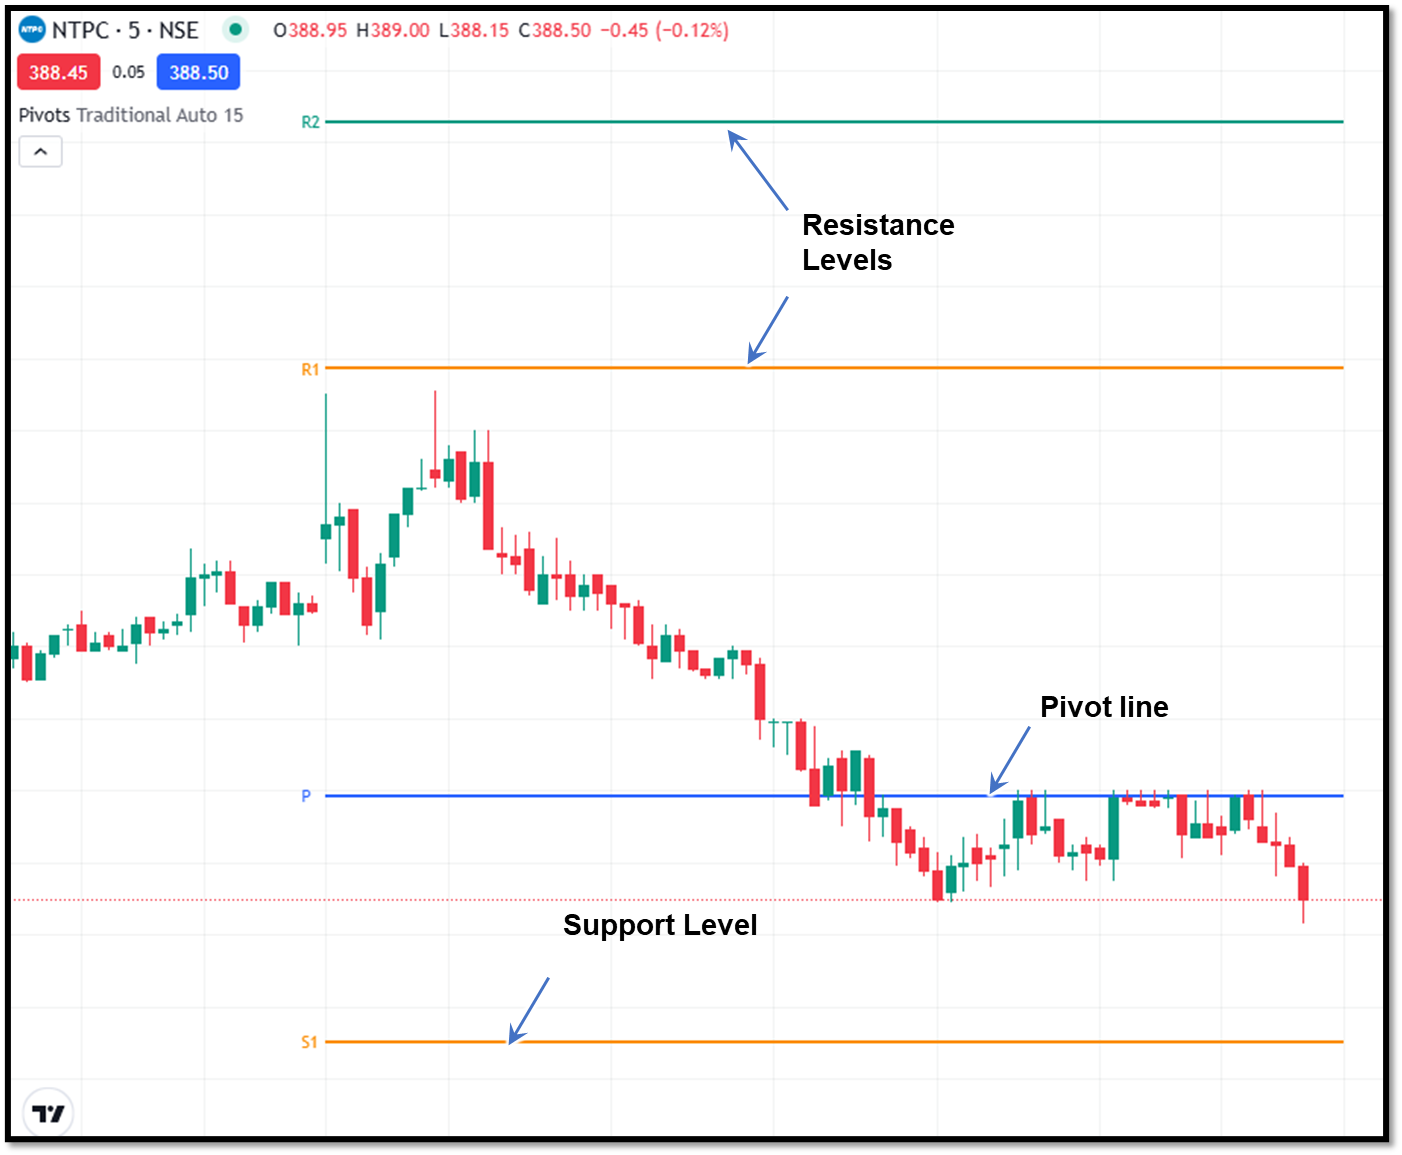
Pivot points are calculated from the previous period's high, low, and closing prices to predict future support and resistance levels. It will help you in identifying trend reversals or continuations, especially during intraday trading.
Fibonacci Retracement
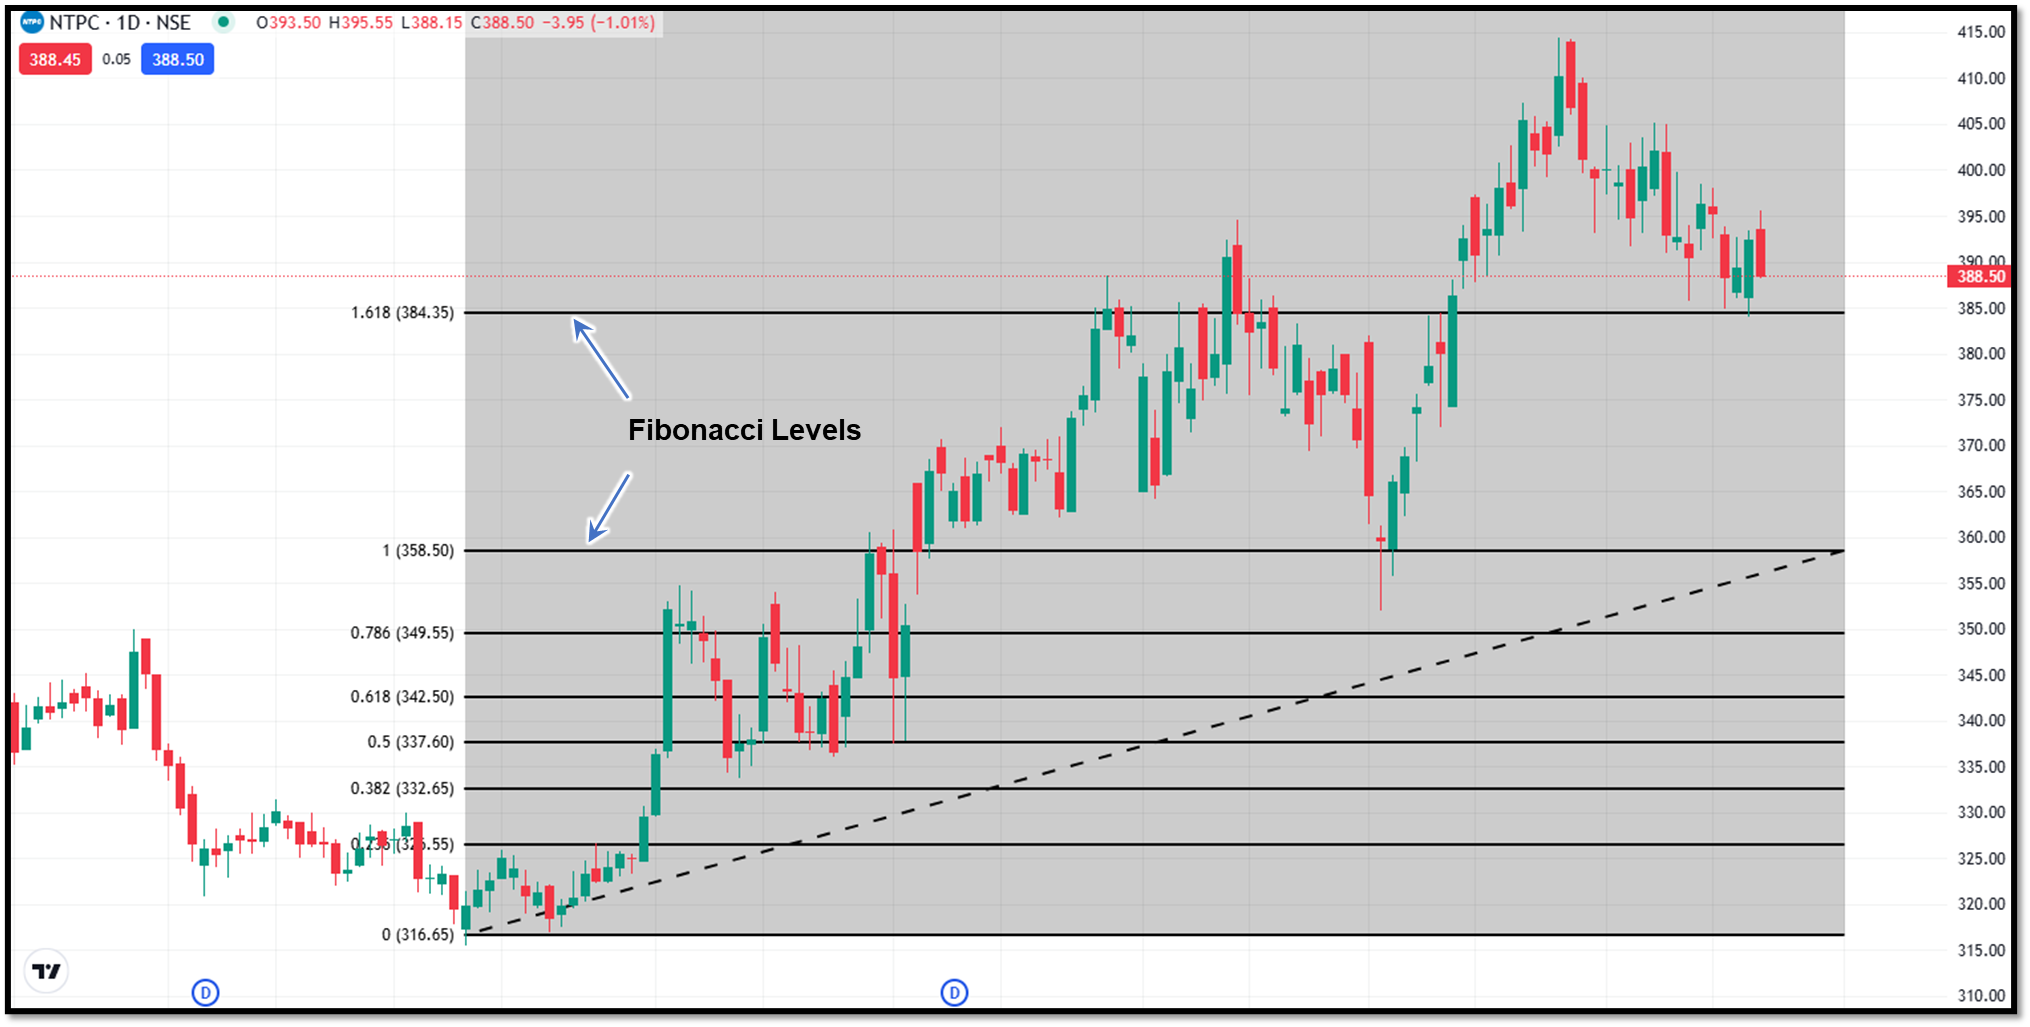
The Fibonacci retracement tool is a widely used and trusted tool which is based on the common ratios found in nature. This tool will help you identify potential pullback levels, using which you can set the stoploss or target.
Donchian Channels
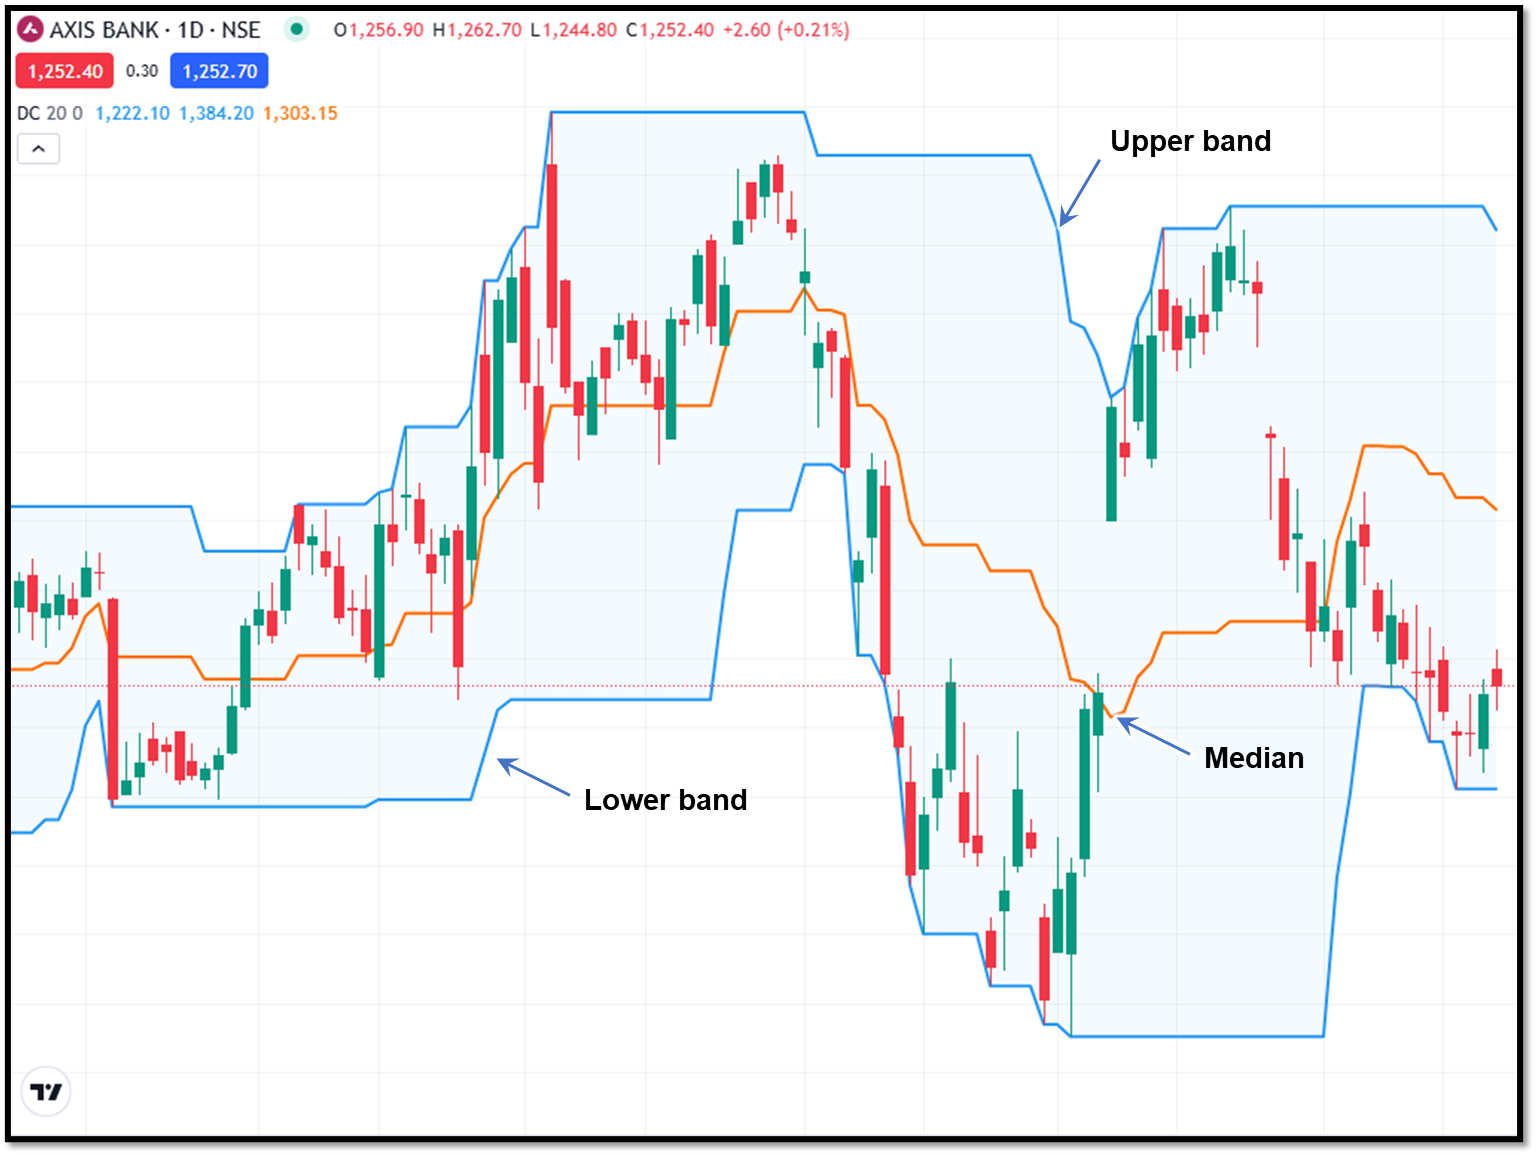
Donchian channels create upper and lower channels around price, showing the highest high and the lowest low over a set period of time. It will help you identify trends, volatility, and breakout/reversal points in trading.
Parabolic SAR
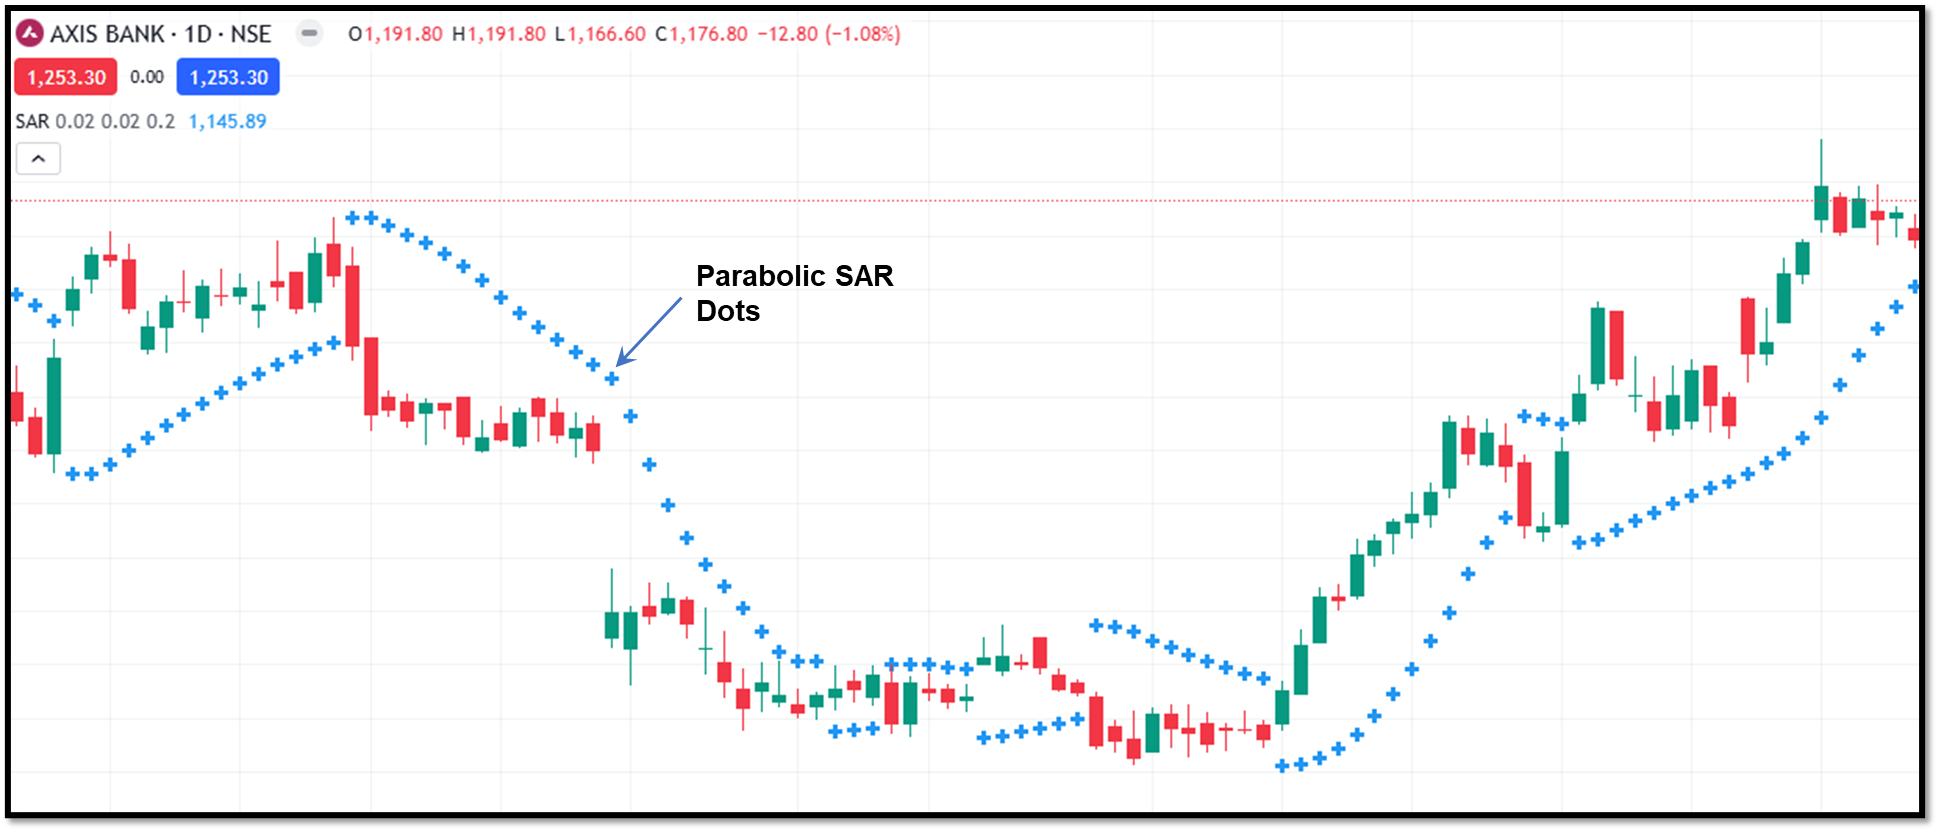
Parabolic SAR is a lagging indicator which follows the trend and is used to determine potential entry and exit points and trailing stop loss based on the price. It plots the dots along the chart, where dots above the price signal a bearish market and dots below the price signal a bullish market.
Final thoughts
The top 20 trading indicators in 2026 are popular and time-tested. These indicators are trusted and used by professional traders. Understanding these indicators and applying them with discipline will uplift you to a new level. Although the indicators are backed by data, real knowledge is knowing when to use the indicators and how to align them with market conditions.
There is no guarantee of profits by using the indicators, but you can make informed decisions which are data-backed, which increases winning probability.
FAQs
Are trading indicators still useful in 2026?
Yes. Trading indicators are still used in 2026 as decision-support tools. They are used to analyse trend, momentum, volatility and volume.
Should indicators be used alone for trading decisions?
No. Using a single indicator increases the risk of a false signal. Traders use 2-3 different indicators, which increases the accuracy.
Do indicators guarantee profitable trades?
No. Profit depends upon various other factors as well. Indicators will help you understand the market structure and improve your decision-making.
How many indicators should a trader use at one time?
Using a large number of indicators will create unnecessary confusion, and also relying on a single indicator can give you a false signal. Professional traders use 2 - 3 indicators that provide different sets of data and support each other for decision-making.
Which indicators are best for beginners?
There are multiple beginner-friendly indicators, but you can start with Moving Averages, RSI, Bollinger Bands, and Volume, as they are easy to interpret and widely applicable.







