Loading...
Scanning the Markets...
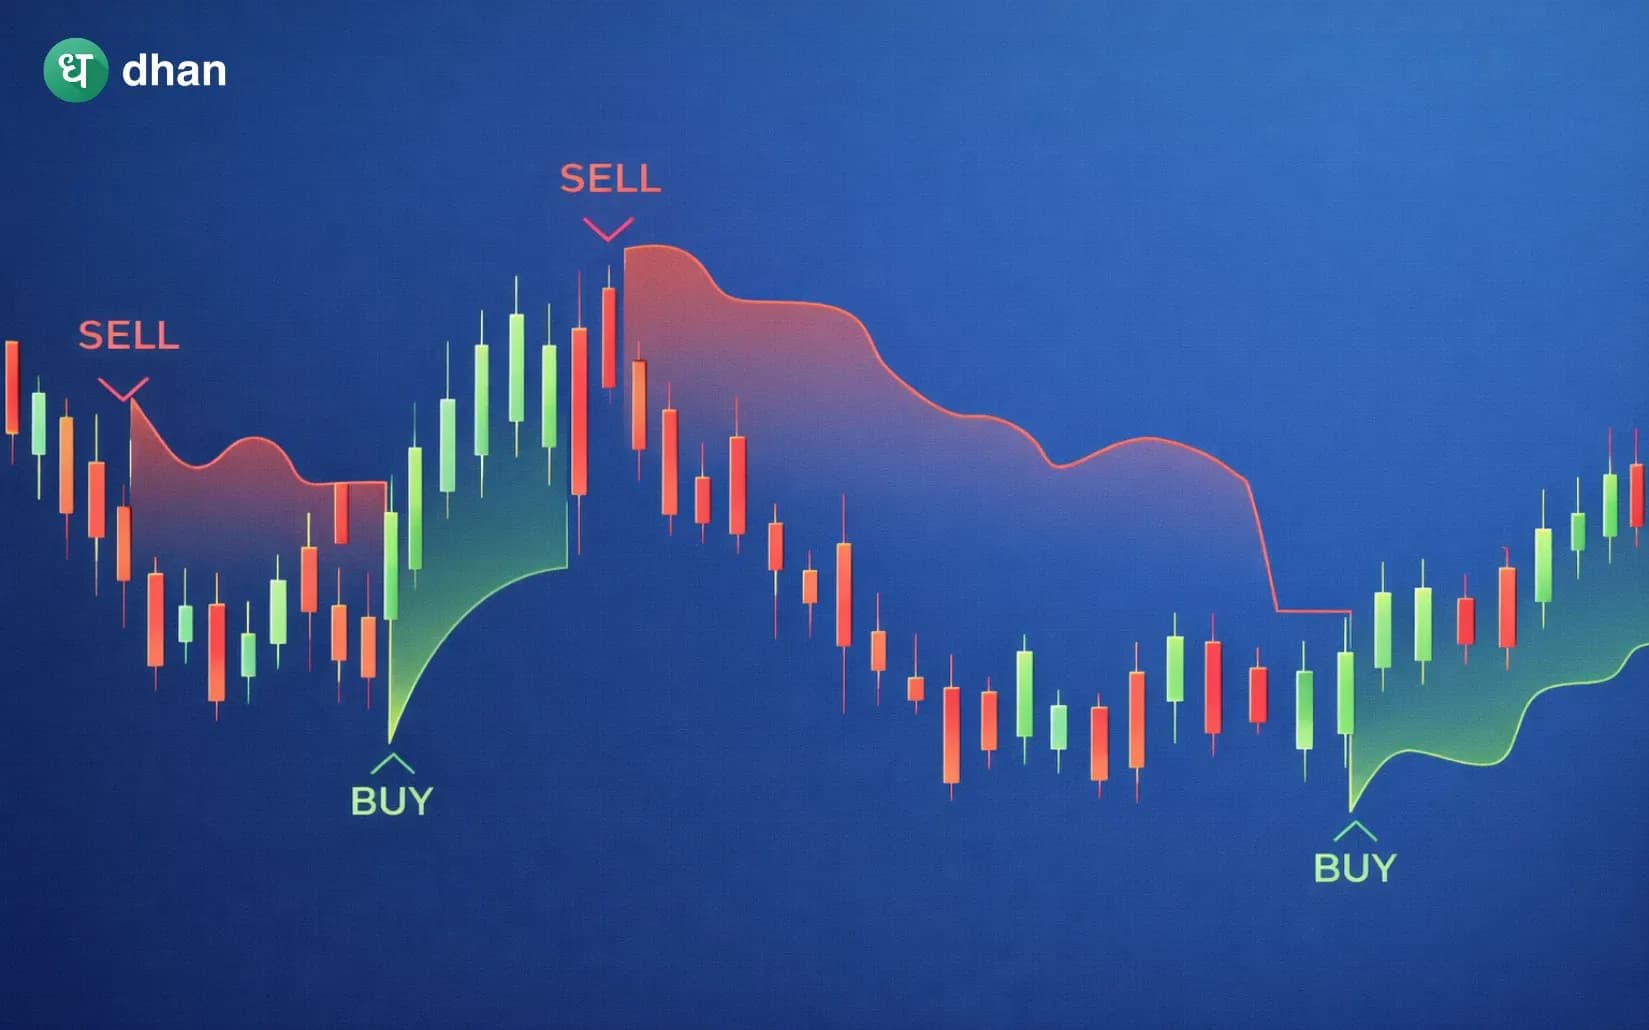
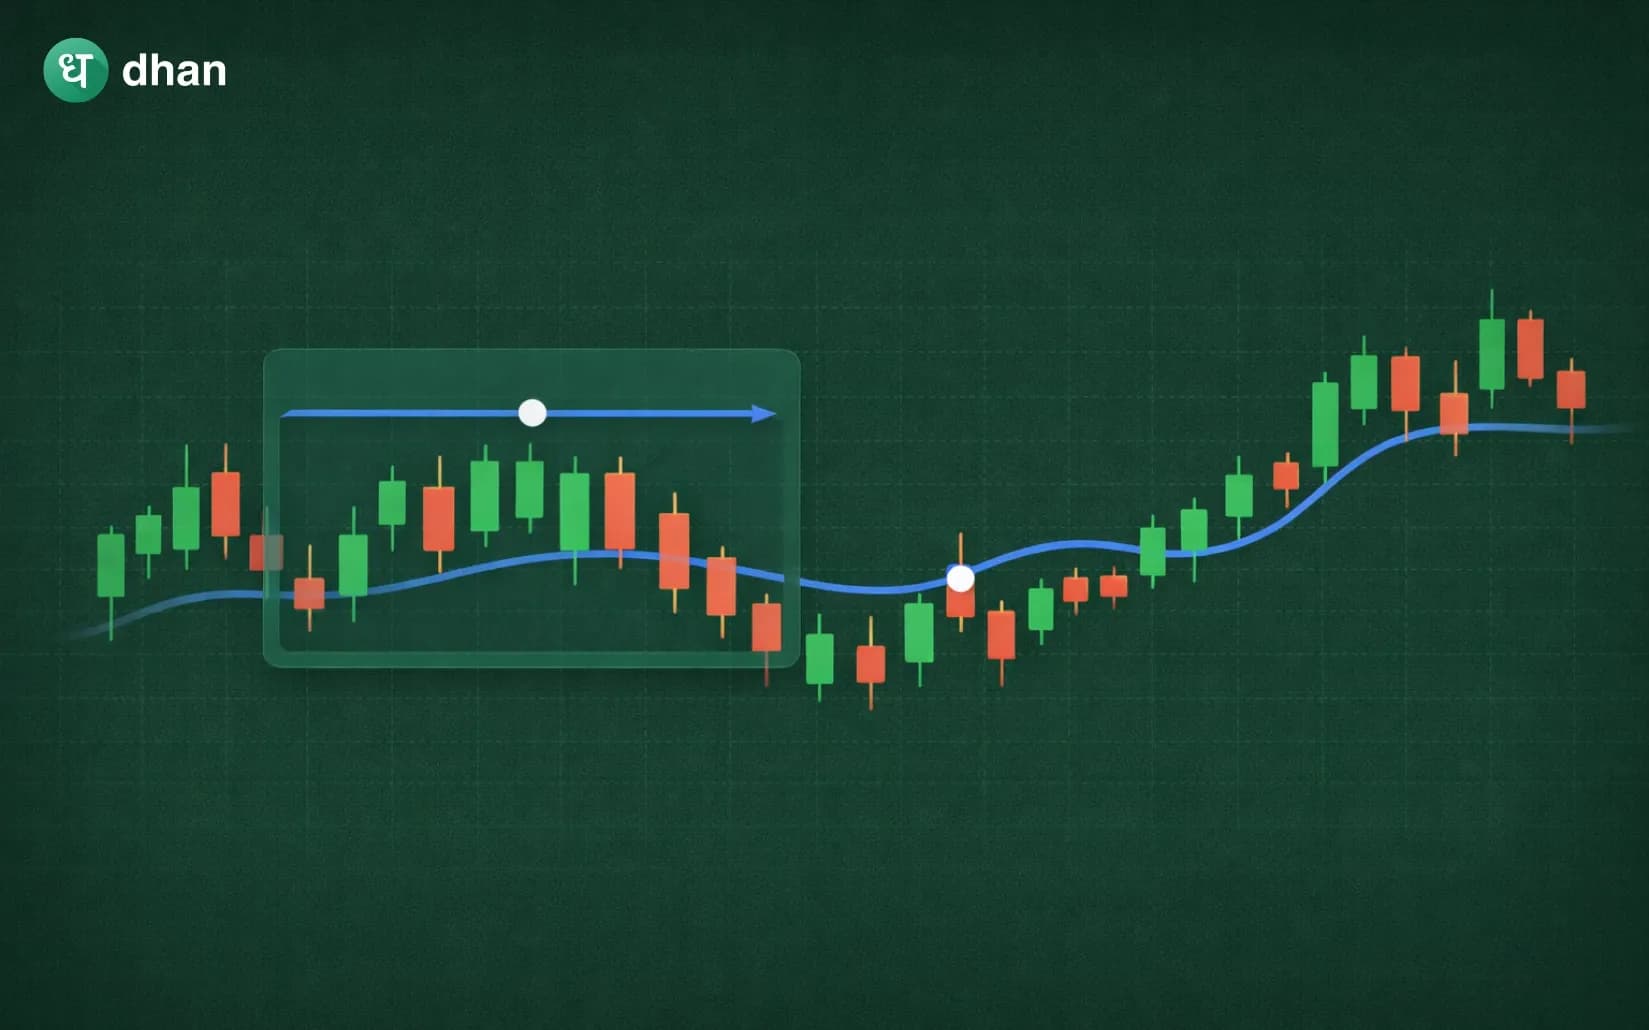
Learn how the Supertrend indicator works, its formula, signals, and strategies to identify trends and improve trading decisions.
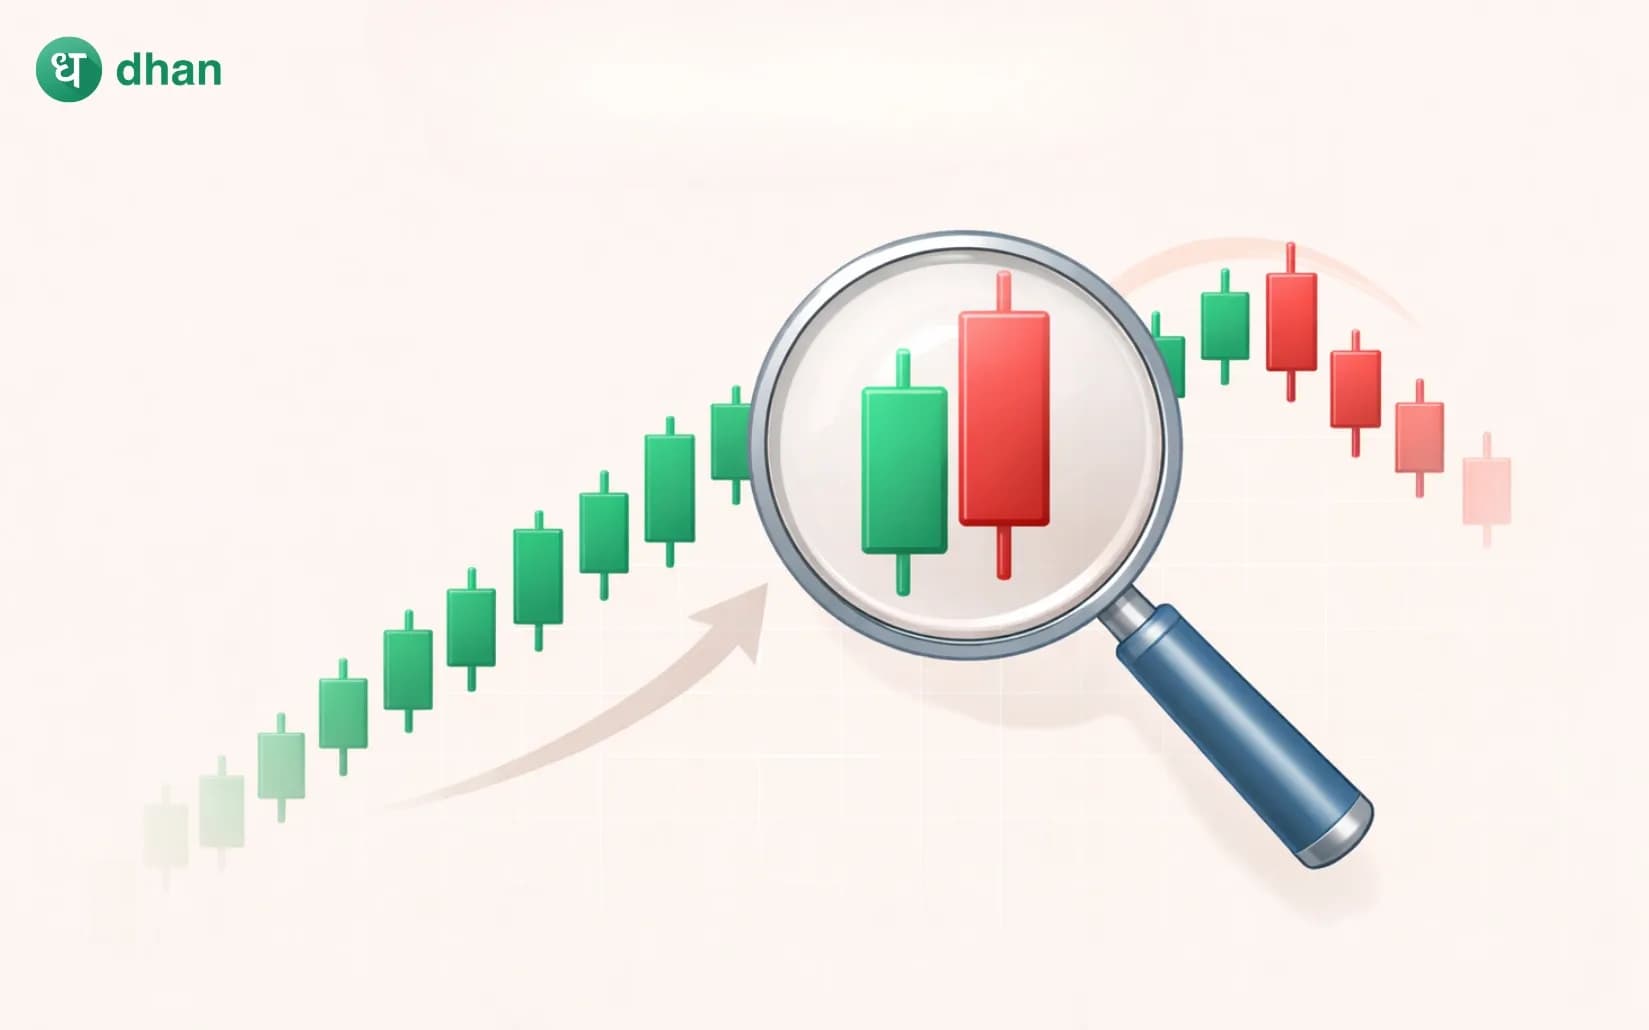
Spot bearish candle patterns early with key signals and proven tips to catch trend reversals before major market drops.